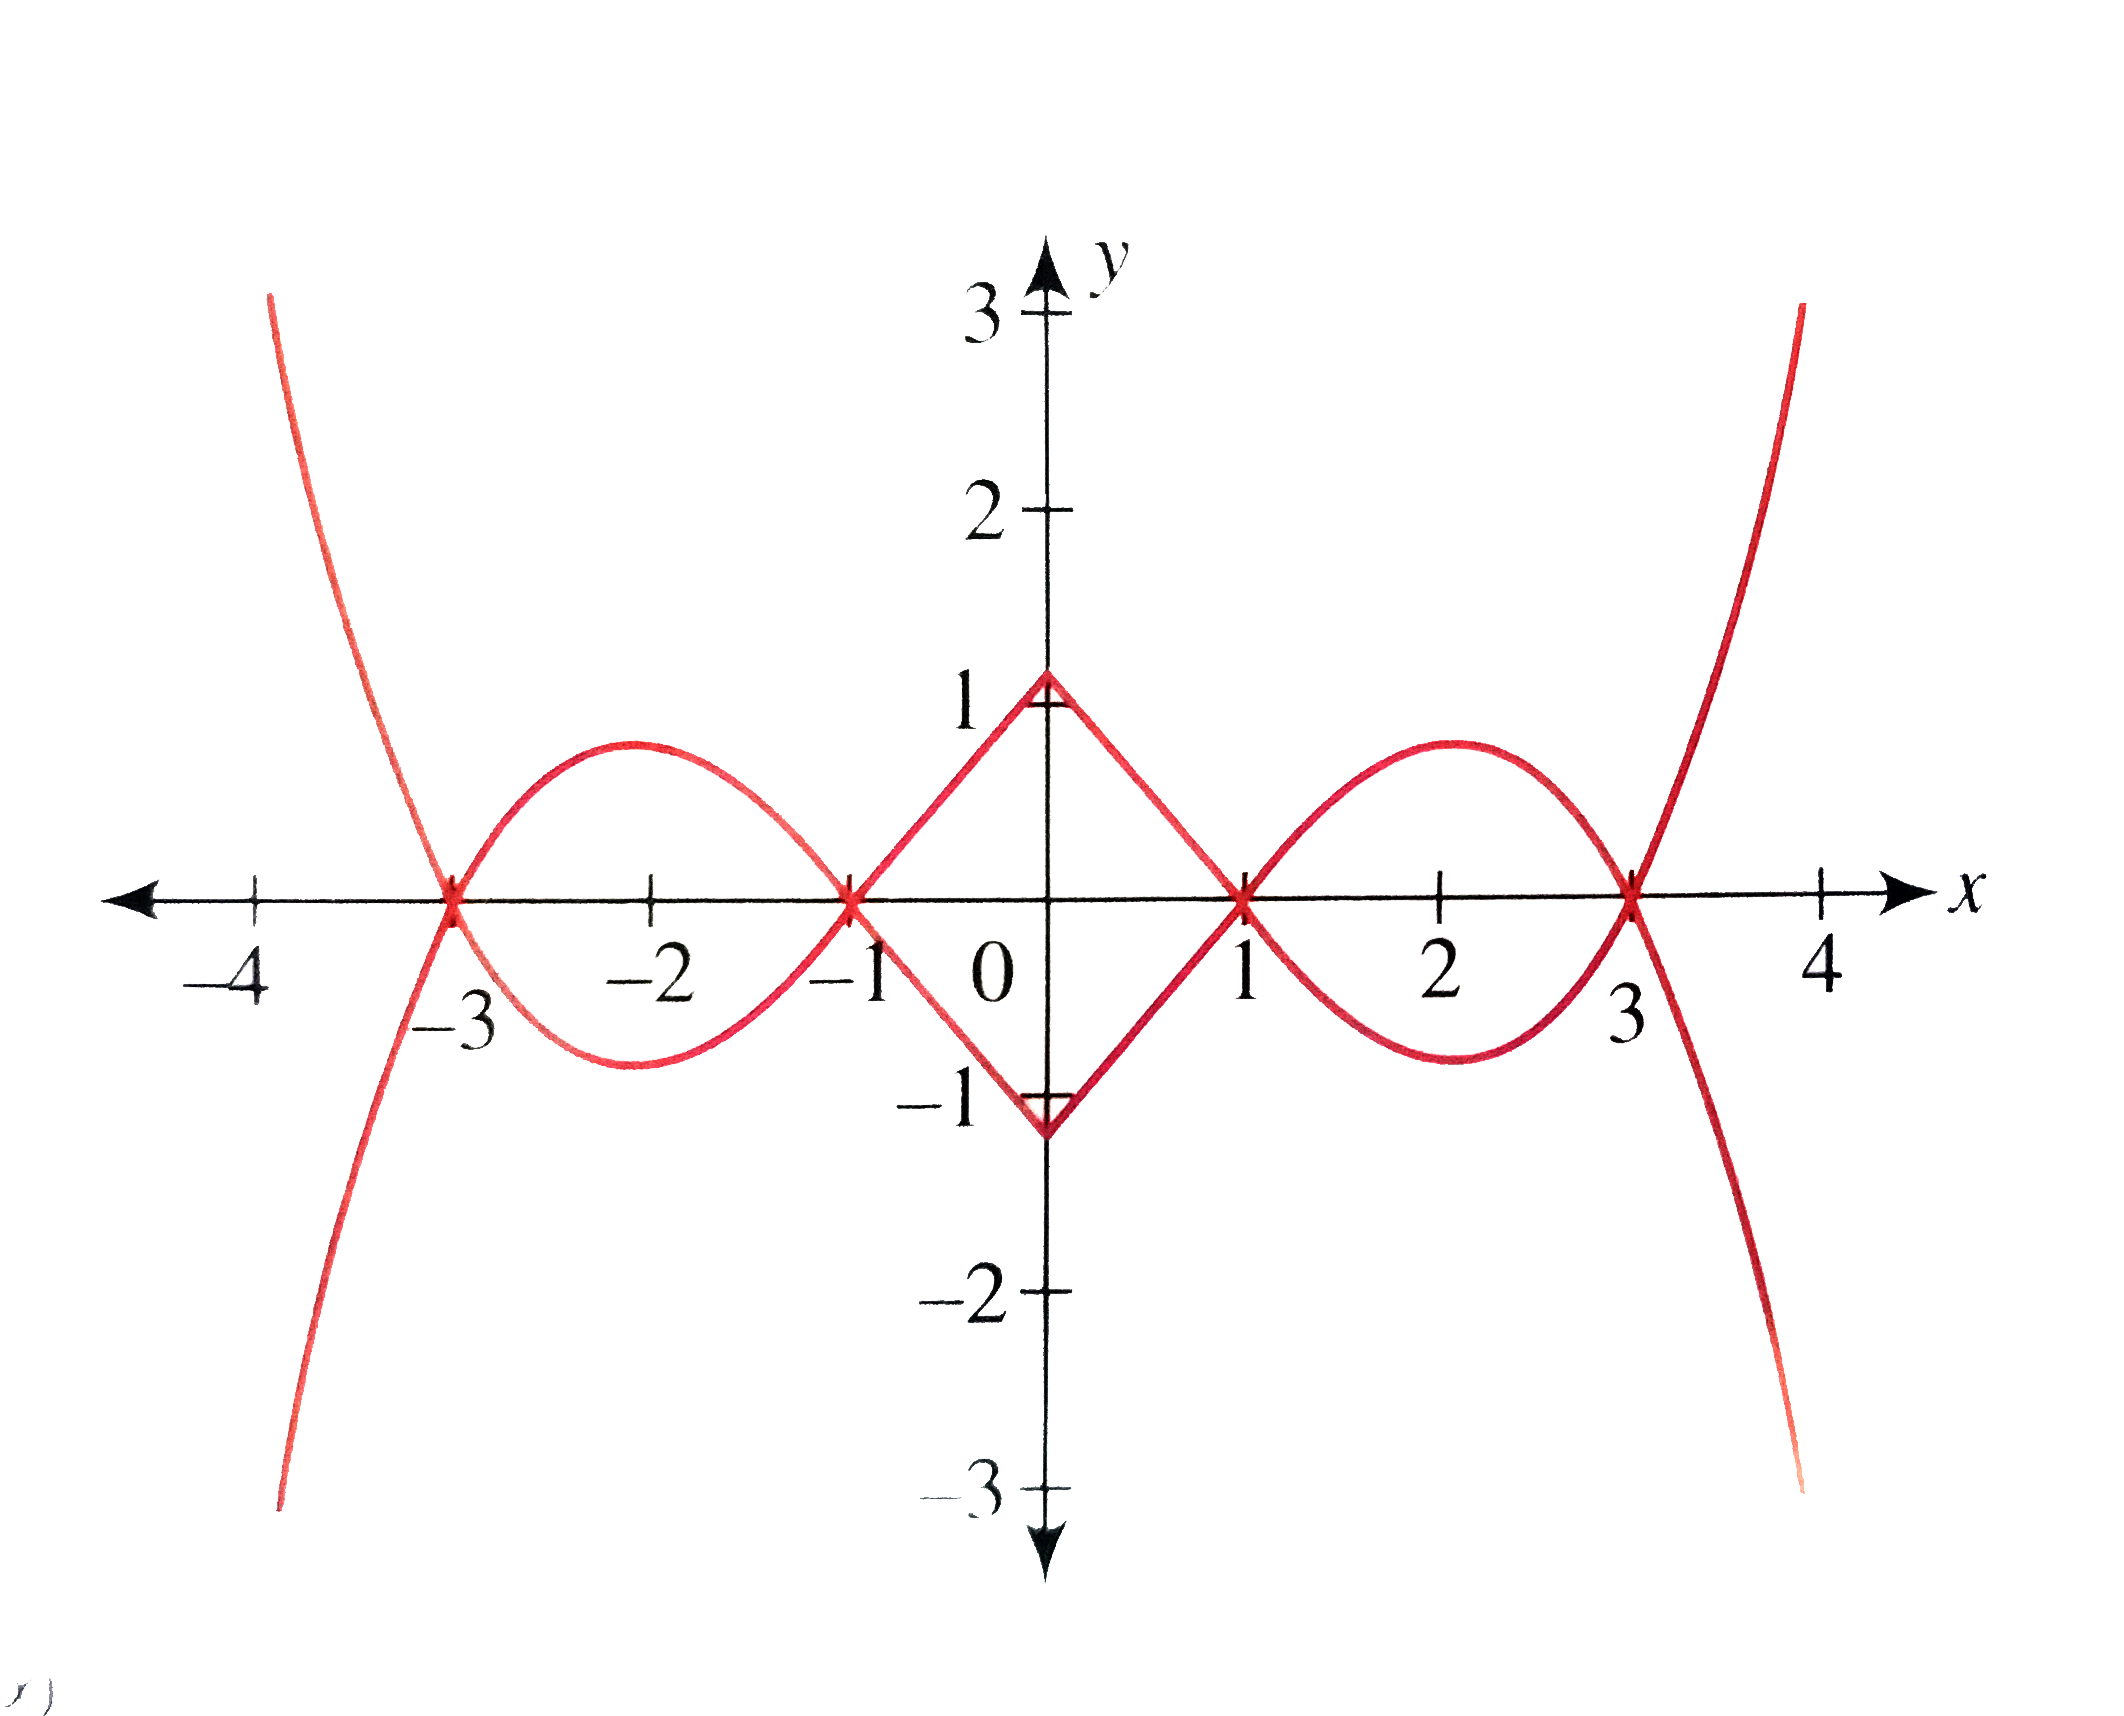
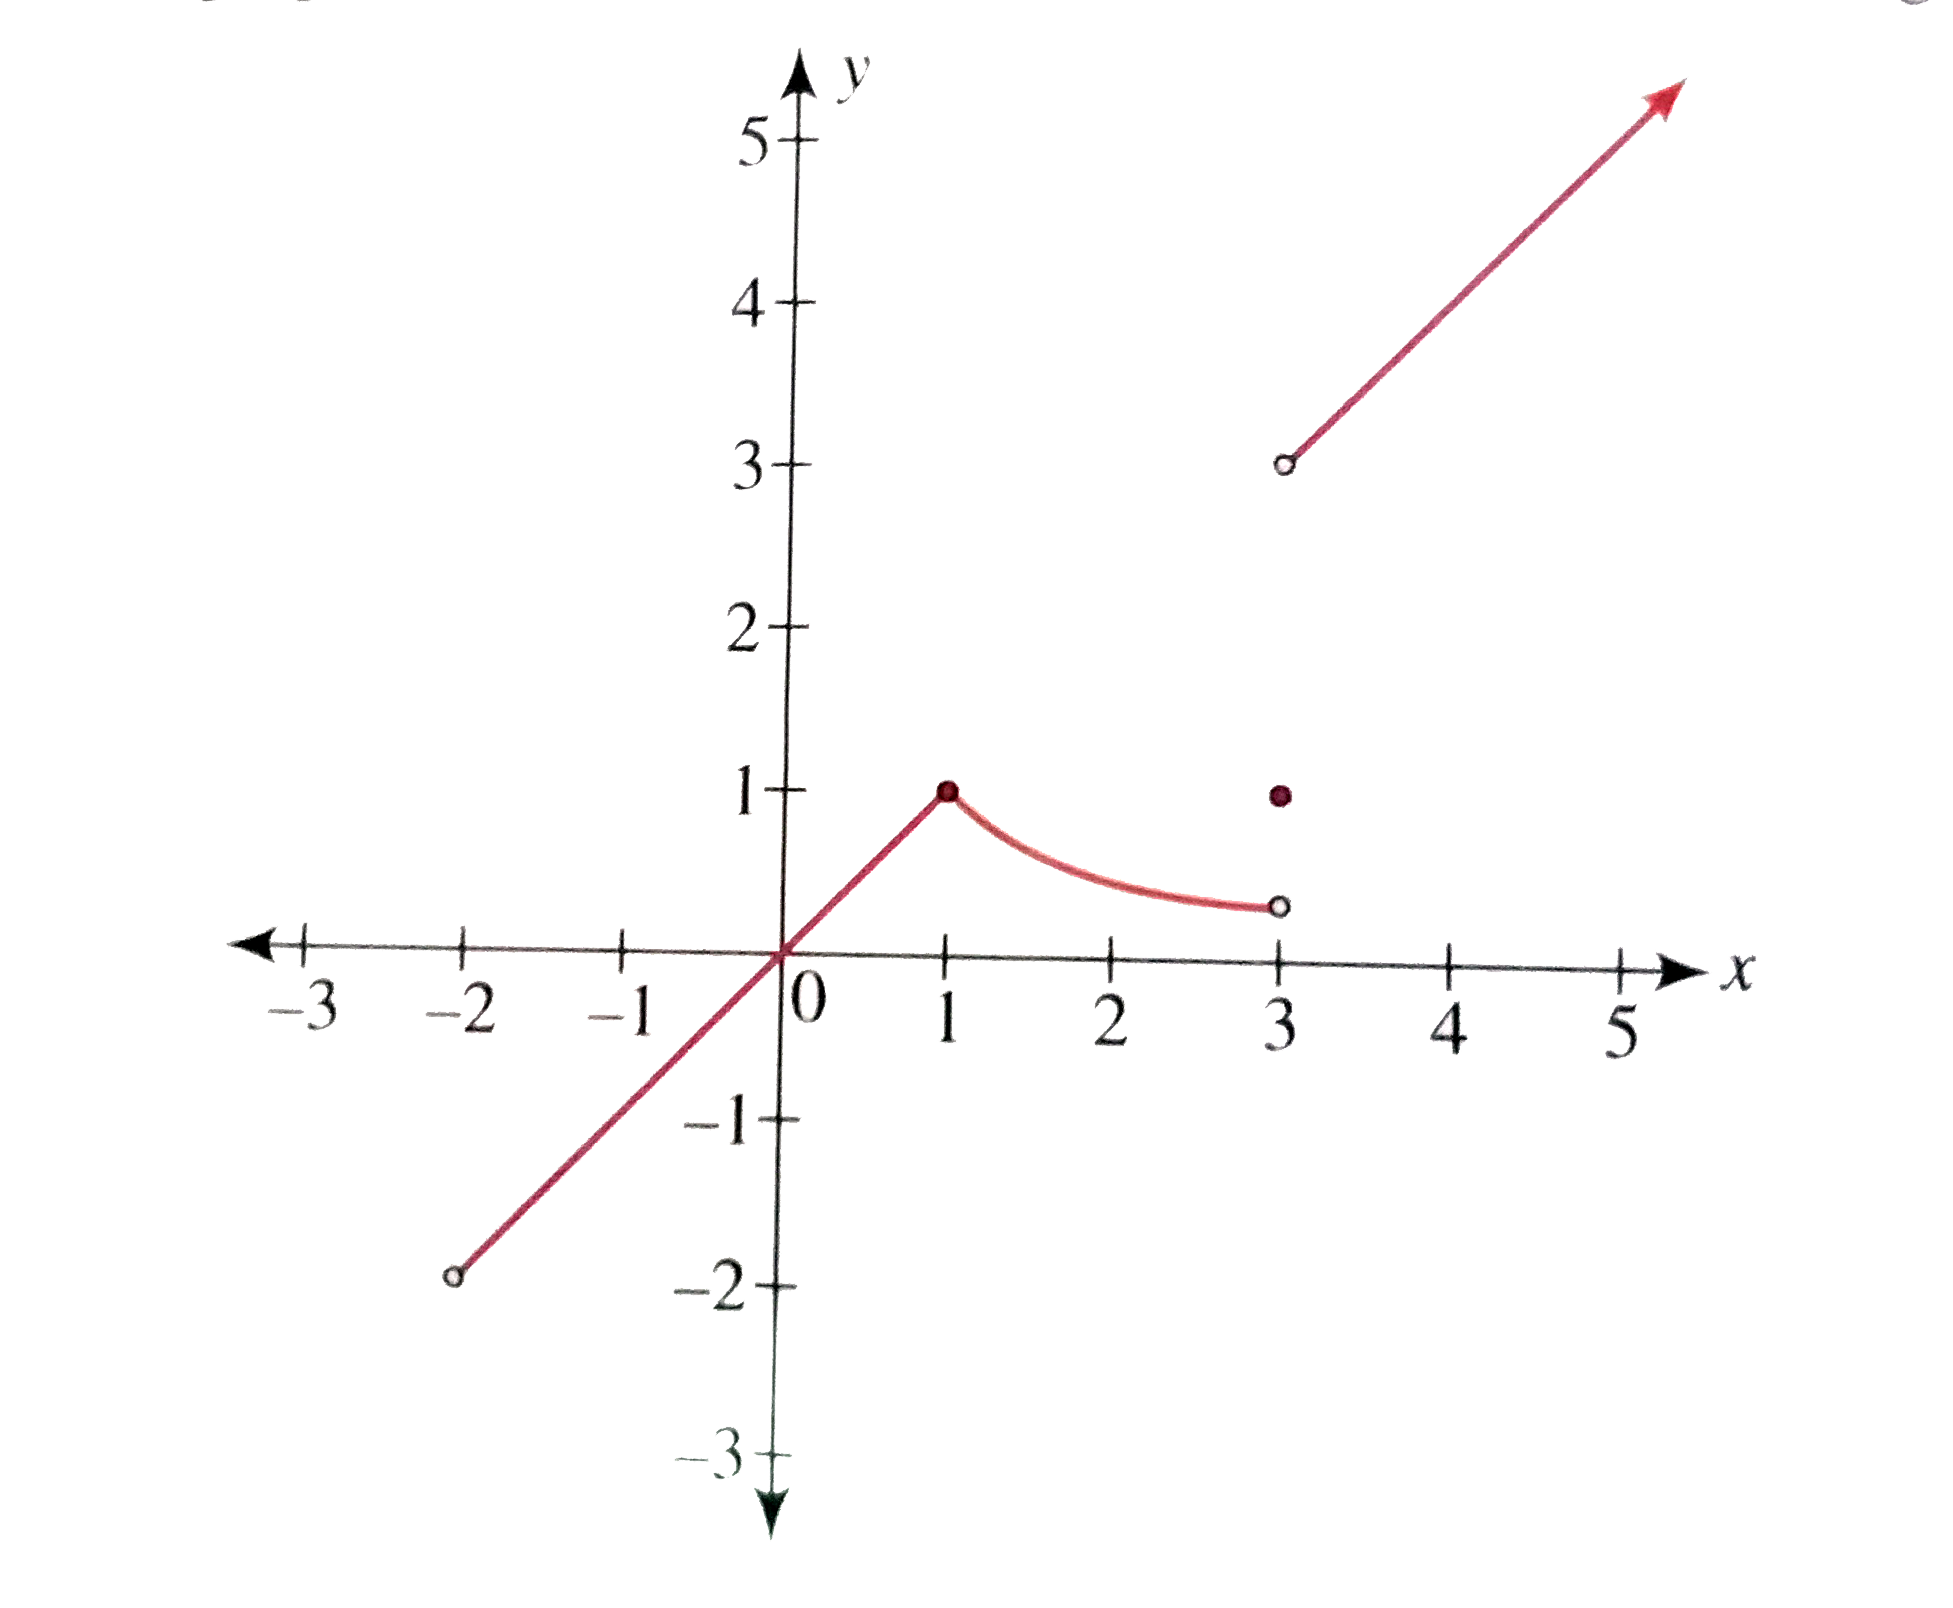
The graph of the function is as shown in the figure.
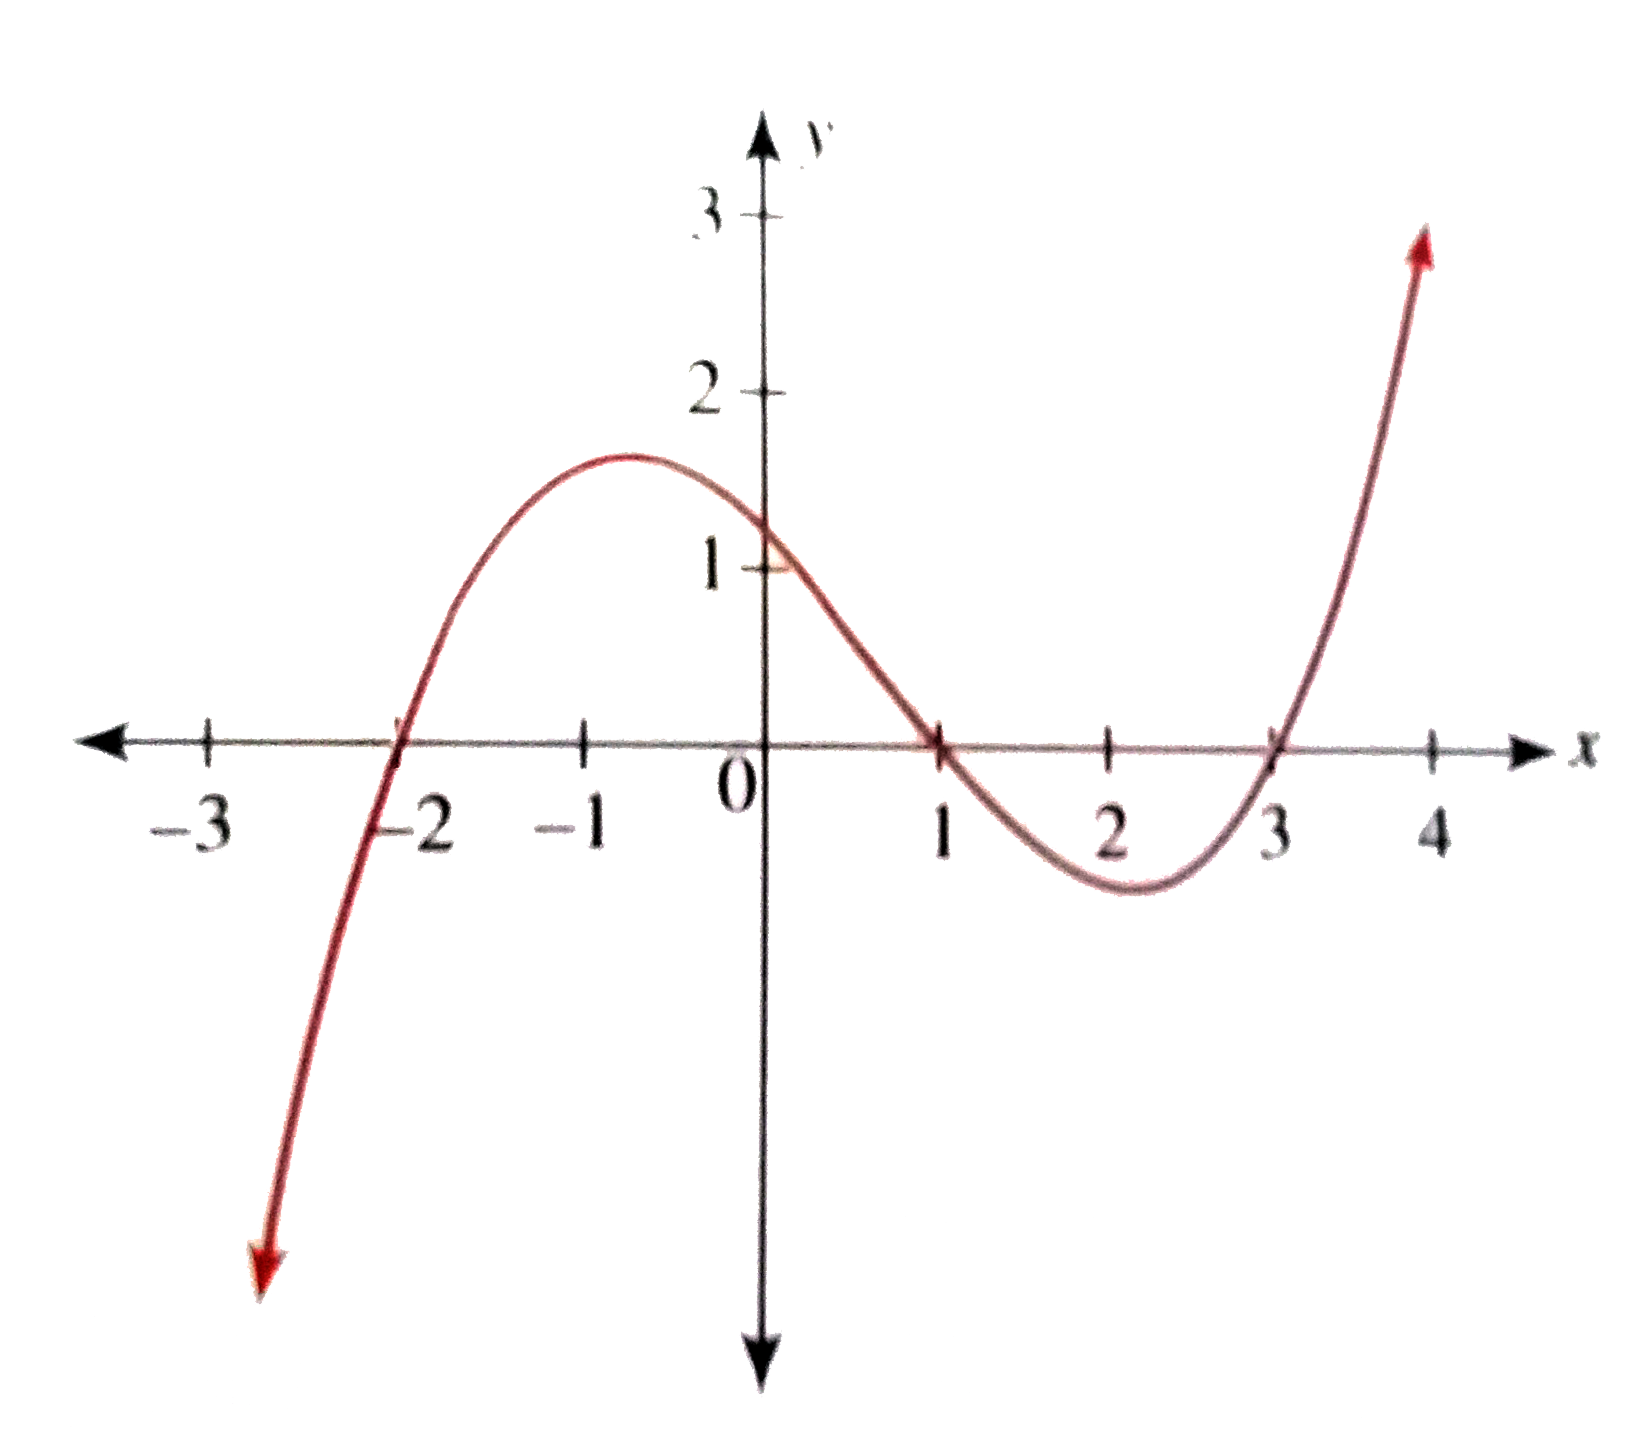
Then draw the graphs of
(i) (ii)
(iii) Solution in Bengali
(i)
At
Hence the graph is as follows.
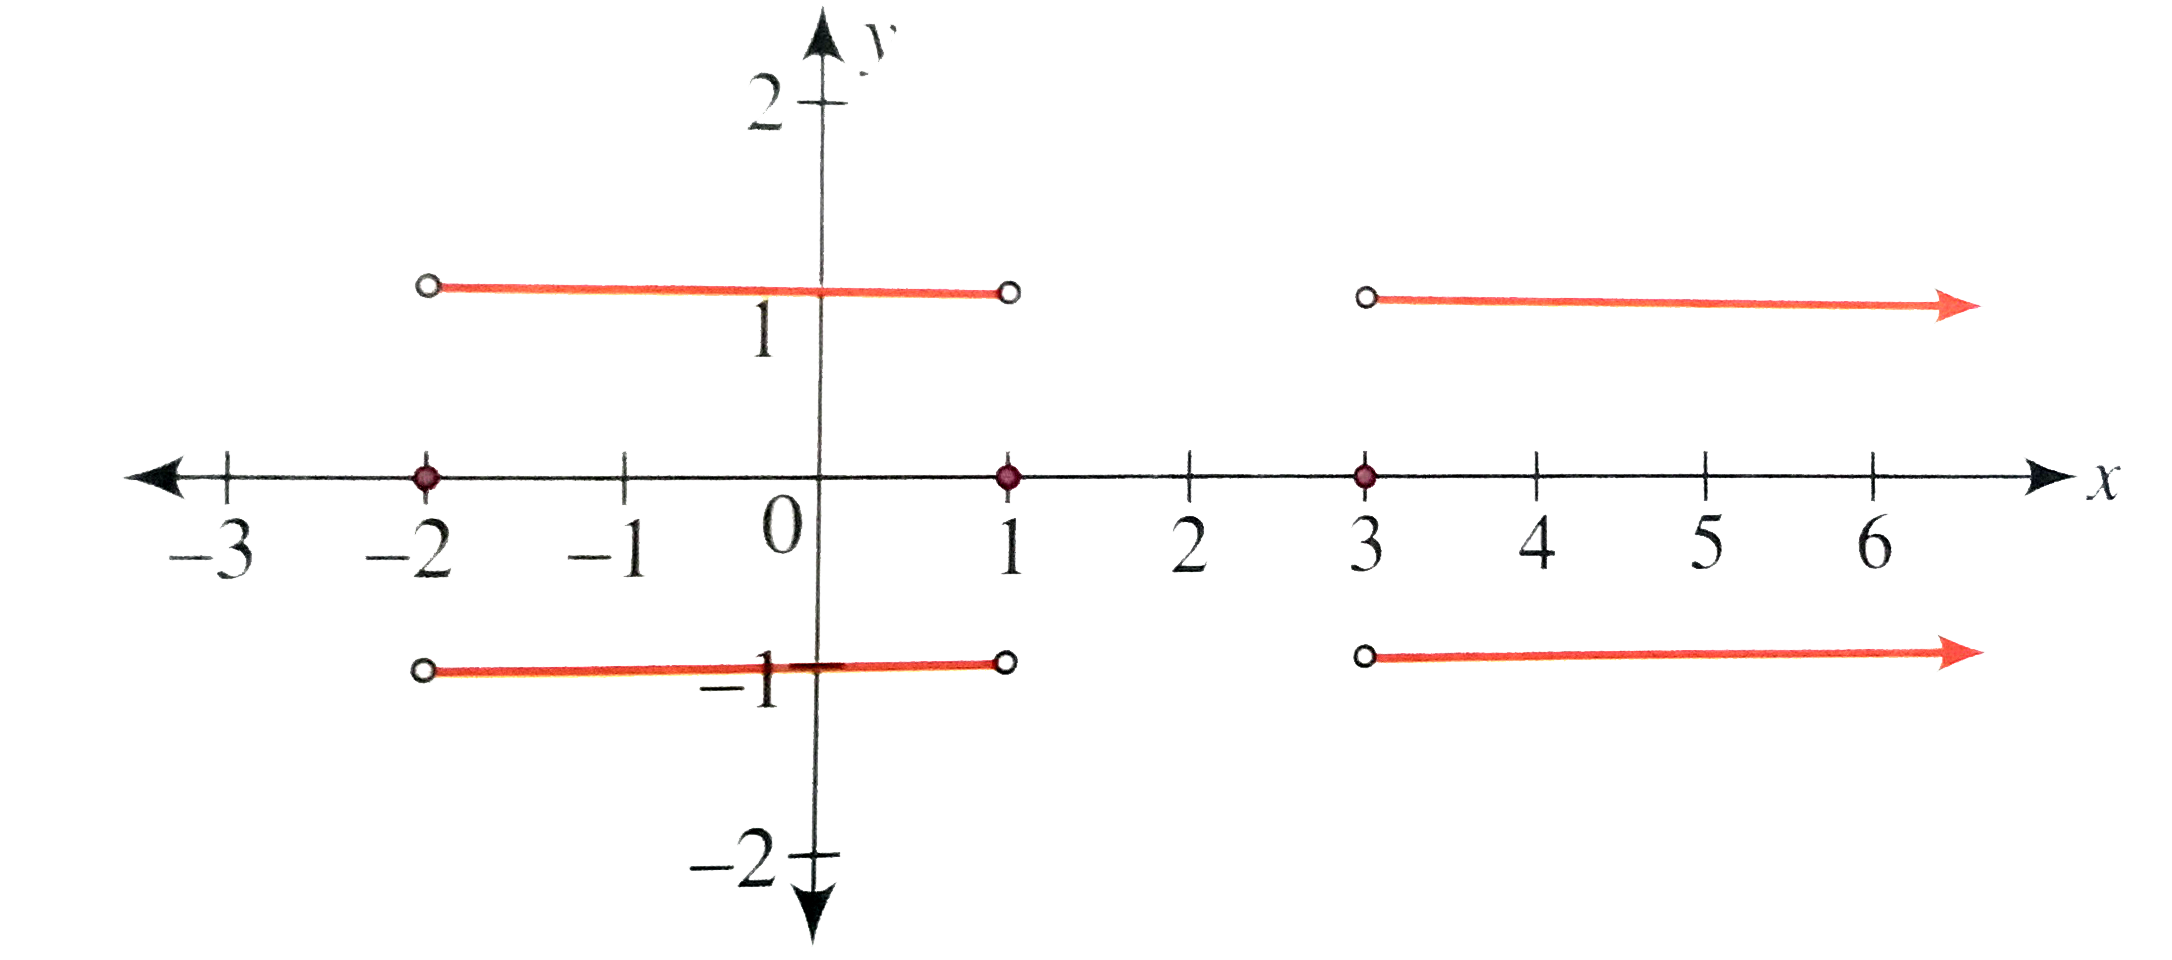
(ii)
Graph of
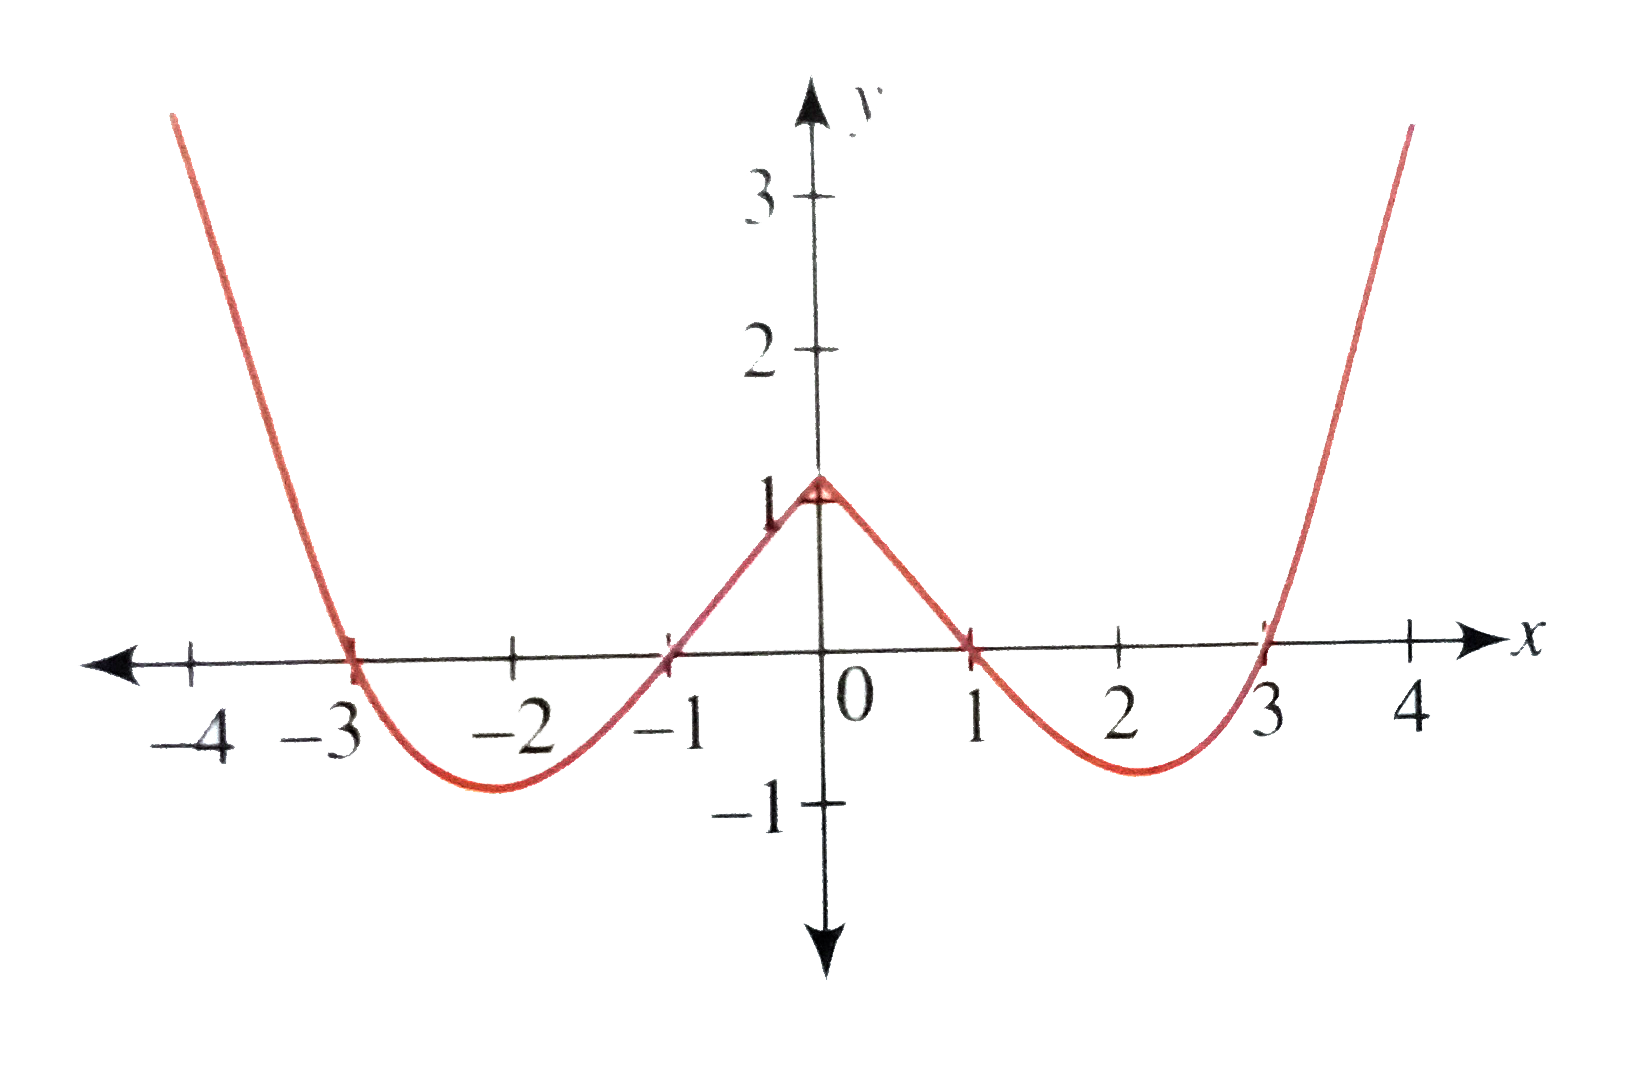
Graph of
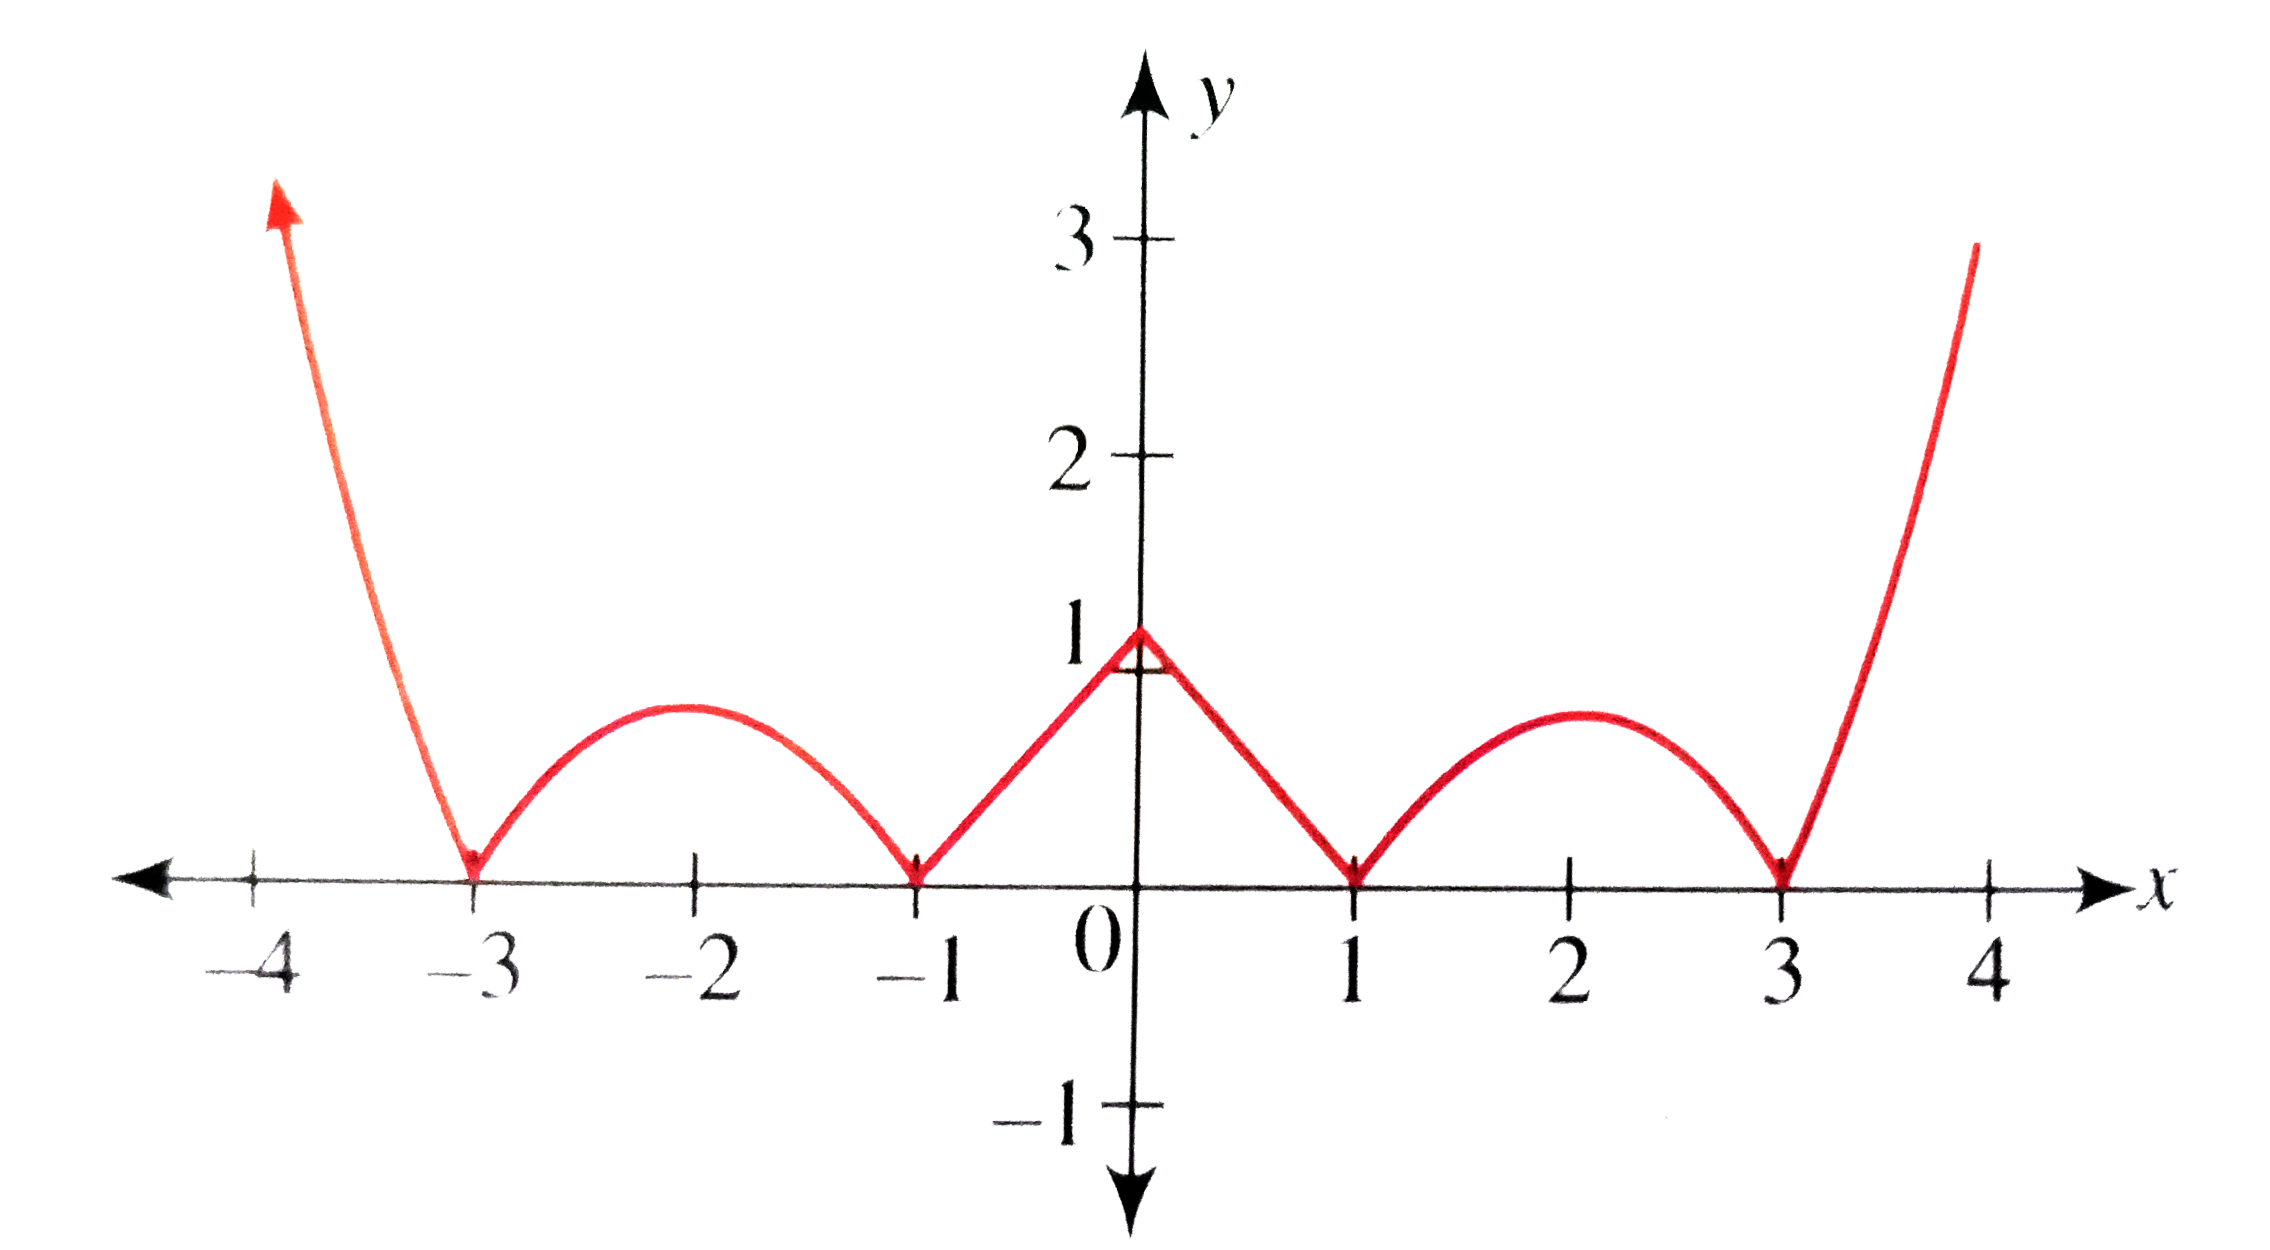
Graph of
(iii) For
For
For
Hence the graph of the function is as shown in the following figure.
Topper's Solved these Questions
- GRAPH OF INVERSE TRIGONOMETRIC FUNCTIONSBook:CENGAGE PUBLICATIONChapter:GRAPH OF INVERSE TRIGONOMETRIC FUNCTIONSExercise:Exercises
Explore 18 Videos
- GRAPHS OF POLYNOMIAL AND RATIONAL FUNCTIONSBook:CENGAGE PUBLICATIONChapter:GRAPHS OF POLYNOMIAL AND RATIONAL FUNCTIONSExercise:Exercises
Explore 17 Videos
Similar Questions
Draw the graph of y=tan−1x−cot−1x.
View SolutionDraw the graph of y=(x−1)(x2−x+1).
View SolutionIf f(x)=sin(pi x), then draw the graph of the followings :(i)y=f(|x|)( ii) y=f(-|x|) (iii) |y|=f(x)
View SolutionThe graph of the function y=f(x) is as shown in the figure.

Then draw the graphs of
(i) |y|=sgn(f(x)) (ii) |y|=|f(x∣)|
(iii) y=xsgn(f(x))
View SolutionThe graph of y = f(x) is shown, find the number of solution of f(f(x)) = 2.
(##CEN_GRA_C01_S01_007_Q01.png" width="80%">
View SolutionGiven the graph of the function y=f(x), draw the graph of y=sgn(x).
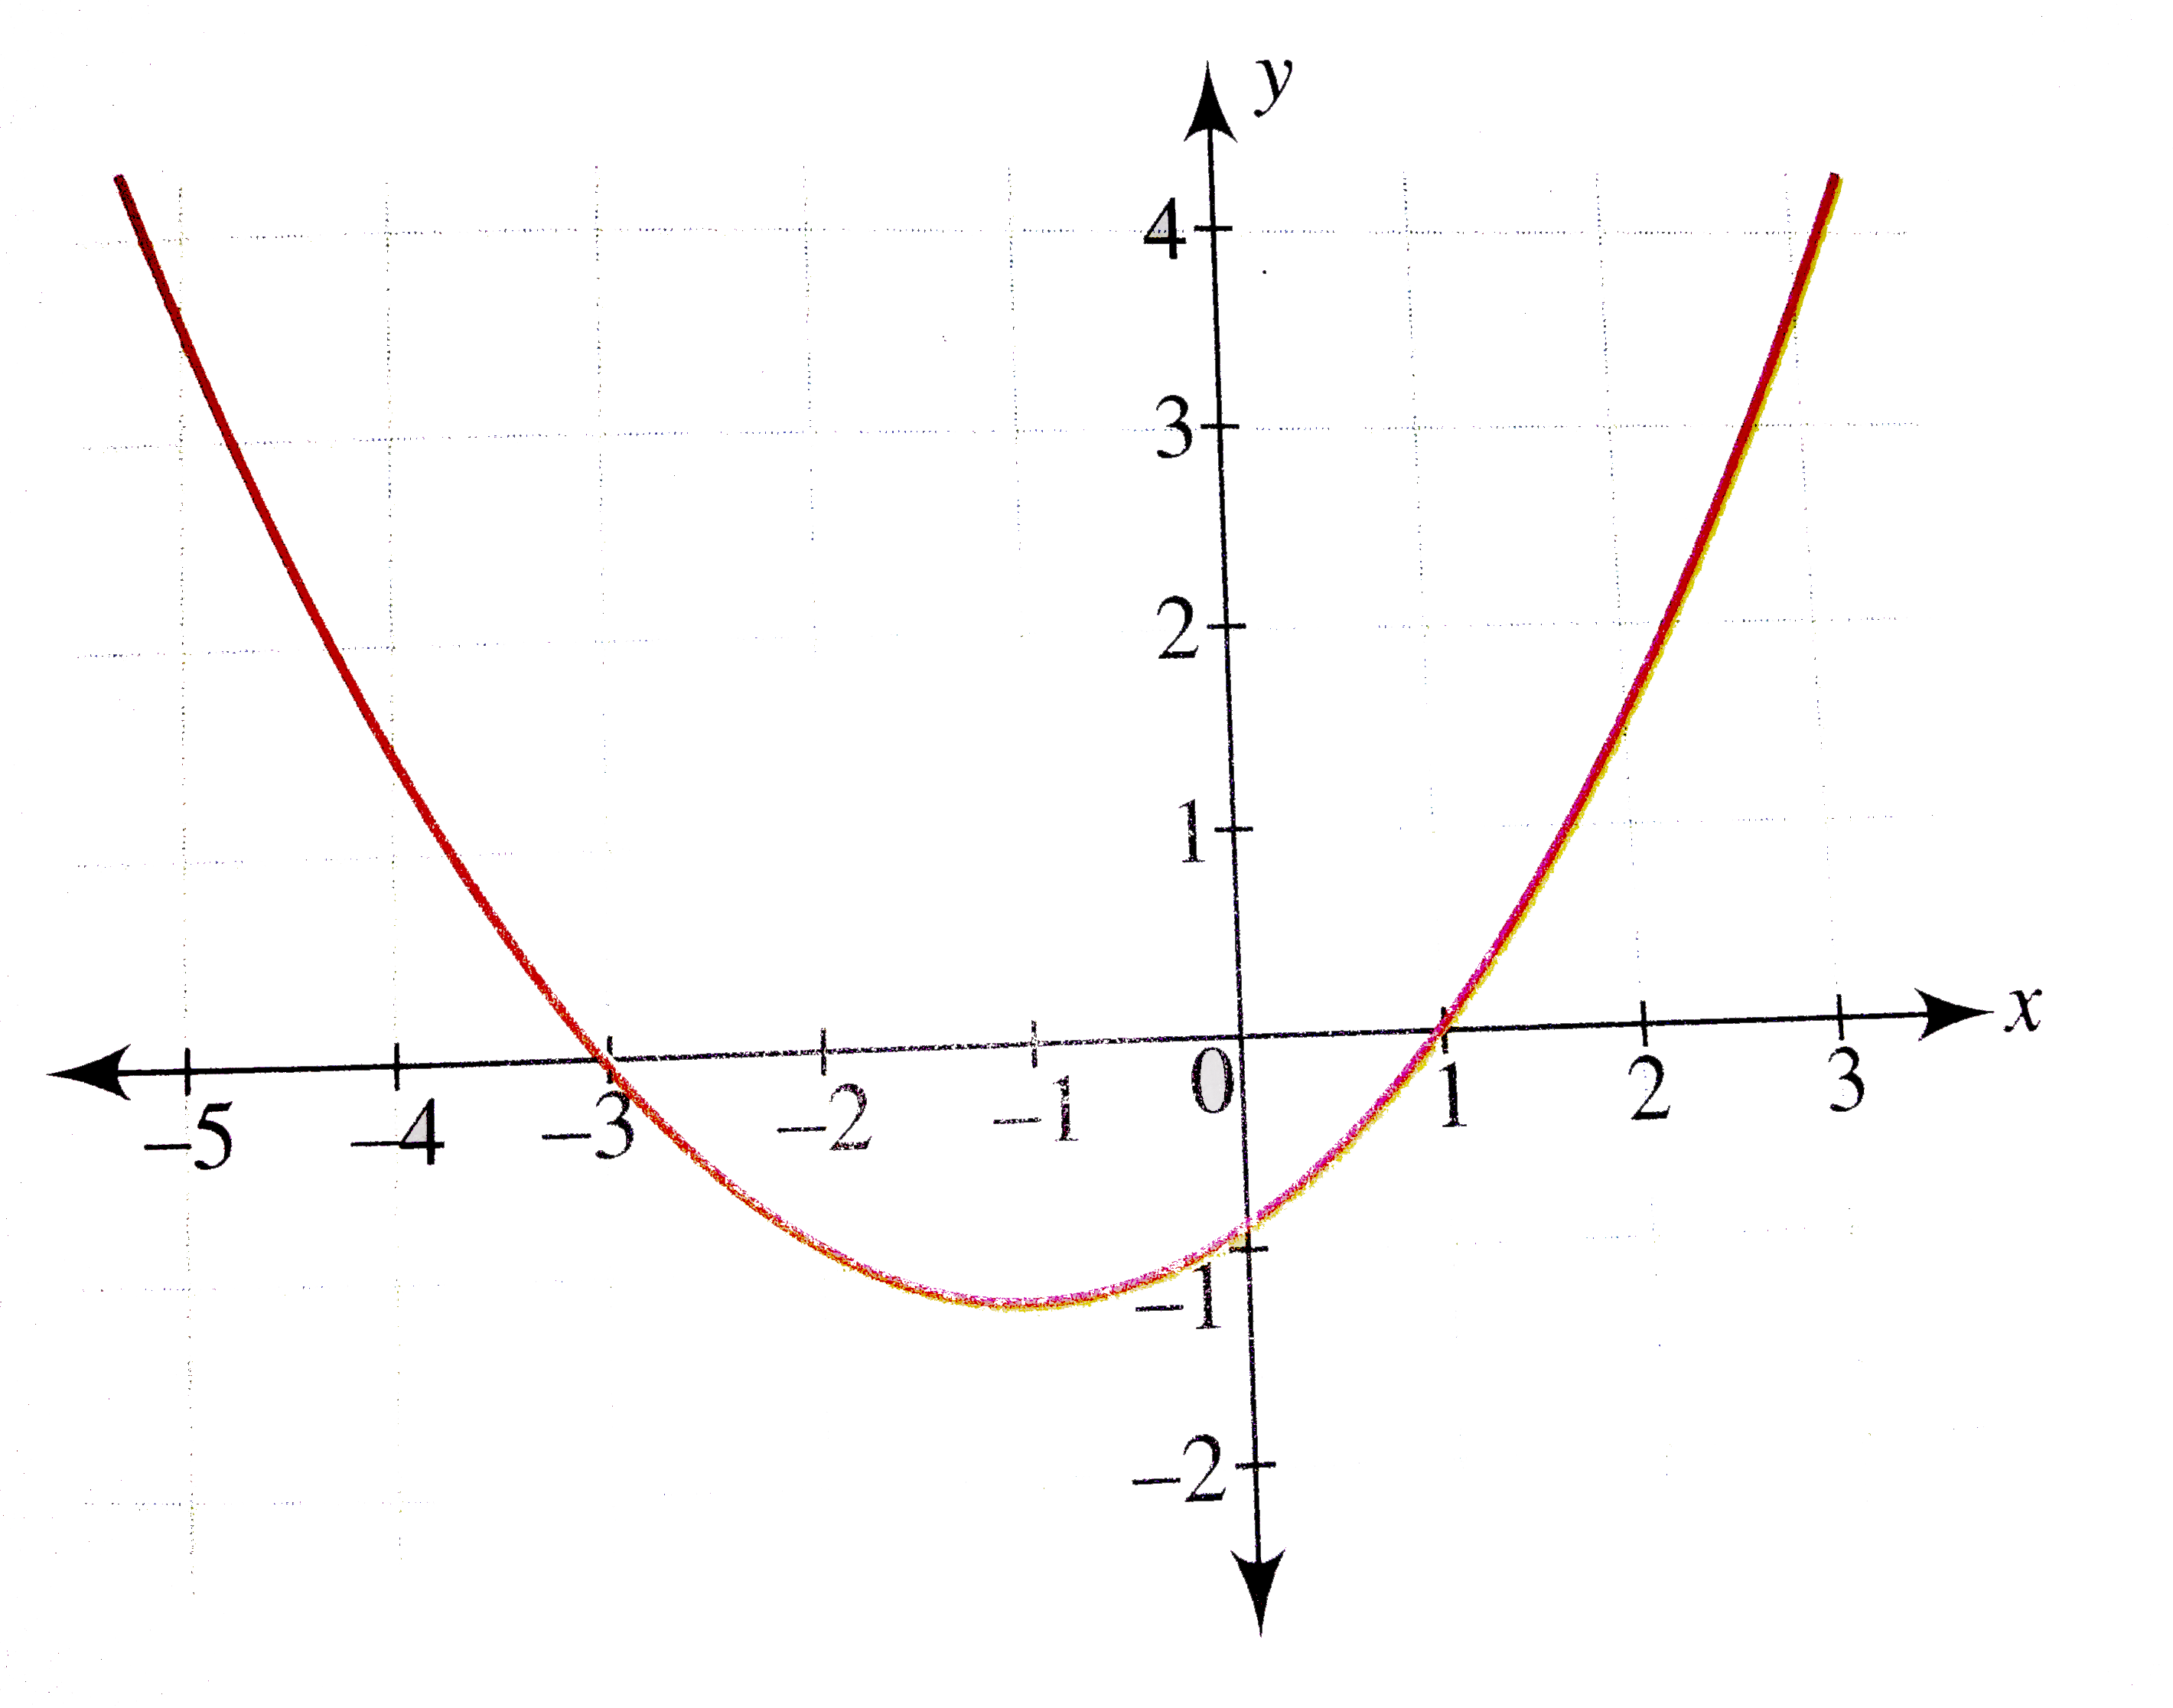
View SolutionGraph of y=f(x) is given as shown in the following figure. Draw the graph of y=sgn(f(x)).
View SolutionFor the following functions write the piecewise definition and draw the graph
(i) f(x)= sgn (logex) (ii) f(x)= sgn (sinx)
View SolutionThe inequation represented by the graph given below is :
View SolutionThe inequation that best describes the graph given below is _________
View SolutionIf y-x=180^(@) then find the values of x and y. ltimg src="https://d10lpgp6xz60nq.cloudfront.net/physics_images/ALN_PHY_R05_E01_034_Q01.png" width="80%"gt
View SolutionThe graph of the function y=f(x) is as shown in the figure.

Then draw the graphs of
(i) |y|=sgn(f(x)) (ii) |y|=|f(x∣)|
(iii) y=xsgn(f(x))
View SolutionGiven the graph of the function y=f(x), draw the graph of y=sgn(x).

View SolutionFor the following functions write the piecewise definition and draw the graph
(i) f(x)= sgn (logex) (ii) f(x)= sgn (sinx)
View SolutionSketch the graph of
(i)f(x)=sgn(x2+1)(ii)f(x)=sgn(logex)(iii)f(x)=sgn(sinx)(iv)f(x)=sgn(cosx)
View Solution

