A pie-diagram representing the following data is_____

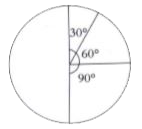
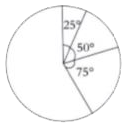
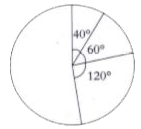
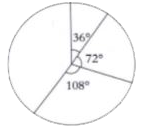
The correct Answer is:D
Step by step video, text & image solution for A pie-diagram representing the following data is_____ <BR> by Maths experts to help you in doubts & scoring excellent marks in Class 8 exams.
Updated on:21/07/2023Topper's Solved these Questions
- STATISTICS Book:PEARSON IIT JEE FOUNDATIONChapter:STATISTICS Exercise:CONCEPT APPLICATION (LEVEL 1)
Explore 31 Videos
- SQUARES AND SQUARE ROOTS AND CUBES AND CUBE ROOTS Book:PEARSON IIT JEE FOUNDATIONChapter:SQUARES AND SQUARE ROOTS AND CUBES AND CUBE ROOTS Exercise:Level 3
Explore 7 Videos
- TIME AND DISTANCE Book:PEARSON IIT JEE FOUNDATIONChapter:TIME AND DISTANCE Exercise:Concept Application (Level 2 )
Explore 3 Videos
Similar Questions
Draw a pie-diagram to represent the following data on the proposed outlay during the fourth five-year plan. Items, Agriculture, Ind. and Minerals, Irrigation & Power, Communication, Miscellaneous Rupees (in crores), 6000, 4000, 2500, 4500, 3000
View SolutionRepresent the following data by histogram:

View Solution
Knowledge Check
Identify the groups of organism marked A and B in the given pie diagram representing the proportionate number of species of major taxa of plants.
 AA - Bryophytes, B - GymnospermsBA - Fungi, B - GymnospermsCA - Fungi, B - AngiospemsDA - Alage, B - Angiosperms
In an Institution there are 800 students. Students use different modes of transport for going to the intitution and return. The given pie diagram represents the requisite data. Study the diagram carefully and answer the questions.
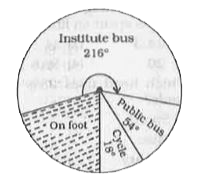
The number of students who travel in public bus isA150B120C130D125In an Institution there are 800 students. Students use different modes of transport for going to the intitution and return. The given pie diagram represents the requisite data. Study the diagram carefully and answer the questions.
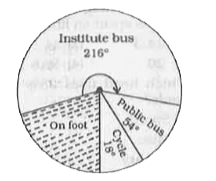
The number of students who go to institute on foot isA160B170C120D106
Draw a histogram to represent the following data.

View SolutionStudy the given diagram and answer the following :
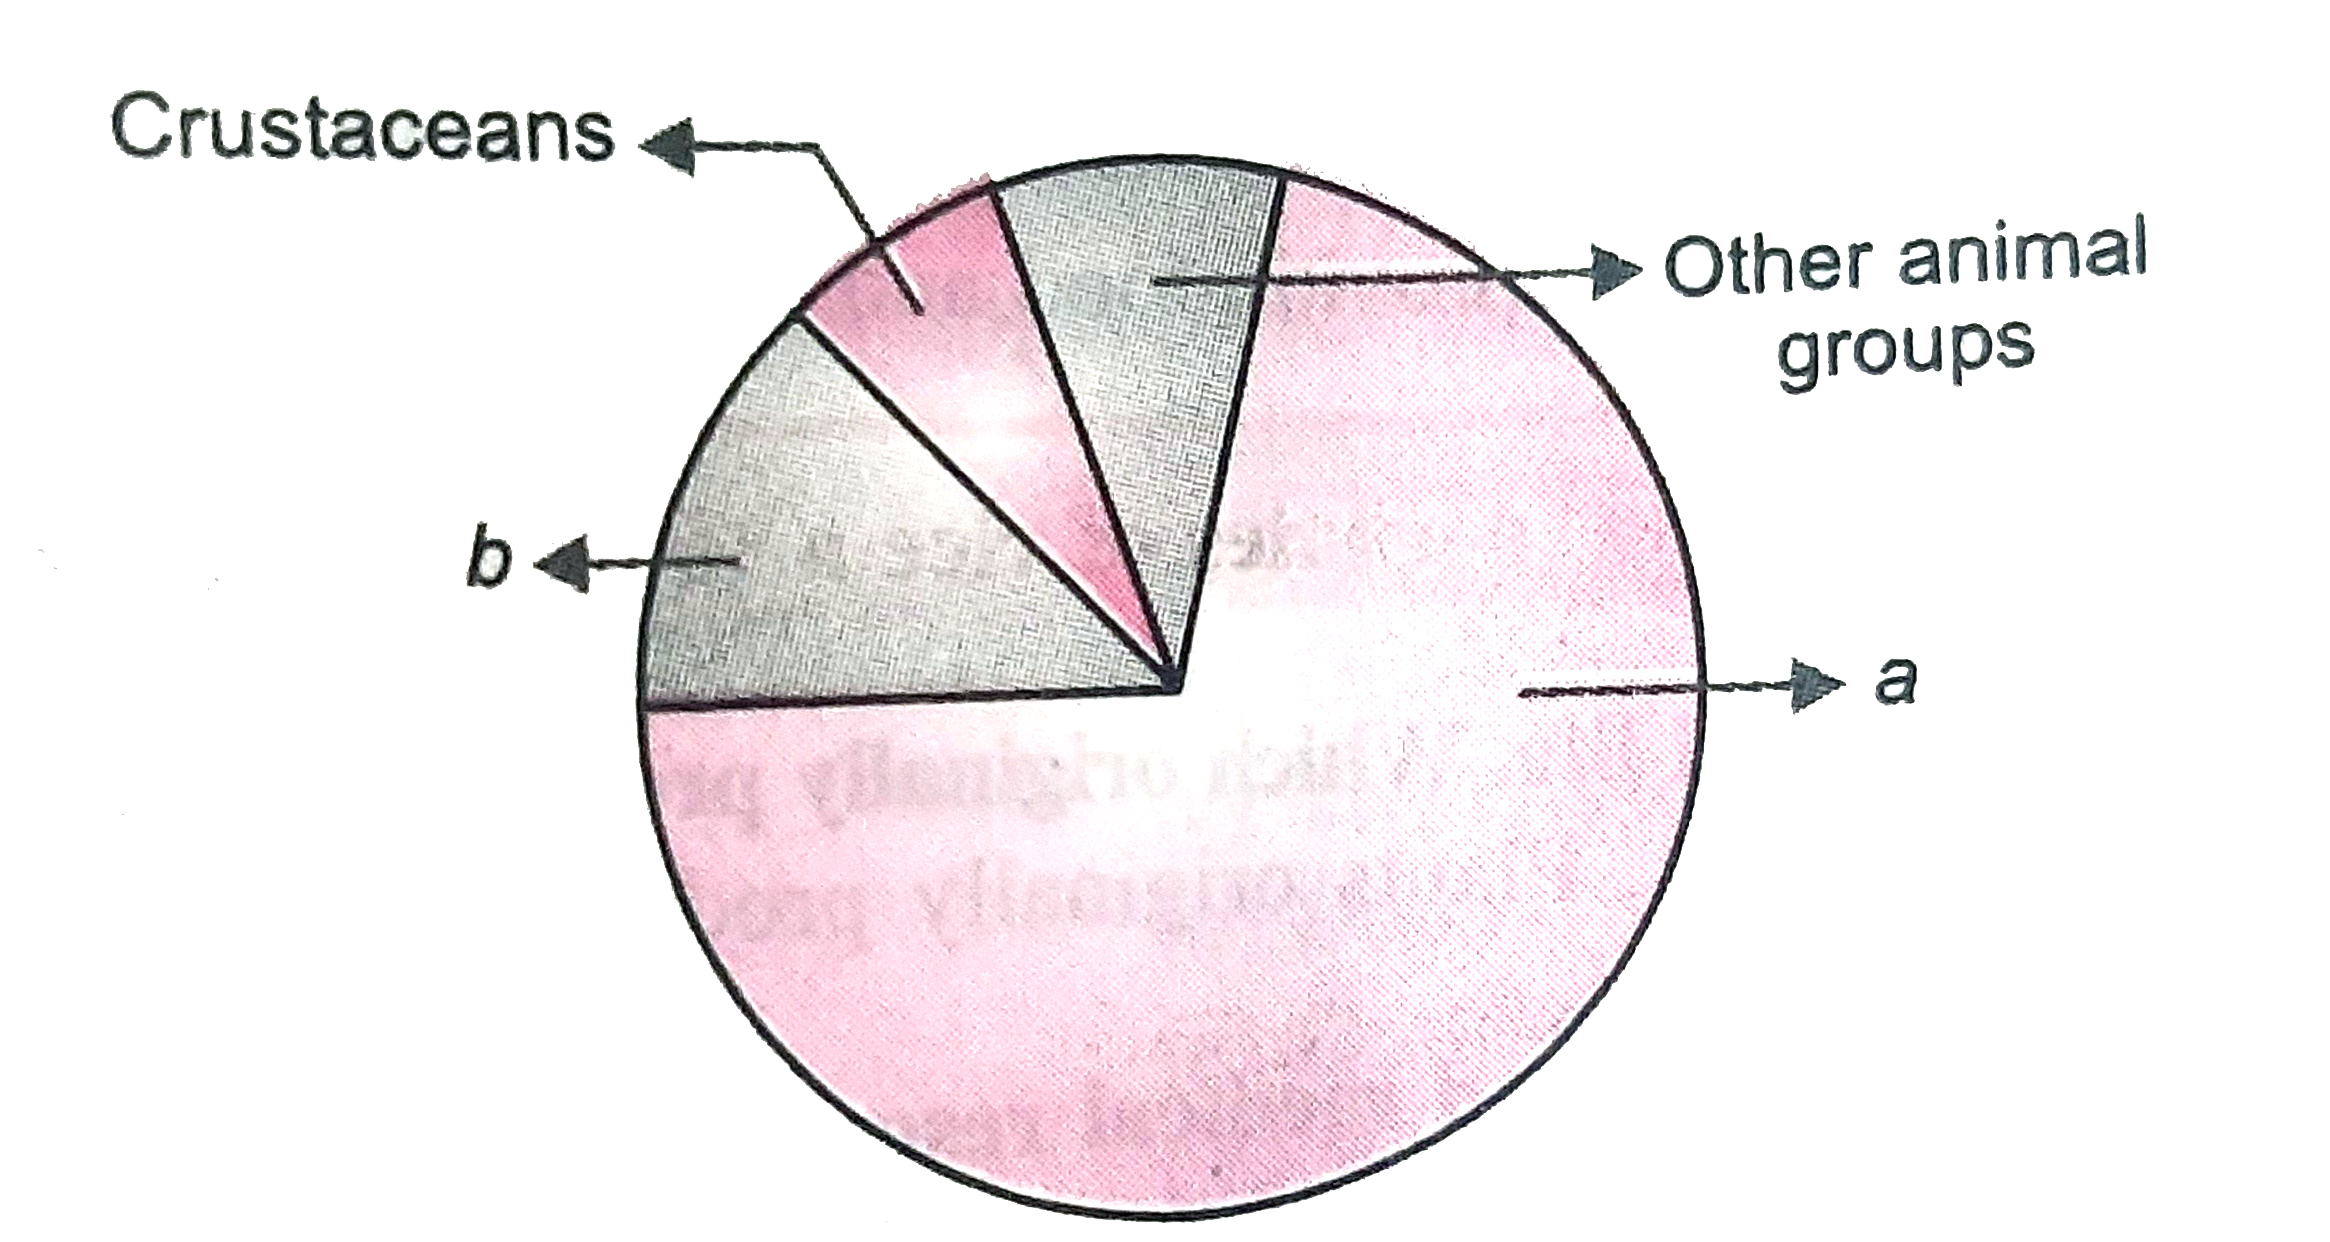
Name the labelled area 'a' and 'b' of the pie diagram representing the global biodiversity of invertebrates showing their proportionate number of species of major taxa.
View SolutionGiven pie diagram represents the proportionate number of species of major groups of invertebrates. Identify the groups A and B.

View SolutionThe given pie diagram represents the proportionate number of species of major taxa of vertebrates. Identify the group A and B.

View SolutionIn an Institution there are 800 students. Students use different modes of transport for going to the intitution and return. The given pie diagram represents the requisite data. Study the diagram carefully and answer the questions.
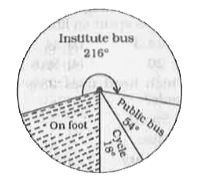
The number of students who do not use institute bus is
View Solution
