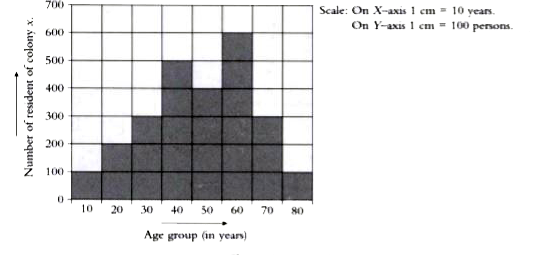
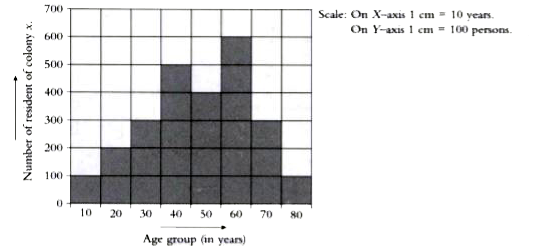
Read the adjacent histogram and answer the following questions.
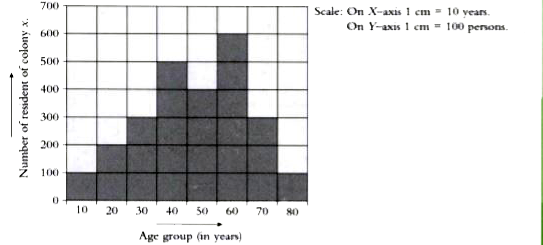
Find the group in which number of persons is more.
The correct Answer is:50−60
Step by step video, text & image solution for Read the adjacent histogram and answer the following questions. Find the group in which number of persons is more. by Maths experts to help you in doubts & scoring excellent marks in Class 8 exams.
Updated on:21/07/2023Topper's Solved these Questions
- STATISTICS BOOK - PEARSON IIT JEE FOUNDATIONCHAPTER - STATISTICS EXERCISE - TEST YOUR CONCEPTS ( ESSAY TYPES QUESTIONS)
5 Videos
- STATISTICS BOOK - PEARSON IIT JEE FOUNDATIONCHAPTER - STATISTICS EXERCISE - CONCEPT APPLICATION (LEVEL 1)
31 Videos
- STATISTICS BOOK - PEARSON IIT JEE FOUNDATIONCHAPTER - STATISTICS EXERCISE - TEST YOUR CONCEPTS (VERY SHORT ANSWER TYPES QUESTIONS)
30 Videos
- SQUARES AND SQUARE ROOTS AND CUBES AND CUBE ROOTS BOOK - PEARSON IIT JEE FOUNDATIONCHAPTER - SQUARES AND SQUARE ROOTS AND CUBES AND CUBE ROOTS EXERCISE - Level 3
7 Videos
- TIME AND DISTANCE BOOK - PEARSON IIT JEE FOUNDATIONCHAPTER - TIME AND DISTANCE EXERCISE - Concept Application (Level 2 )
3 Videos
Similar Questions
Knowledge Check
The given histogram shows the frequency distribution of the speed of cars passing through a particular spot on a highway. Read the graph and answer the following question.
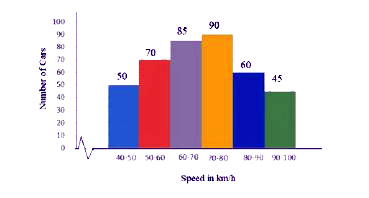
What is the ratio of the number of cars with speed less than 60 km h to the number of cars with speed more than 70 km/h?A13:8B8:5C8:13D5:8
Read the passage and answer the following questions.

Identify the animal.
View SolutionDirection :- Study the histogram and answer the following questions
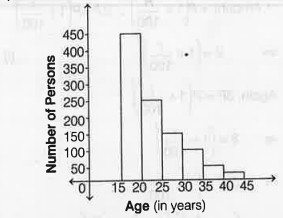 .
.
The ratio of the number of persons between the age group of 20-25 and 30-35 is
(A) 1:3
(B) 2:1
(C ) 10:3
(D) 6:1
View SolutionRead the graph and answer the following questions
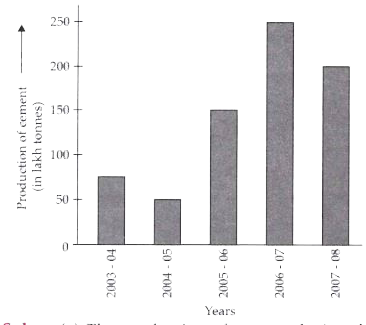
During which period, the production was minimum ?
View SolutionRead the passage and answer the following questions.

Which Phylum does it belong?
View SolutionDraw a histogram for the frequency table made for the data in Question 3, and answer the following questions.(i) Which group has the maximum number of workers?(ii) How many workers earn Rs 850 and more?(iii) How many workers earn less than Rs 850?
View SolutionRead the bar graph given below and answer the following questions:

In which year is the number of students maximum?
View SolutionRead the bar graph given below and answer the following questions:

In which year is the number of students twice as that of 2001-02?
View Solution

