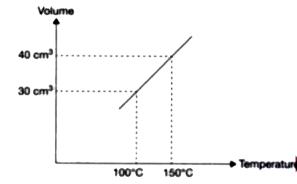
The change in volume of a given mass of gas with the temperature is graphically represented as shown in the figure shown below. Determine the ratio of densities of the gas at 100∘Cand150∘C.
43
34
35
13
The correct Answer is:A
Density =massvolume
=d1d2=v1m2v2=v2v1=4030=43
Hence the correct option is (b).
Topper's Solved these Questions
Similar Questions
The change in volume of a gas with change in temperature is plotted on a graph, as shown in he figure. Calculate the ratio of density at 50∘Cand100∘C
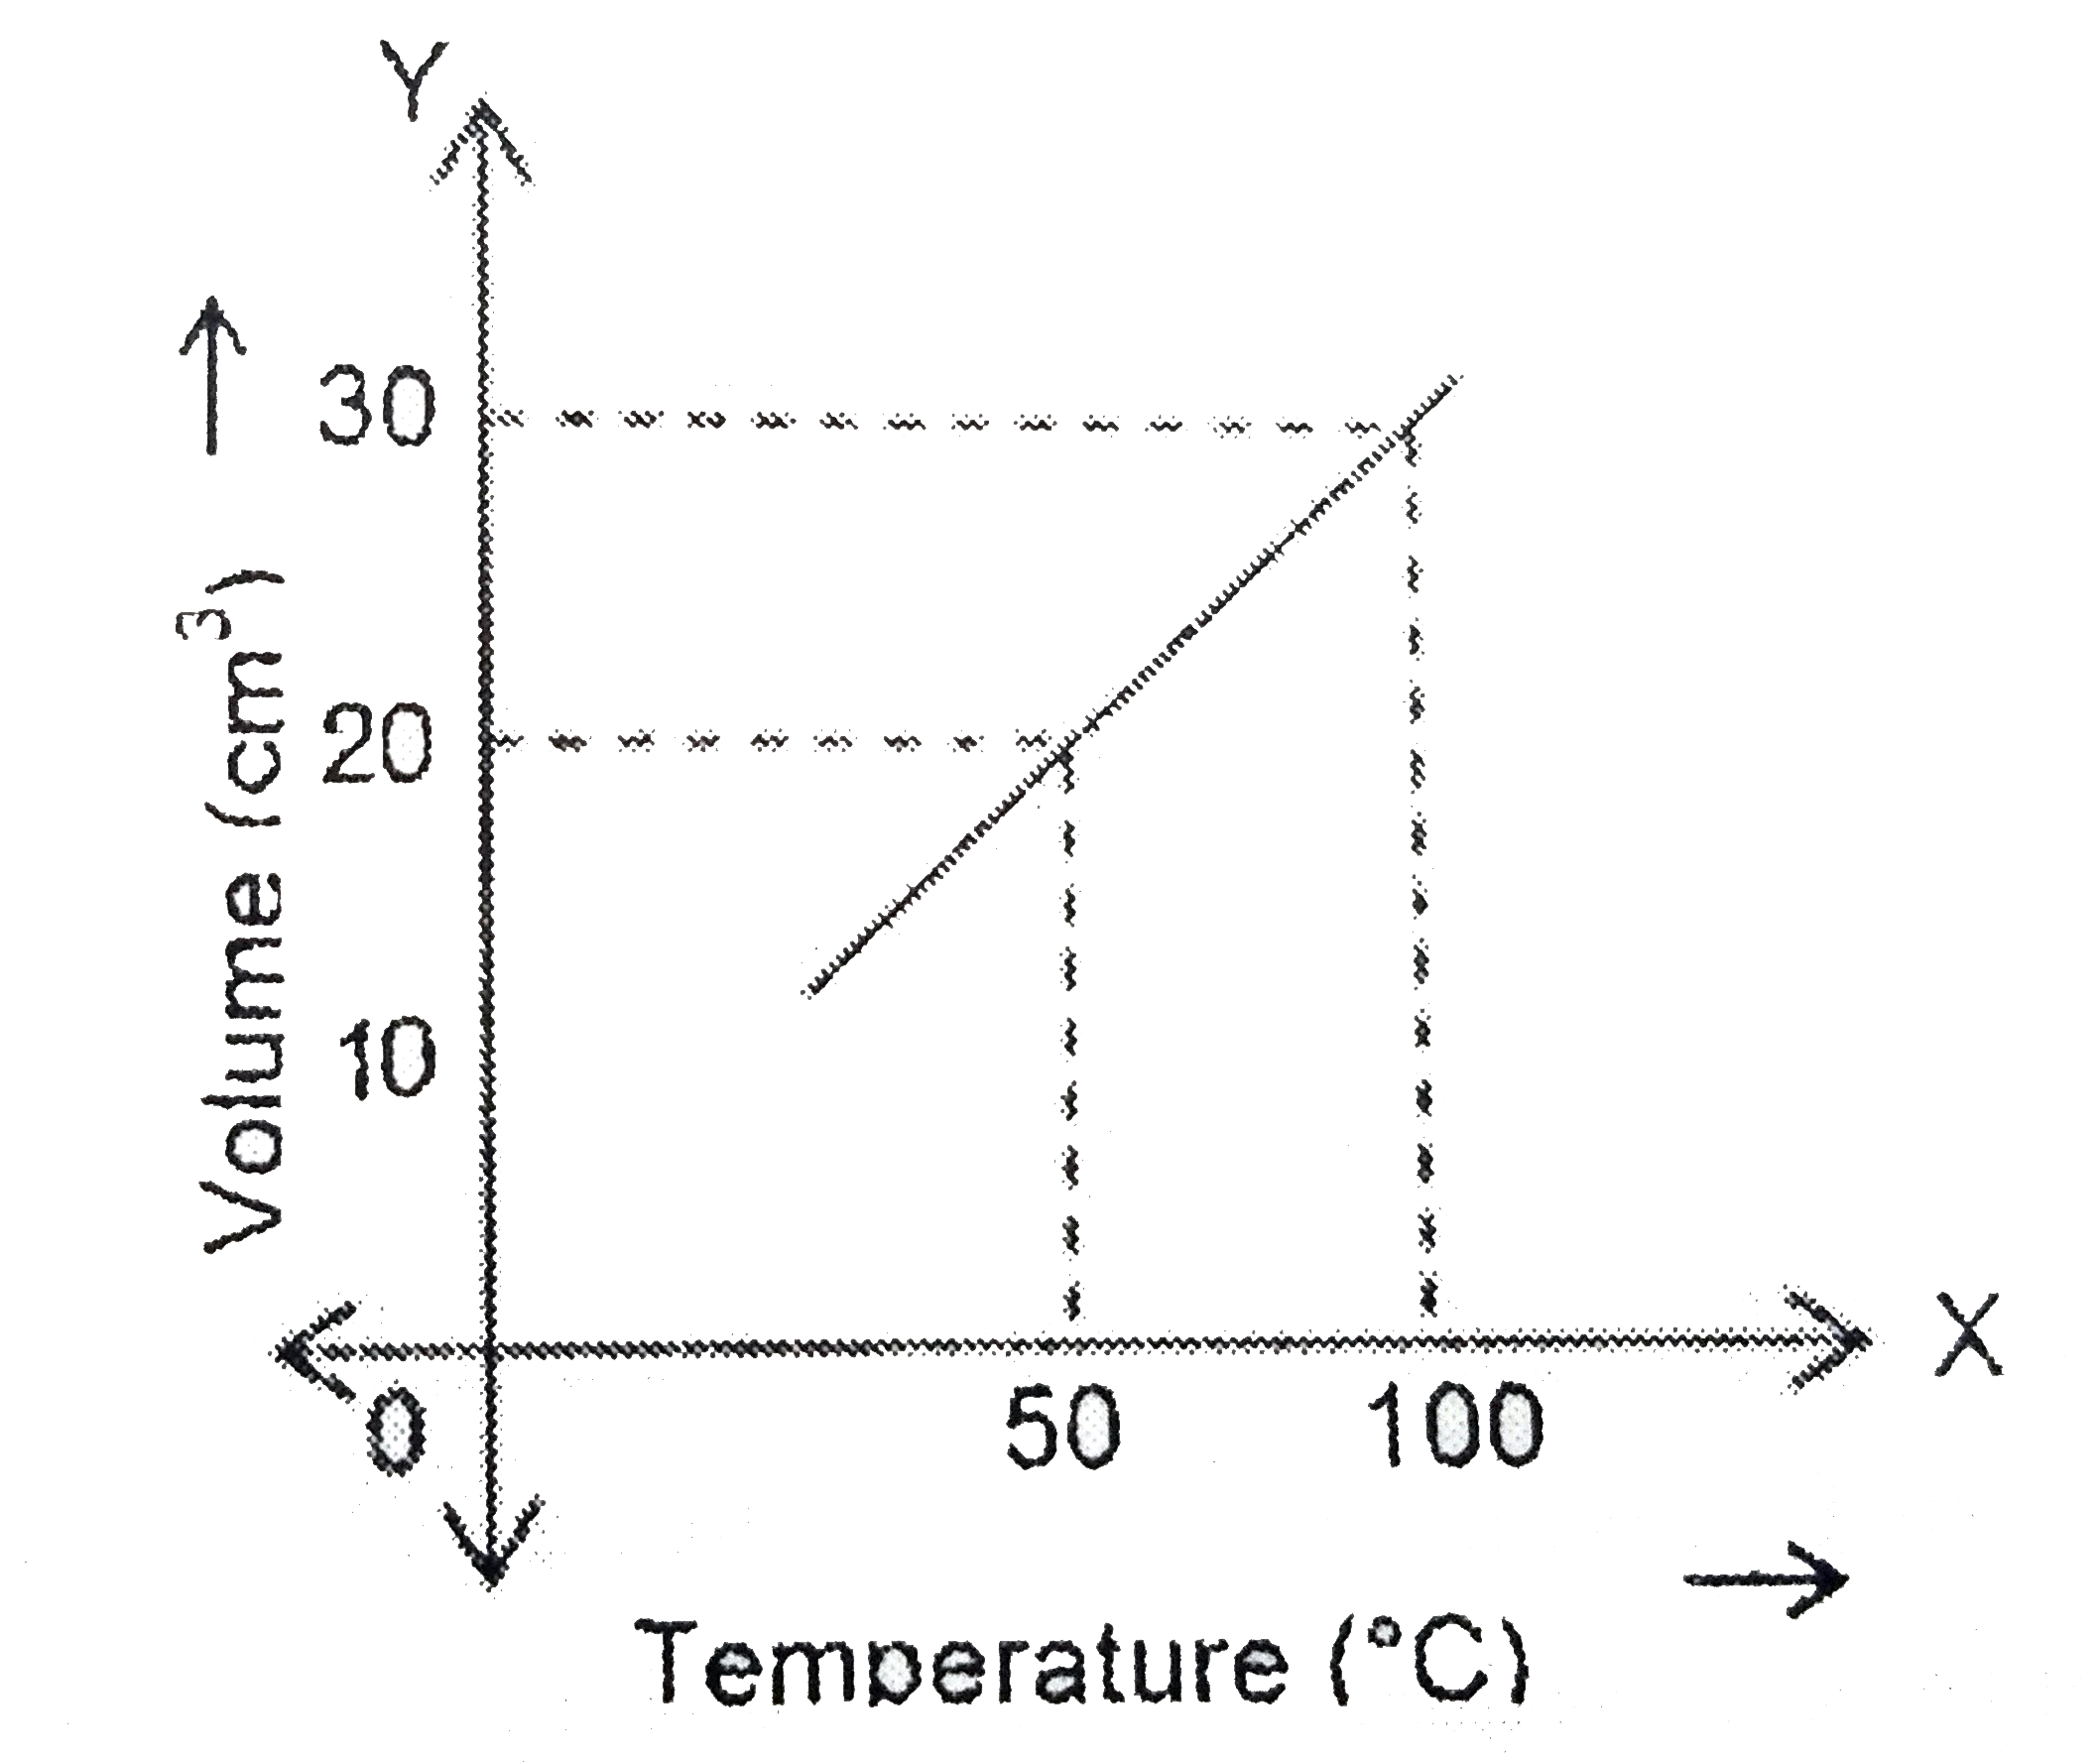
View SolutionThe change in volume of a gas with change in temperature is plotted on a graph, as shown in he figure. Calculate the ratio of density at 50∘Cand100∘C

View Solution
Knowledge Check
Pressure versus density graph of an ideal gas is shown in figure
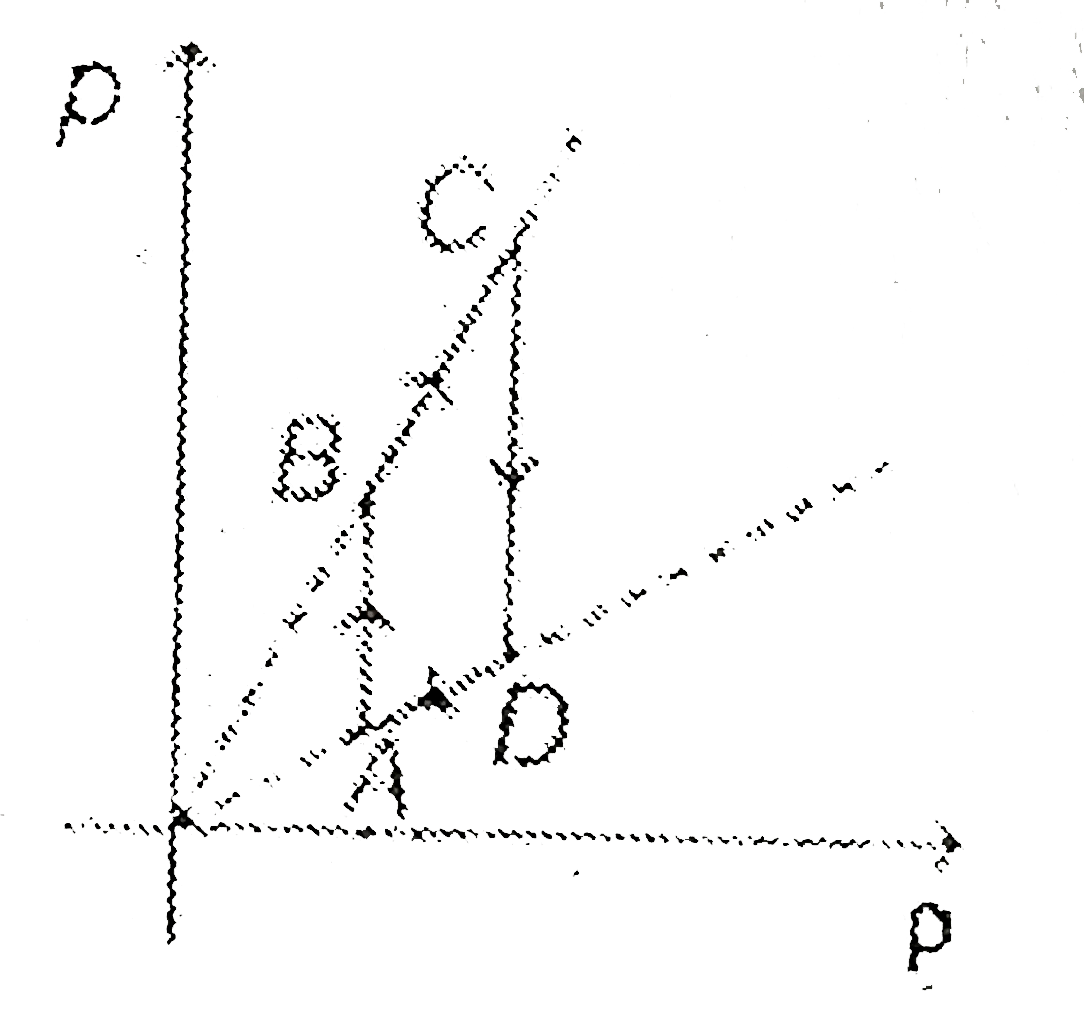 Aduring the process AB work done by the gas is positiveBduring the process AB work done by the gas is negativeCduring the process BC internal energy of the gas is increasingDNone of the above
The volume-temperature graphs of a given mass of an ideal gas at constant pressure are shown below. What is the correct order of pressure ?
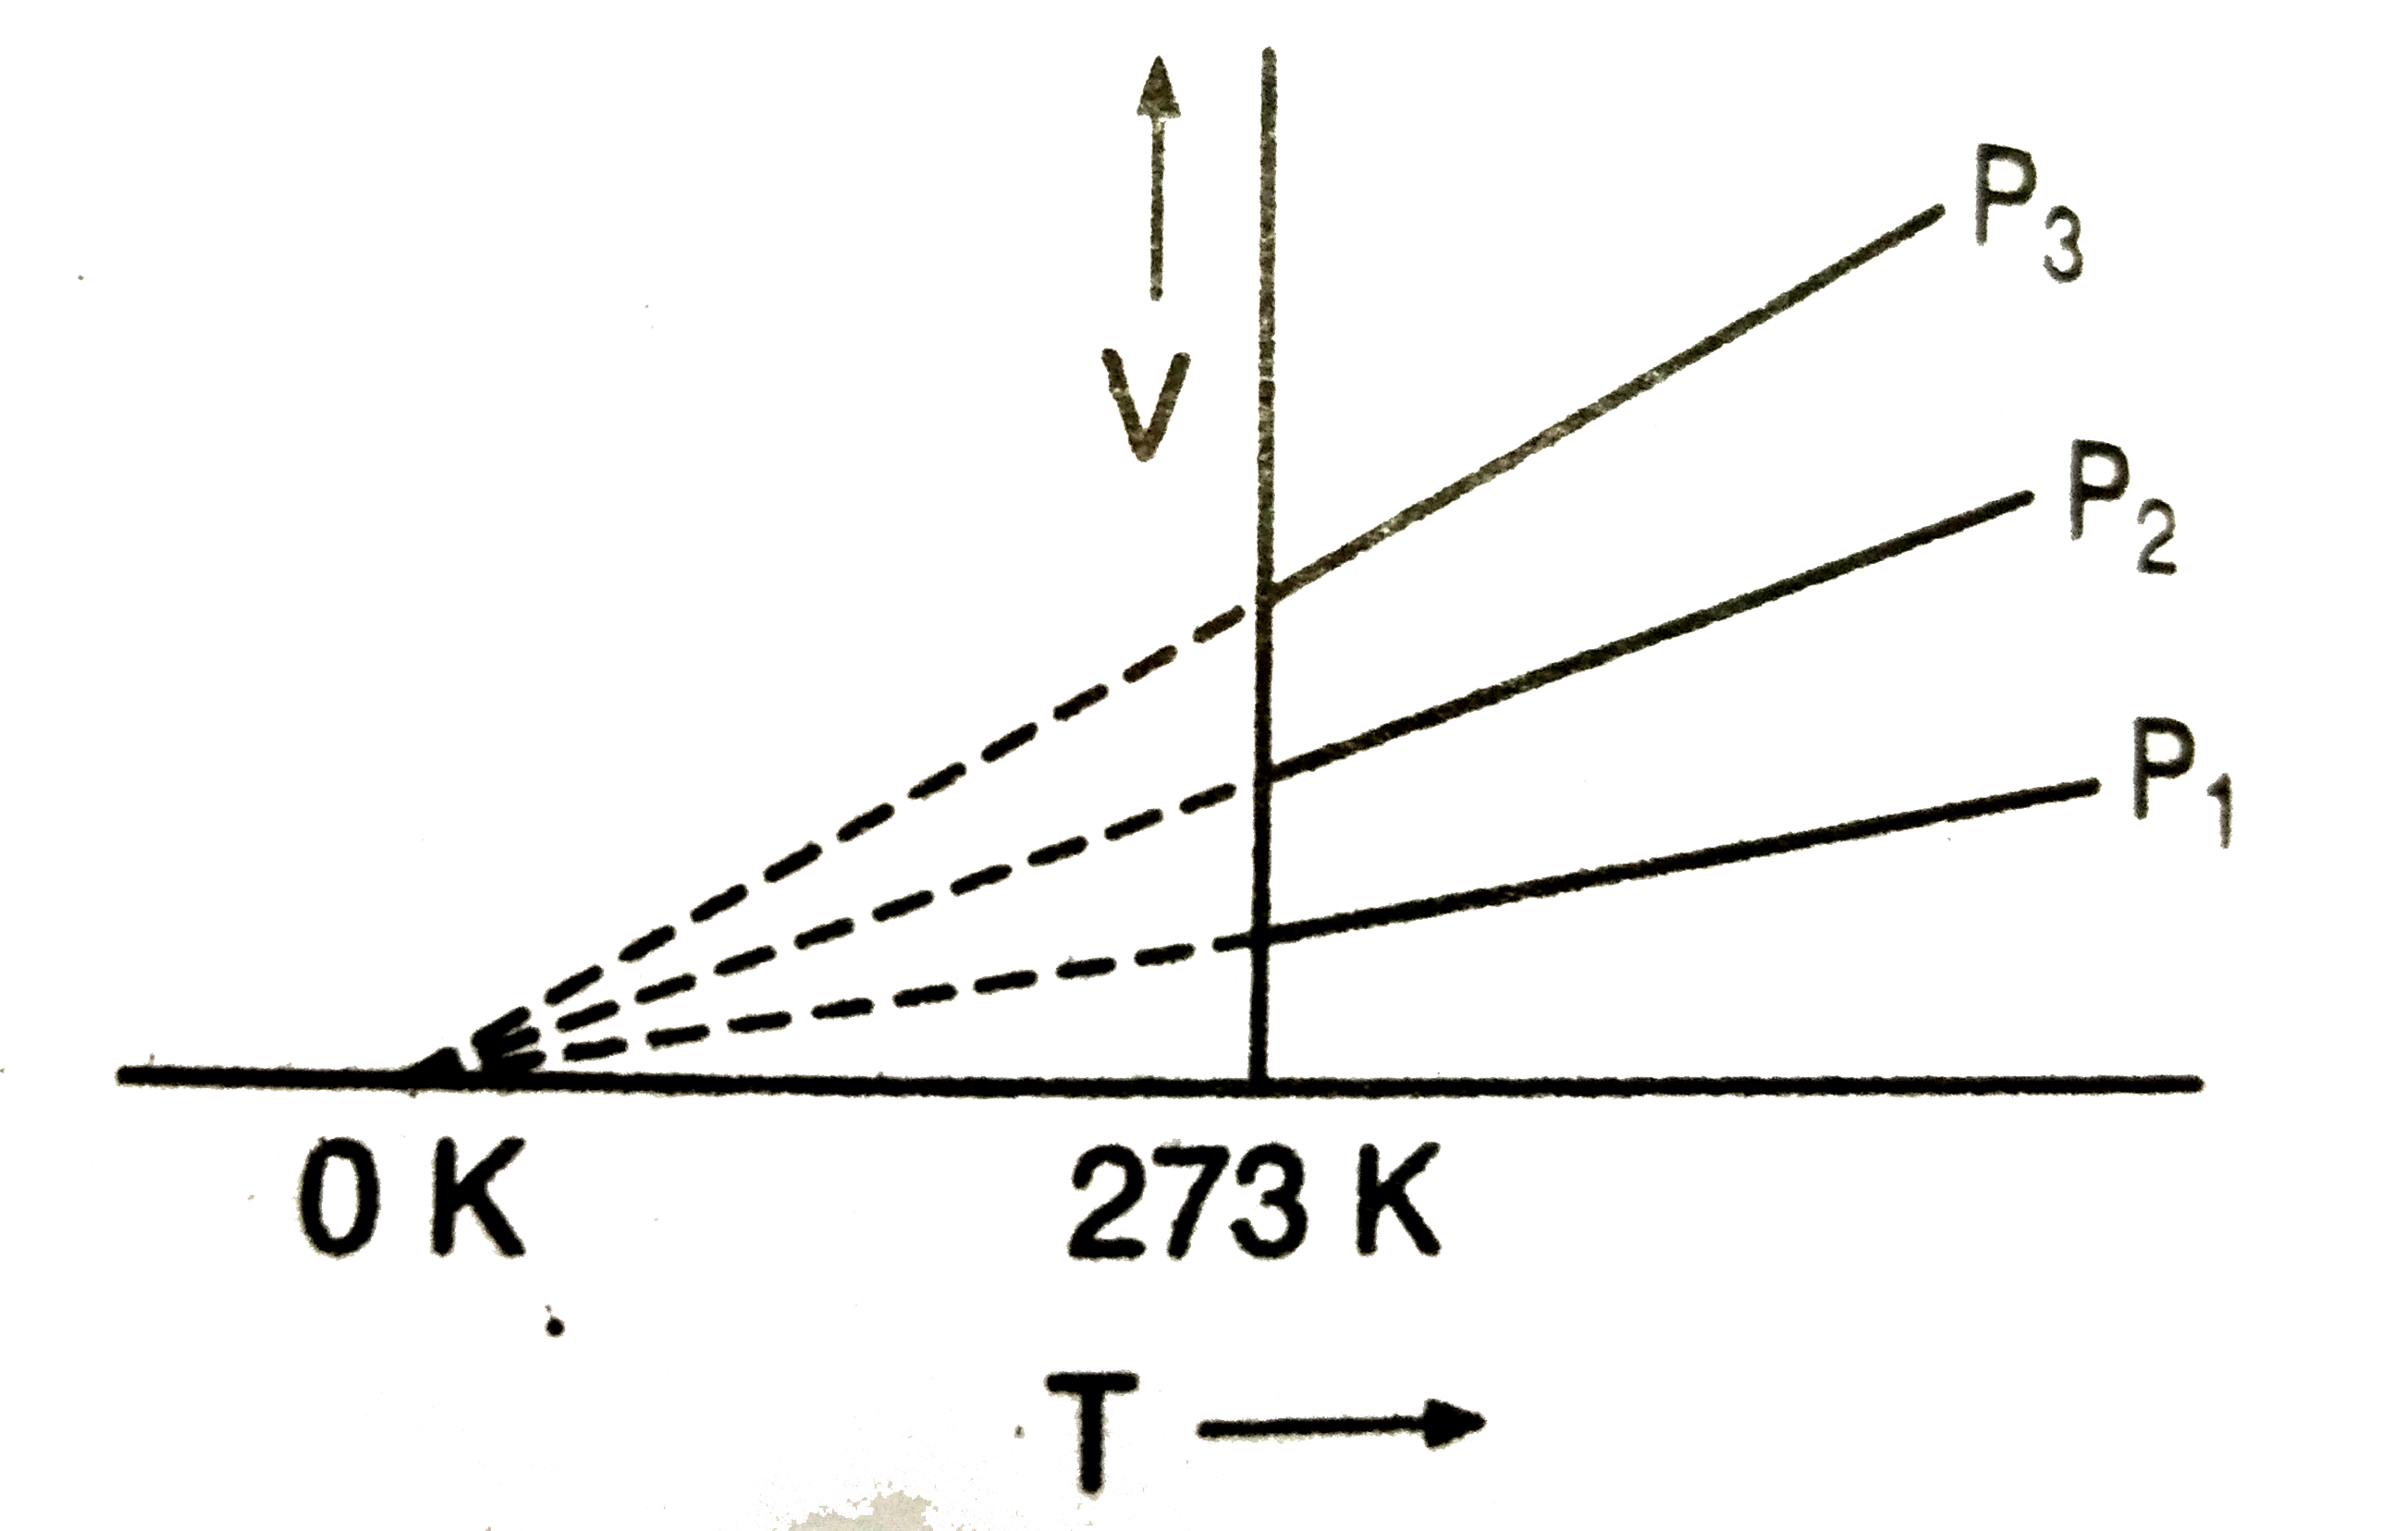 AP1>P3>P2BP1>P2>P3CP2>P3>P1DP2>P1>P3
The volume-temperature graphs of a given mass of an ideal gas at constant pressures are shown below. What is the correct order of pressures ?
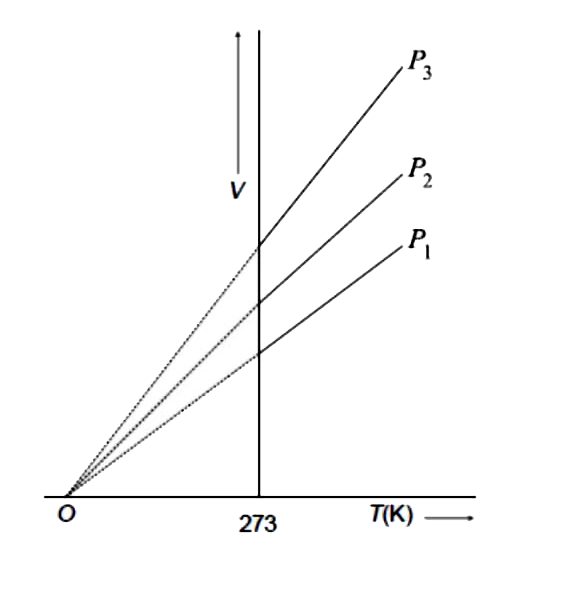 Ap1>p3>p2Bp1>p2>p3Cp2>p3>p1Dp2>p1>p3
For a given mass of gas the variation of pressure versus temperature is shown in the figure. What is the ratio of volume of the gas at points A and B.
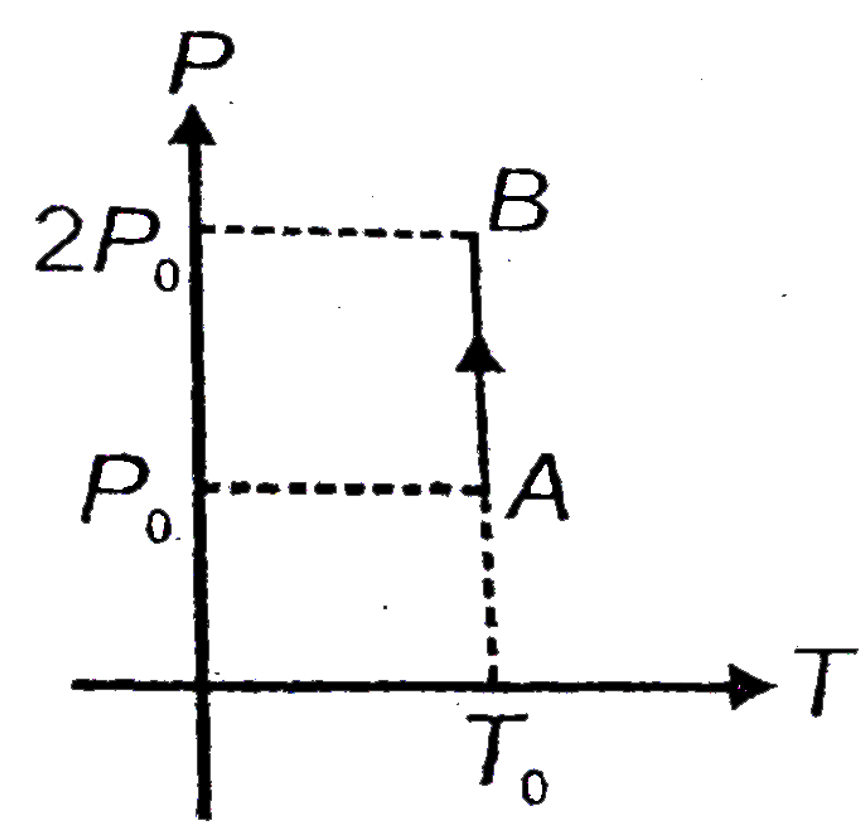 .
.
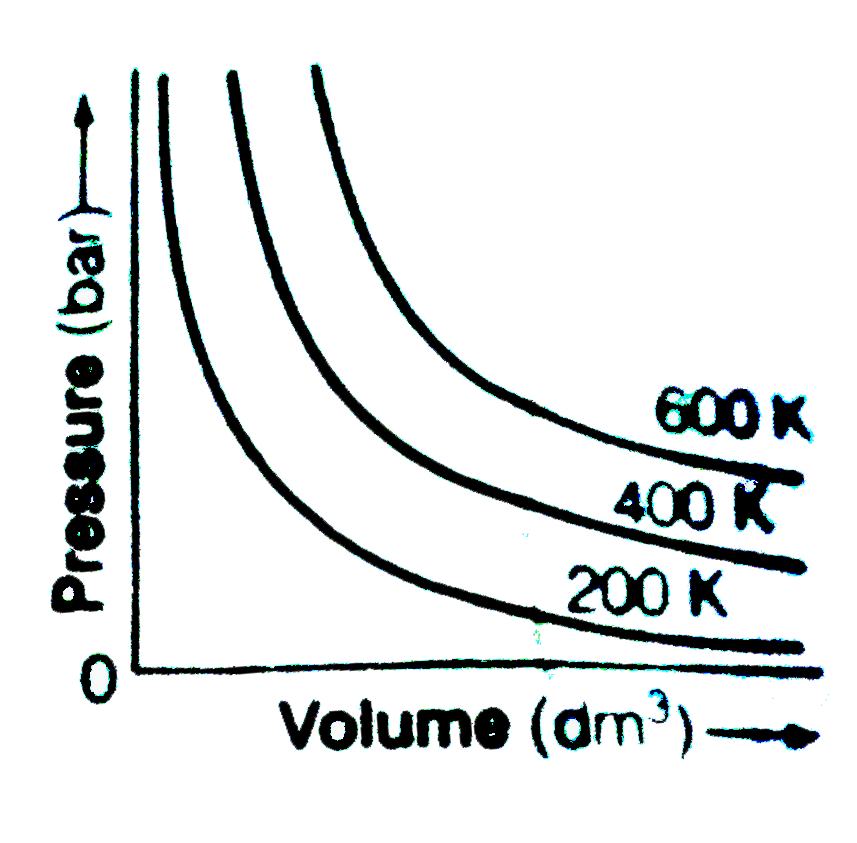
View SolutionThe variation of pressure with volume of the gas at different temperatures can be graphically represented as shown in figure. On the basis of this graph answer the following question.
(i) How will the volume of a gas change if its pressure is increased at constant temperature ?
(ii) At a constant pressure, how will the volume of a gas change if the temperature is increased from 200 K to 400 K ?
View SolutionThe percentage change in the volume of the given mass of a gas at constant temperature is 50% (increases). Calculate the percentage change in the presure of the gas.
View SolutionThe variation of pressure with volume of the gas at different temperatures can be graphically represented as shown in figure. On the basis of this graph answer the following questions.
How will the volume of a gas change if its pressure is increased at constant temperature?
View SolutionThe variation of pressure with volume of the gas at different temperatures can be graphically represented as shown in figure. On the basis of this graph answer the following questions.
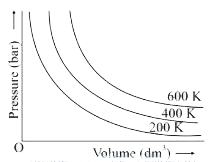
At a constant pressure, how will the volume of a gas change if the temperature is increased from 200 K to 400 K?
View Solution