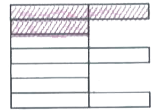
निम्नलिखित आकृतियों के छायांकित भाग को भिन्न दशमलव एवं प्रतिशत में बदलिए।

The correct Answer is:0.3
Step by step video, text & image solution for निम्नलिखित आकृतियों के छायांकित भाग को भिन्न दशमलव एवं प्रतिशत में बदलिए। by Maths experts to help you in doubts & scoring excellent marks in Class 7 exams.
Topper's Solved these Questions
- BOOK - NAVBODHCHAPTER - प्रतिशतता EXERCISE - प्रश्नावली 16.1 (रिक्त स्थानों की पूर्ति कीजिये -)5videos
प्रतिशतता
- BOOK - NAVBODHCHAPTER - प्रतिशतता EXERCISE - प्रश्नावली 16.227videos
प्रतिशतता
- BOOK - NAVBODHCHAPTER - परिमेय संख्याओं का दशमलव विरूपण एवं संक्रियाएँ EXERCISE - प्रश्नवाली 11.321videos
परिमेय संख्याओं का दशमलव विरूपण एवं संक्रियाएँ
- BOOK - NAVBODHCHAPTER - बीजीय व्यंजकों पर संक्रियाएँEXERCISE - प्रश्नावली 9.211videos
बीजीय व्यंजकों पर संक्रियाएँ
Similar Questions
0.25 का भिन्न रूप ……… एवं प्रतिशत रूप है।
03:47View Solutionरिक्त स्थानों की पूर्ति कीजिये -
( क्रय मूल्य, विक्रय मूल्य, लाभ/हानि रु में , लाभ/हानि % में )
( 250 रु ,300 रु , ..........,.........)01:37View Solutionयोग कीजिए-
1.0087,0.32106:07View Solutionरिक्त स्थानों की पूर्ति कीजिए
(2x+3y)×2z=2x×2z+3y........=4xz+6yz02:11View SolutionIdentify the cell organelle 'A' :-
ltimg src="https://d10lpgp6xz60nq.cloudfront.net/physics_images/ALN_BIO_C10_E08_018_Q01.png" width="80%"gt01:31View SolutionHow many lines of symmetry does the above figure have ?
02:45View SolutionWhich of the following are correct chain isomers of butane ? (i)
02:17View SolutionDetermine the point of symmetry of a regular hexagon.
05:41View SolutionDtermine the images of the following figure about the given line :
02:21View SolutionMatch the following Column A to Column B
 02:03View Solution
Match the following Column A to Column B
 02:10View Solution
Match the following Column A to Column B
 02:17View Solution
Find the area of the figure given below.
 02:10View Solution
The area of the shaded part in the figure given below is ______.
 04:23View Solution
The inequation represented by the graph given below is :
01:42View SolutionThe inequation that best describes the graph given below is _________
03:12View Solution

