In the given figure bar diagram, the wheat production of a farm from year 2009 to 2014 is shown. Sum of production during odd years is how many times that of the even years.
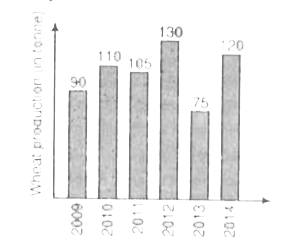
23
0.75
1.33
none of the above
The correct Answer is:B
Step by step video, text & image solution for In the given figure bar diagram, the wheat production of a farm from year 2009 to 2014 is shown. Sum of production during odd years is how many times that of the even years. by Maths experts to help you in doubts & scoring excellent marks in Class 14 exams.
Updated on:21/07/2023Similar Questions
Knowledge Check
In the given bar graph, the wheat production of a farm (in tonne) from year 2009-2014 is shown. Sum of production during 'odd' years is how many times that of the 'even' years ?
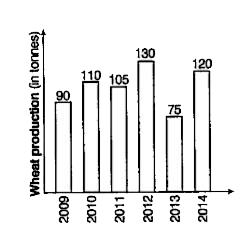 A23B0.75C1.33DNone of these
The bar graph given below shows the production (in000 tonnes) of rice of a country for the year 2007 to 2011 .
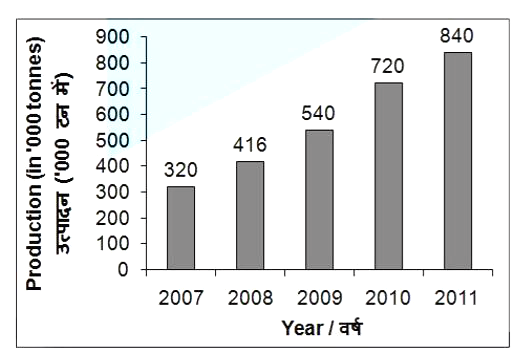
The production of rice in year 2010 is how much percent more that the production of rice in the year 2009 ?A21.5B37.5C42.5D33.33The bar chart given below shows the annual production (in 1000 tonnes) of coffee of a country for years 2009 to 2013.
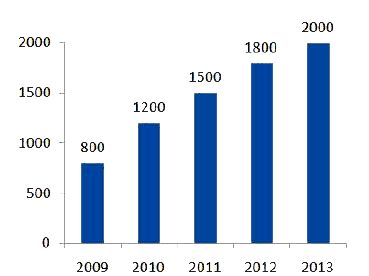
The production for the year 2011 is what percent of the production for the year 2009?A157.5%B175.25%C187.5%D205.25%
The bar graph given below shows the wheat production (in tonnes) of a large farm during the year 2011-2018. In how many years was wheat production higher than the average production of the period?
नीचे दिए गए दंड आरेख में वर्ष 2011-2018 के दौरान किसी बड़े फार्म के गेहूं उत्पादन (टन में) को दर्शाया गया है | अवधि के औसत उत्पादन की तुलना में दिए गए कितने वर्षो में गेहूं उत्पादन अधिक था ?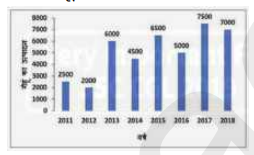
View SolutionThe bar diagram below shows the production of potatoes (in quintals) from the year 2000 to 2006. Study the diagram and answer the questions
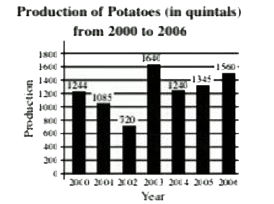
Considering the average production during this period, the number of years in which the production is above average is
View SolutionThe bar diagram below shows the production of potatoes (in quintals) form the year 2001 to 2006. Study the diagram and answer the following questions.
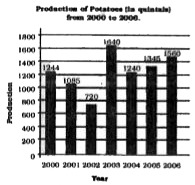
Considering the average production during this period, the number of years in which the production is above average is :
View SolutionThe line chart given below shows the revenue of a company (in lac rupees) from year 2009 to 2016
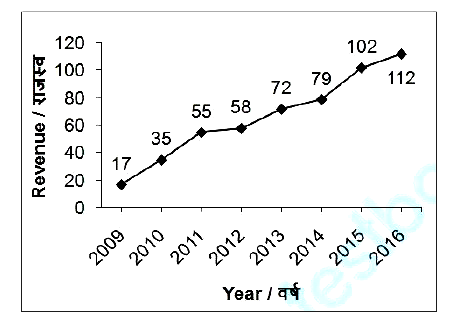
In how many years from 2010 to 2016 the increase in the revenue is more than 20% of the previous year value?
View SolutionThe line chart given below shows the revenue of a company (in lac rupees) from year 2009 to 2016.
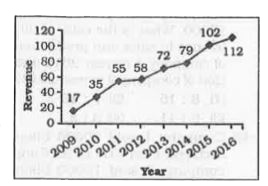
In how many years from 2010 to 2016 the increase in the revenue is more than 20% of the previous year value?
View Solution

