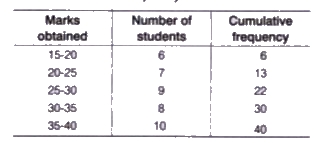
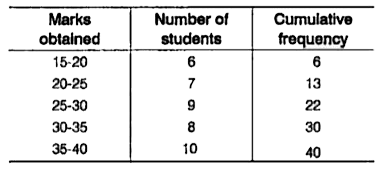
......... is one of the methods of the graphic presentation of the frequency distribution.
A
Diagram
B
Histogram
C
Monogram
D
Holographic design
Video Solution
Text Solution
The correct Answer is:B
A histogram is a graphical representation of the distribution of numerical data and frequency distribution.
|
Similar Questions
Knowledge Check
The median of the frequency distribution is
 A28.88B30.88C35.88DNone of these
The median of the frequency distribution is
 A28.88B30.88C35.88DNone of these
When the frequency distribution is normal
Amedian ,mode and onean are all different from one antherBmean ,mode and median are identicalCmean is greater than modeDmean is greater than median


