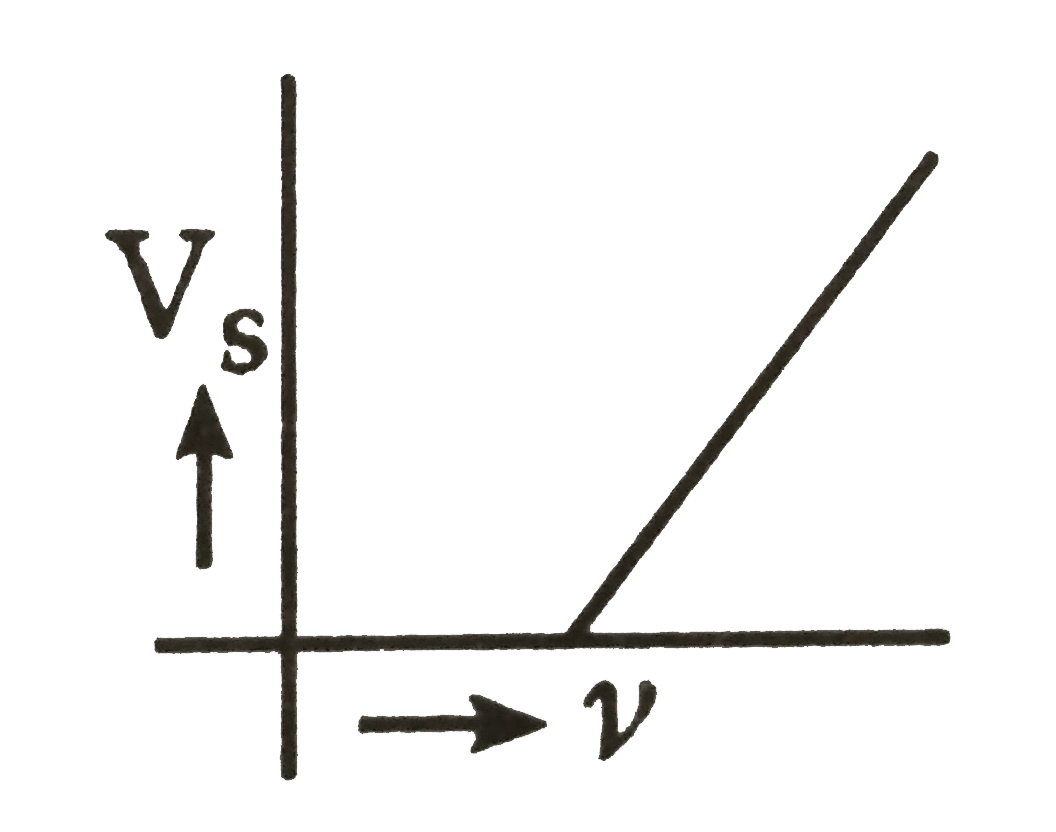
Draw a graph showing the variation of stopping potential with frequency of incident raditions in relation to photoelectric effect. Deduce an expression for the slope of this graph using Einstein's photoelectric equation.Solution in Punjabi
Step by step video solution for Draw a graph showing the variation of stopping potential with frequency of incident raditions in relation to photoelectric effect. Deduce an expression for the slope of this graph using Einstein's photoelectric equation. by Physics experts to help you in doubts & scoring excellent marks in Class 12 exams.
Updated on:21/07/2023Similar Questions
Draw and explain the graph showing the variation of stopping potential with frequency of incident radiation in relation to photoelectric effect.
View SolutionDefine photoelectric effect. Draw a graph to show the variation of stopping potential with frequency of incident radiation on a metal plate.
View SolutionDraw a graph showing the variation of stopping potential with frequency of incident raditions in relation to photoelectric effect. Deduce an expression for the slope of this graph using Einstein's photoelectric equation.
View SolutionEinstein got Nobel prize in physics in 1921 for his explanation of photoelectric effect. Draw a graph to show the variation of stopping potential with frequency of incident radiation. How the value of Plank.s constant can be deter mined from the graph?
View SolutionPhotoelectric Effect||Photoelectric Equation||Stopping Potential||Variation OF Potential with Frequency and Intensity
View SolutionGive the definition of photoelectric threshold frequency and stopping, potential. Draw the variation of stopping potential vs. incident frequency
View SolutionGraph of incident freuency with stopping potential in photoelectric effect is
View SolutionIn photoelectric effect the slope of straight line graph between stopping potential (Vs) and frequency of incident light (v) gives

View Solution
