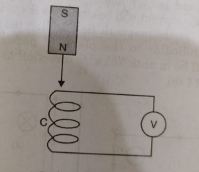
The figures SAQ 13(a) shows a bar magnet M falling under gravity through an air cored coil. Plot a graph showing variation of induced e.m.f. with time(t). What does the area encloed by E-t curve depict?
 Solution in Punjabi
Step by step video solution for The figures SAQ 13(a) shows a bar magnet M falling under gravity through an air cored coil. Plot a graph showing variation of induced e.m.f. with time(t). What does the area encloed by E-t curve depict? by Physics experts to help you in doubts & scoring excellent marks in Class 12 exams.
Updated on:21/07/2023Similar Questions
Plot a graph showing varñation of induced e.m.f. with the rate of change of current flowing through a coil.
View SolutionThe variation of induced emf (e) with time (t) in a coil, if a short bar magnet is moved along its axis with a constant velocity is best represented as :
View SolutionFig. 6.24 shows a bar magnet M falling under gravity through an air cored coil C. Plot a graph Induced showing variation of induced emf (E) with time (t). What does the area enclosed by the E-t curve depict ?
View SolutionThe magnetic flux through a coil is 4×10⁻⁴Wbm2 at time t = 0. It reduces to 10% of its original value in 't' seconds. If the induced e.m.f. is 0.72mV, then what is the time t?
View SolutionThe variation of induced emf (E) with time (t) in a coil if a short bar magnet is moved along its axis with a constant velocity is best represent as

View SolutionThe current i in an induction coil varies with time t according to the graph shown in the figure-5.250. Which of the following graphs shows the induced EMF in the coil with time ?
View SolutionThe graph shows the variation in magnetic flux phi(t) with time through a coil. Which of the statements given below in not correct?
View SolutionThe magnetic flux through a coil varies with timet as shown in the diagram. Which graph best represents the variation of the e.m.f. E induced in the coil with time t?
View Solution
