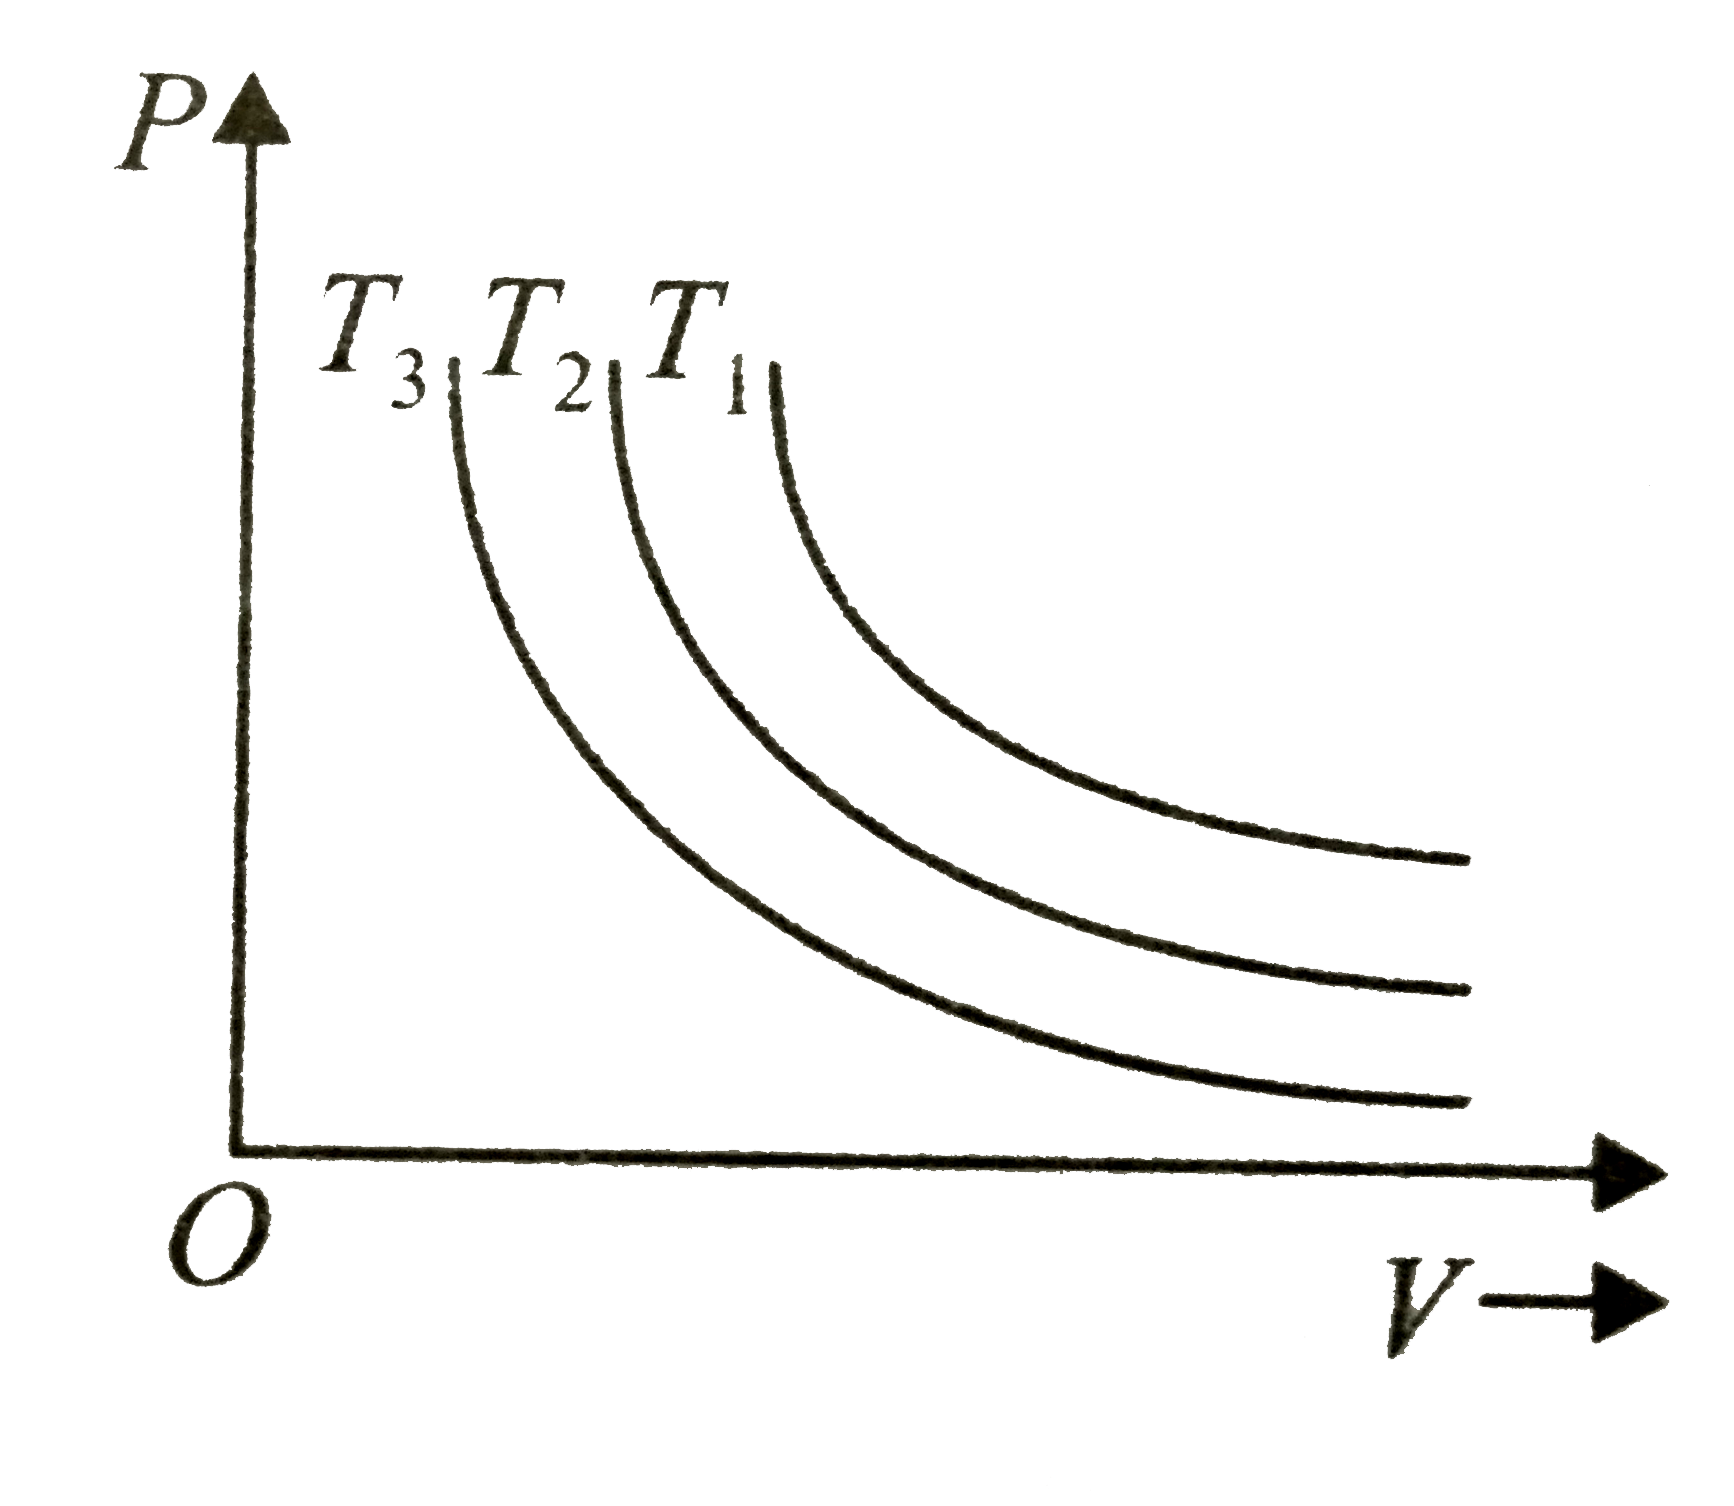
For a certain mass of gas, the isothermal curves between P and V at T1andT2. temperatures are 1 and 2 as shown in figure, then 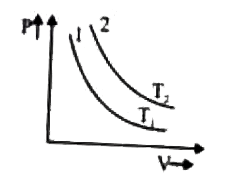
T1>T2
T1=T2
T2>T1
T1>2T2
The correct Answer is:C
In isothermal process curves between P and V is such that T2 is father from the origin than the isothermal at T1,T2>T1.
Topper's Solved these Questions
- THERMODYNAMICSBOOK - PHYSICS WALLAHCHAPTER - THERMODYNAMICSEXERCISE - LEVEL 2
30 Videos
- THERMODYNAMICSBOOK - PHYSICS WALLAHCHAPTER - THERMODYNAMICSEXERCISE - NEET Past 5 Years Questions
14 Videos
- THERMAL PROPERTIES OF MATTER BOOK - PHYSICS WALLAHCHAPTER - THERMAL PROPERTIES OF MATTER EXERCISE - NEET Past 5 Years Questions
12 Videos
- UNITS AND MEASUREMENTS BOOK - PHYSICS WALLAHCHAPTER - UNITS AND MEASUREMENTS EXERCISE - NEET PAST 5 YEARS QUESTIONS
10 Videos
Similar Questions
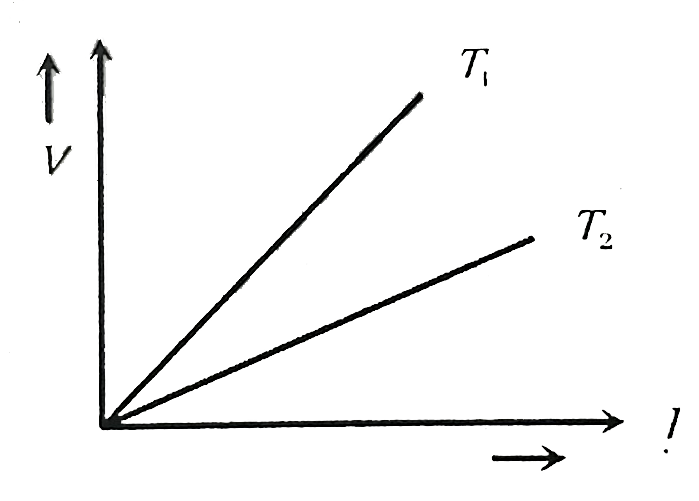
The current - voltage graphs for a given metallic wire at two different temperatures T1andT2 are shown in the figure.
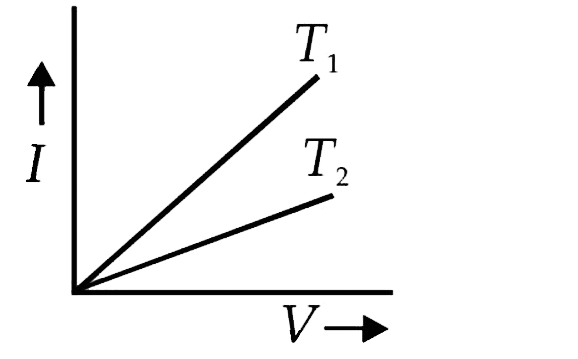
The temperature T2 is greater than T1.
View SolutionThe voltage-current (V-I) graph of a metallic conductor at two different temperature T1 and T2 is shown in figure. At which temperature is the resistance higher?
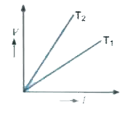
View Solution
Knowledge Check
I, II, III are three isotherms respectively at T1,T2andT3. Temperature will be in order
 AT1=T2=T3BT1<T2<T3CT1>T2>T3DT1>T2=T3
For V versus T curves at constant pressure P1andP2 for and ideal gas shown in figure-
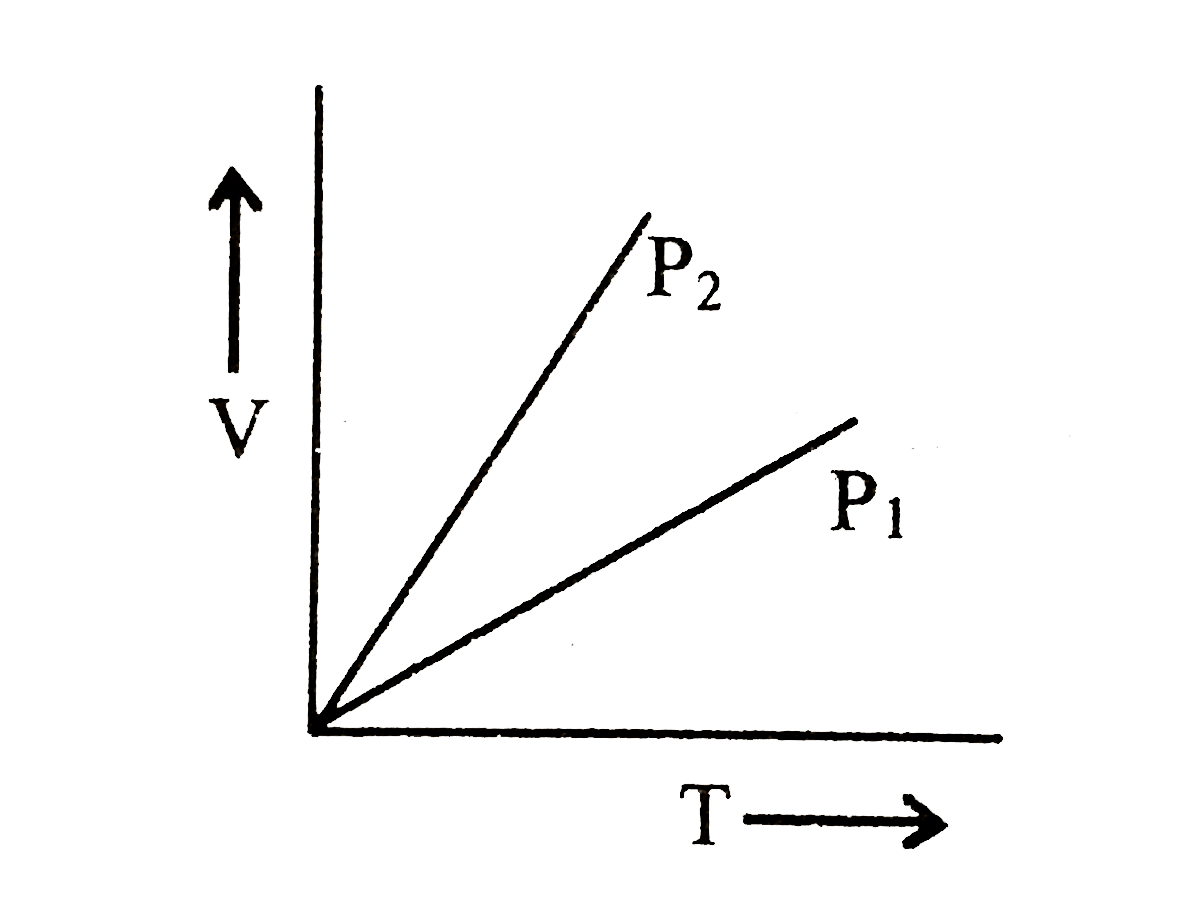 AP1>P2BP1<P2CP1=P2DP1P2
The isothermal diagram of a gas at three different temperatures T1,T2and_(3), is show in the given figure .Then
 AT1<T2<T3BT1<T2>T3CT1>T2>T3DT1>T2<T3
For an ideal gas V−T curves at constant pressure P1 & P2 are shown in figure, from the figure
_E01_061_Q01.png)
View SolutionThe voltage V and current I v graphs for a conductor at two different temperatures T1andT2 are shown in the figure. The relation between T1andT2 is

View SolutionThe voltage V and current I graph for a conductor at two different temperatures T1 and T2 are shown in the figure. The relation between T1 and T2 is
View SolutionFreundlich adsorption isotherm is represnted at temparetures T1,T2andT3 .
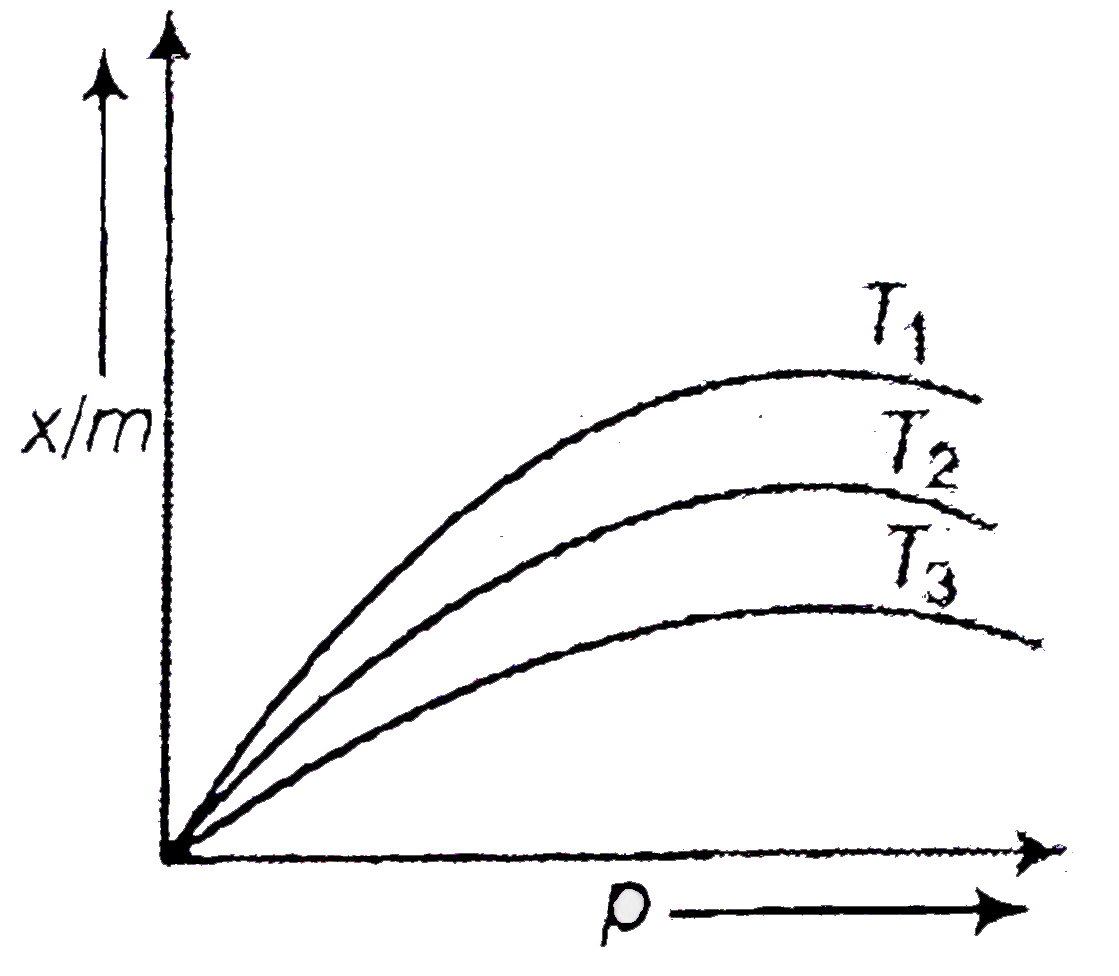
Arrange the temperatures in the increasing order as shown in the graph.
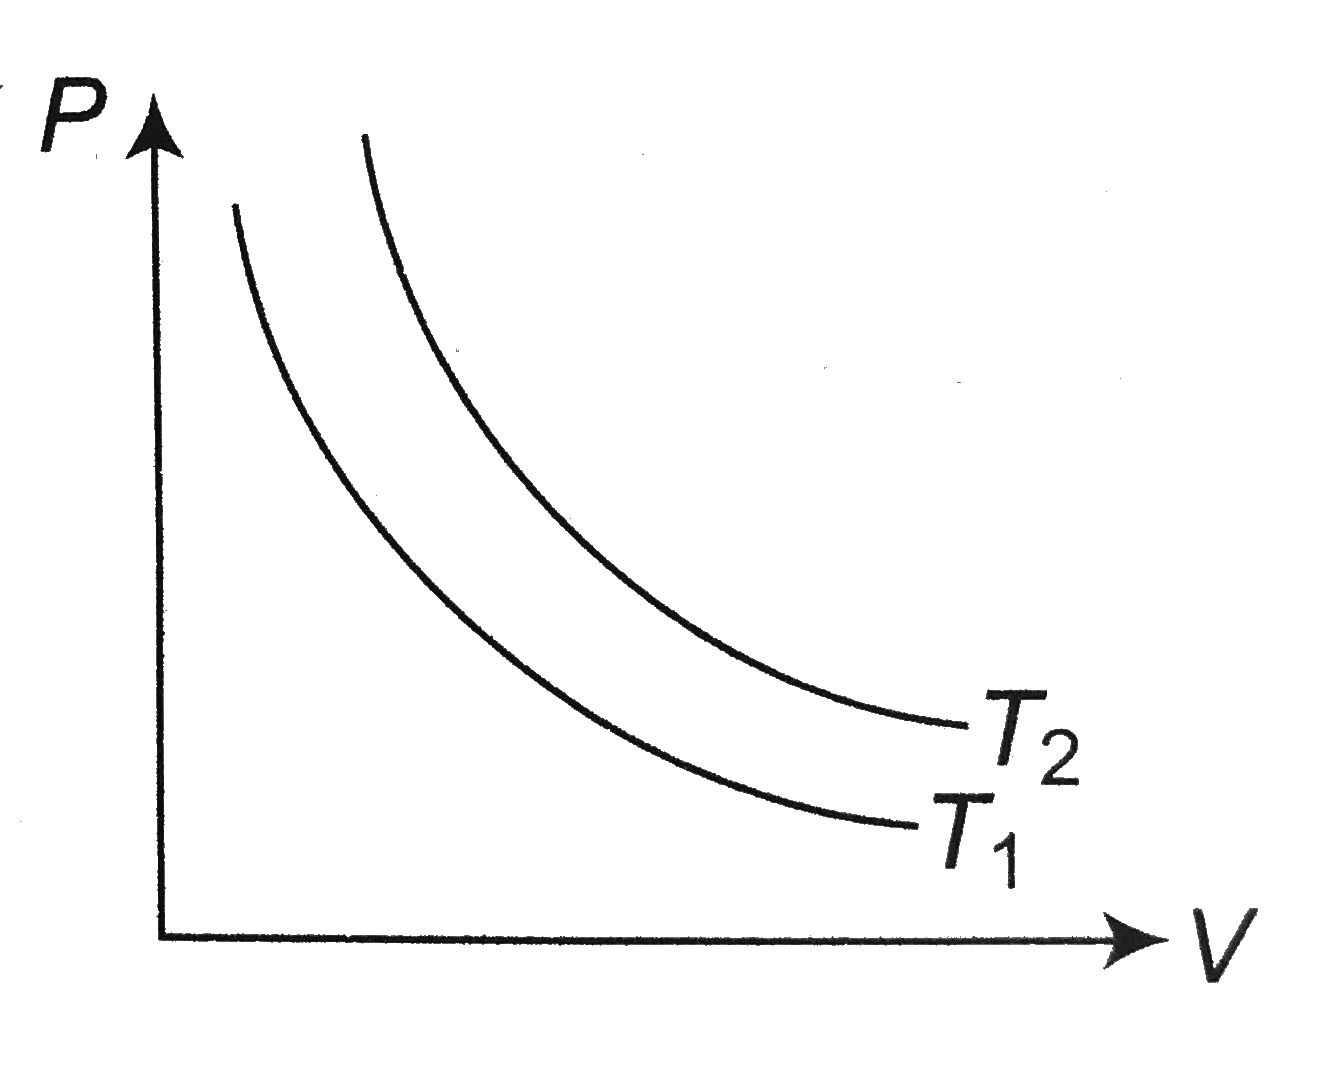
View SolutionFigure shows the pressure P versus volume V graphs for a certains mass of a gas at two constant temperature T1andT2. Which of the following interface is correct?
View Solution

