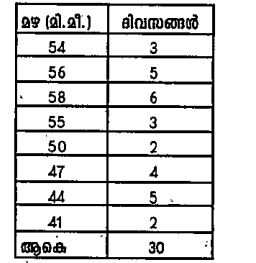
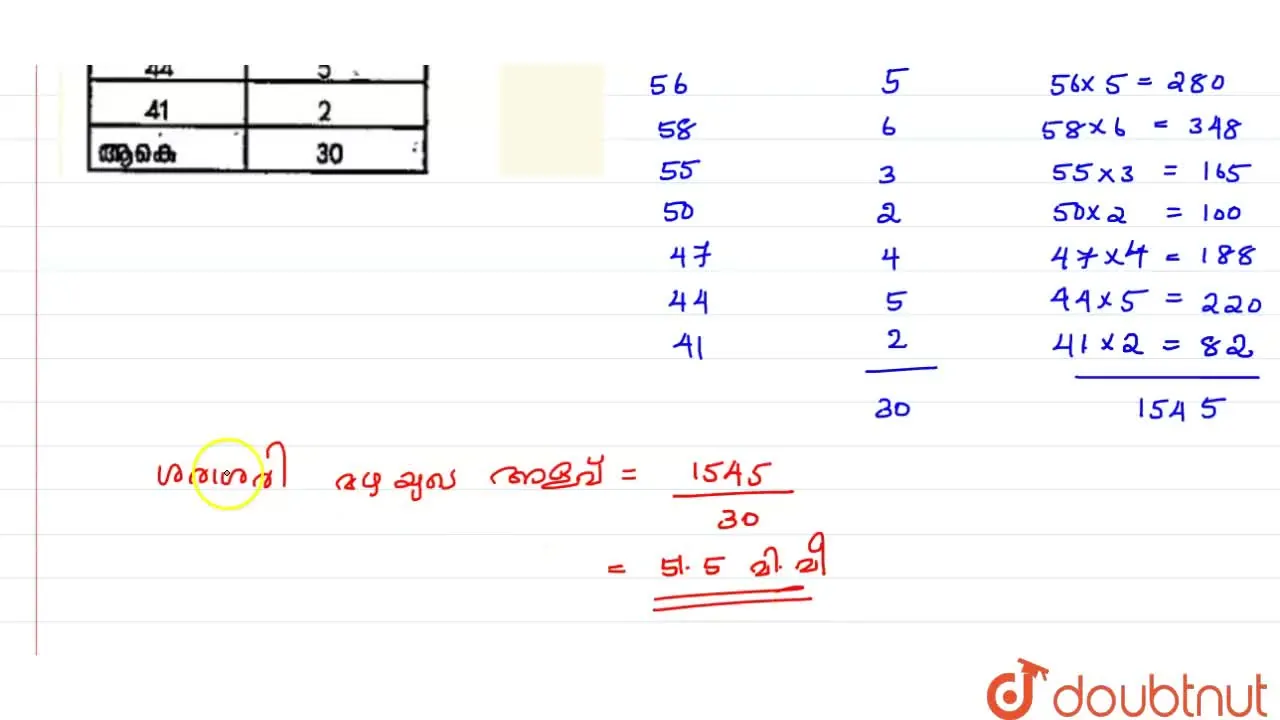
ഒരു പ്രദേശത്ത് ലഭിച്ച മഴയുടെ അളവനുസരിച്ച് ഒരു മാസത്തിലെ ദിവസങ്ങളെ തരംതിരിച്ച പട്ടികയാണിത്. ആ മാസം എവിടെ ഒരു ദിവസം പെയ്ത മഴയുടെ ശരാശരി അളവെന്താണ്?

Step by step video & image solution for ഒരു പ്രദേശത്ത് ലഭിച്ച മഴയുടെ അളവനുസരിച്ച് ഒരു മാസത്തിലെ ദിവസങ്ങളെ തരംതിരിച്ച പട്ടികയാണിത്. ആ മാസം എവിടെ ഒരു ദിവസം പെയ്ത മഴയുടെ ശരാശരി അളവെന്താണ്? by Maths experts to help you in doubts & scoring excellent marks in Class 9 exams.
Similar Questions
The area of the shaded part in the figure given below is ______.
 02:03View Solution
The inequation represented by the graph given below is :
02:10View SolutionThe inequation that best describes the graph given below is _________
02:17View SolutionThe inequation that best describes the following graph is _________
02:10View SolutionWhich inequations represent the shaded region in the given figure
04:23View SolutionMatch the followings (column I with column II)
ltimg src="https://d10lpgp6xz60nq.cloudfront.net/physics_images/NCERT_BIO_XI_C03_E01_011_Q01.png" width="80%"gt03:12View SolutionMatch column I with column II:
ltimg src="https://d10lpgp6xz60nq.cloudfront.net/physics_images/NCERT_BIO_XI_C18_E01_003_Q01.png" width="80%"gt05:46View Solution


