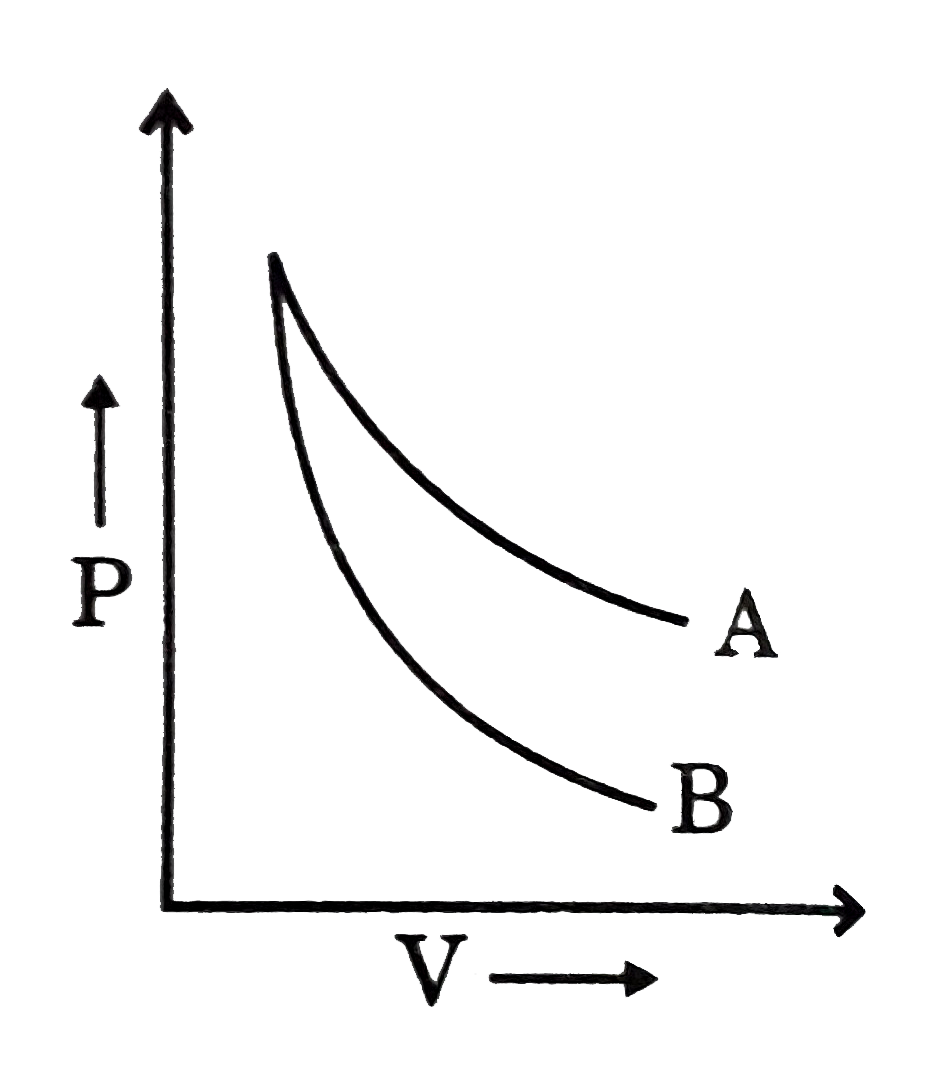
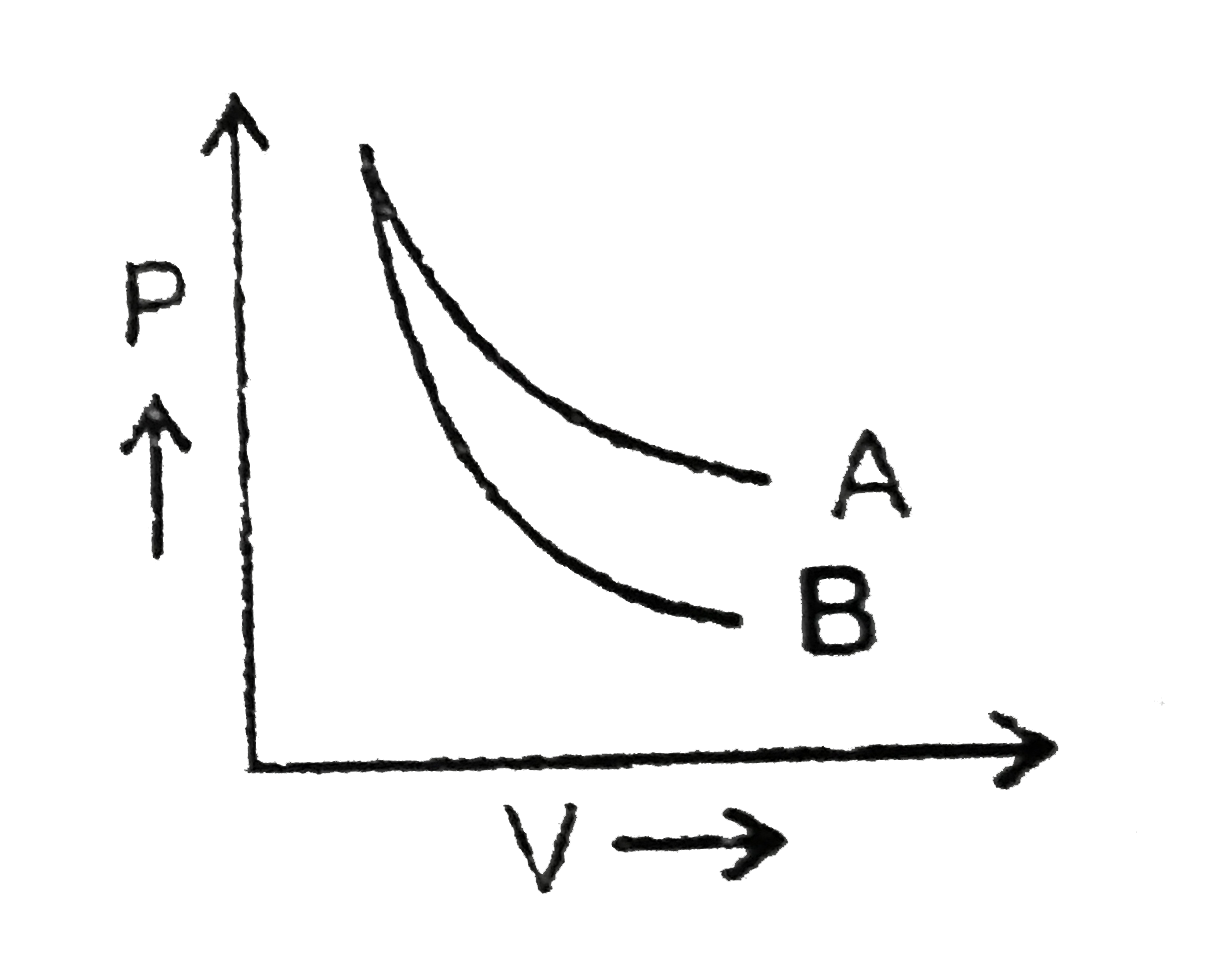
P-V plot for two gases (assuming ideal) during adiabatic processes are given in the figure. Plot A and plot B should correspond respectively to :
 Solution in Punjabi
He and H2
H2 and He
He and Ne
H2 and Cl2
The correct Answer is:B
PV = constant for isothermal process PVγ = constant for adiabatic process so more is the value of γ, more is decrease in pressure.
Topper's Solved these Questions
- THERMODYNAMICSBOOK - NARENDRA AWASTHICHAPTER - THERMODYNAMICSEXERCISE - Level 3 - One Or More Answers Are Correct
1 Videos
- THERMODYNAMICSBOOK - NARENDRA AWASTHICHAPTER - THERMODYNAMICSEXERCISE - Level 3 - Match The Column
2 Videos
- THERMODYNAMICSBOOK - NARENDRA AWASTHICHAPTER - THERMODYNAMICSEXERCISE - Level 2 (Q.1 To Q.30)
1 Videos
- STOICHIOMETRYBOOK - NARENDRA AWASTHICHAPTER - STOICHIOMETRYEXERCISE - Level 3 - Subjective Problems
20 Videos
Similar Questions
Assume ideal gas behaviour for all the gases considered and neglect vibrational degrees of freedom. Separate equimolar sample. Separate equimolar samples of Ne, O2 , CO2 and SO2 were subjected to a two process as mentioned. Initially all are at same state of temperature and pressue.
Step I → All undergo reversible adiabatic expansion to attain same final volume, which is double the original volume thereby causing the decreases in their temperature.
Step → After step I all are given appropriate amount of heat isochorically to restore the original temperature.
Mark the correct option(s) :
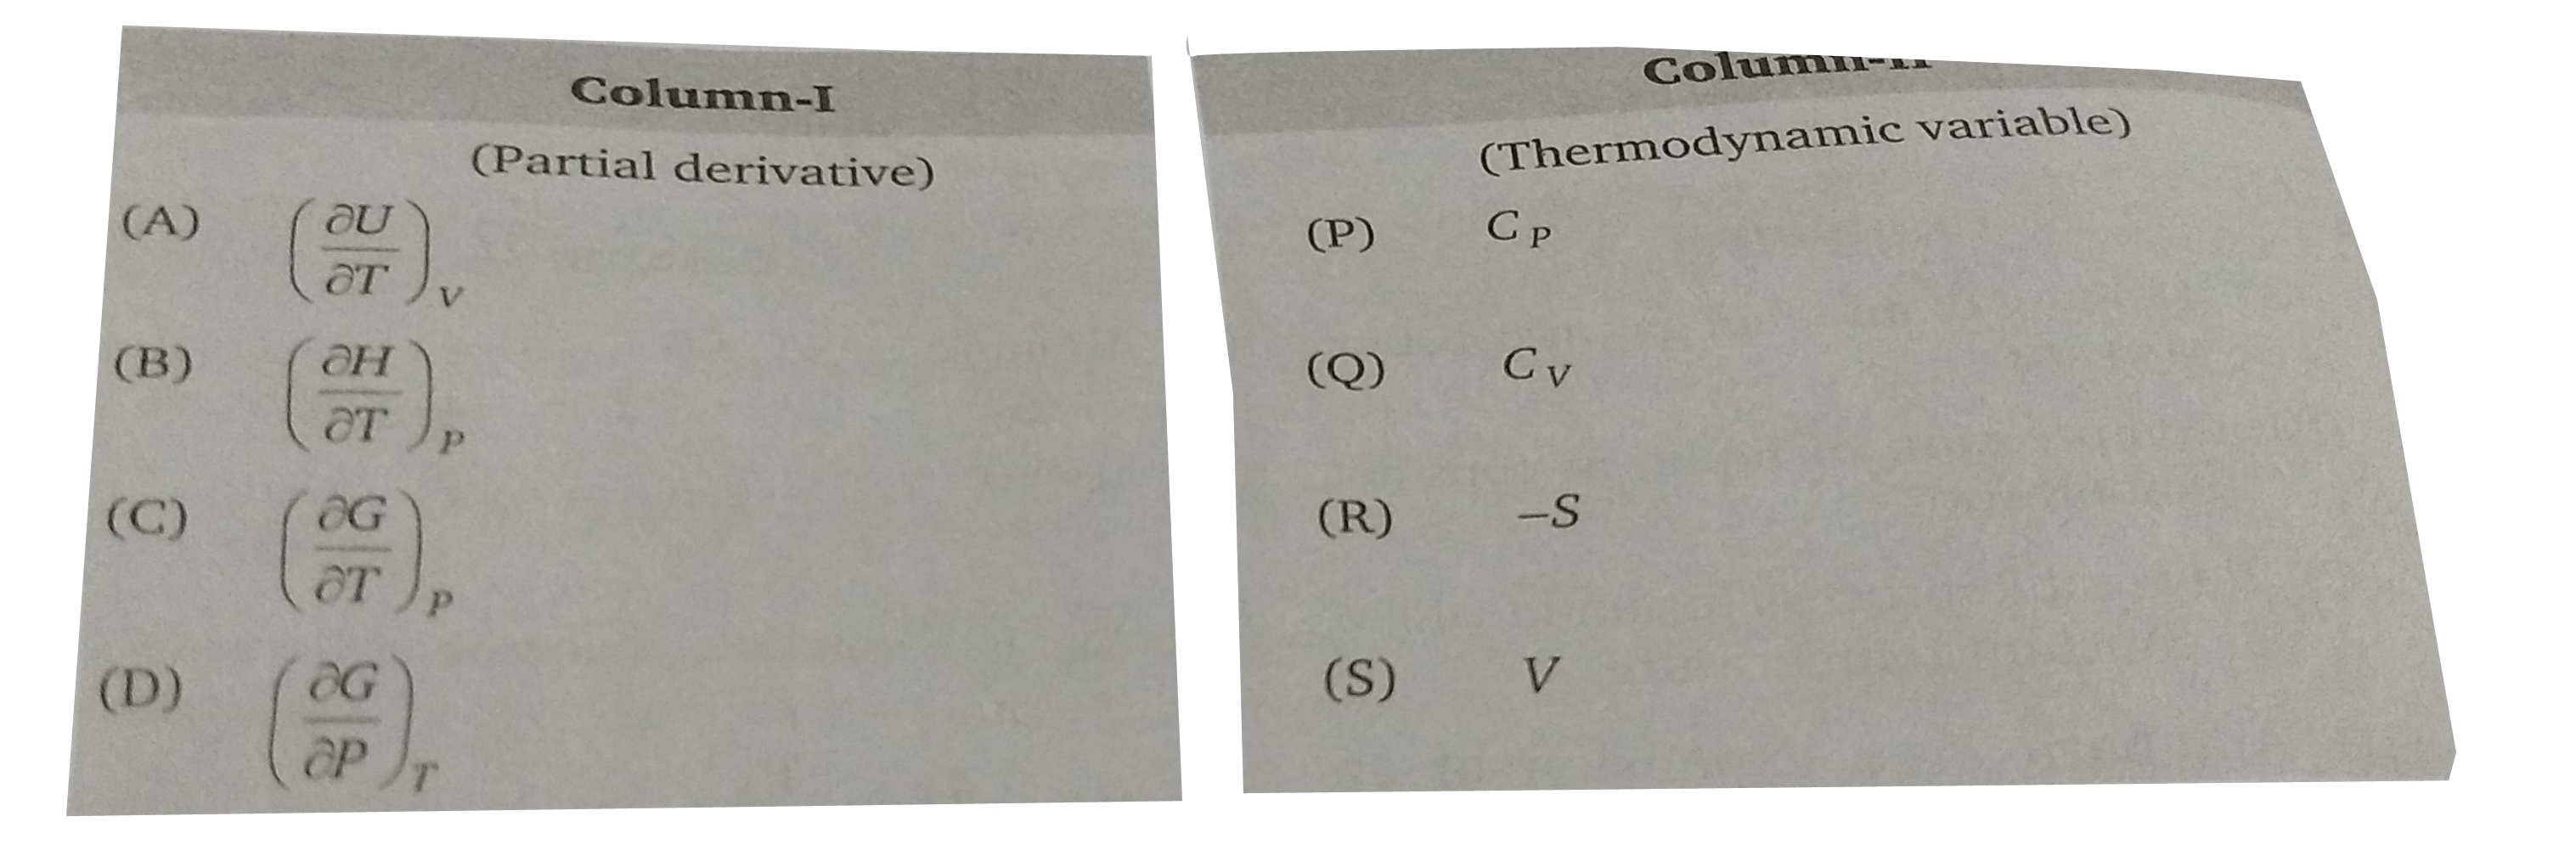
View SolutionMatch the following columns
View SolutionWrite structure of 2,2-dimethylheptane.
View SolutionWhat volume of a liquid (in L) will contain 10 mole ? If molar mass of liquid is 280 and its density is 1.4 g/mL.
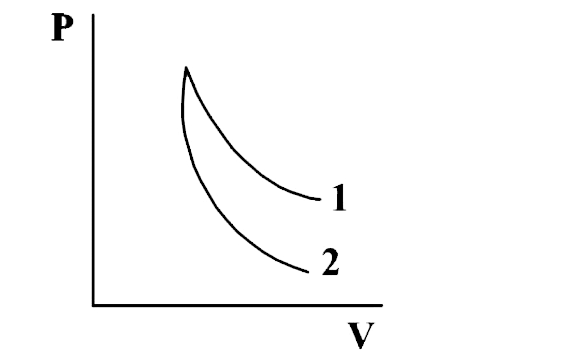
View SolutionP-V plots for two gases during adiabatic processes are shown in the figure. Plots 1 and 2 should corresponds respectively to
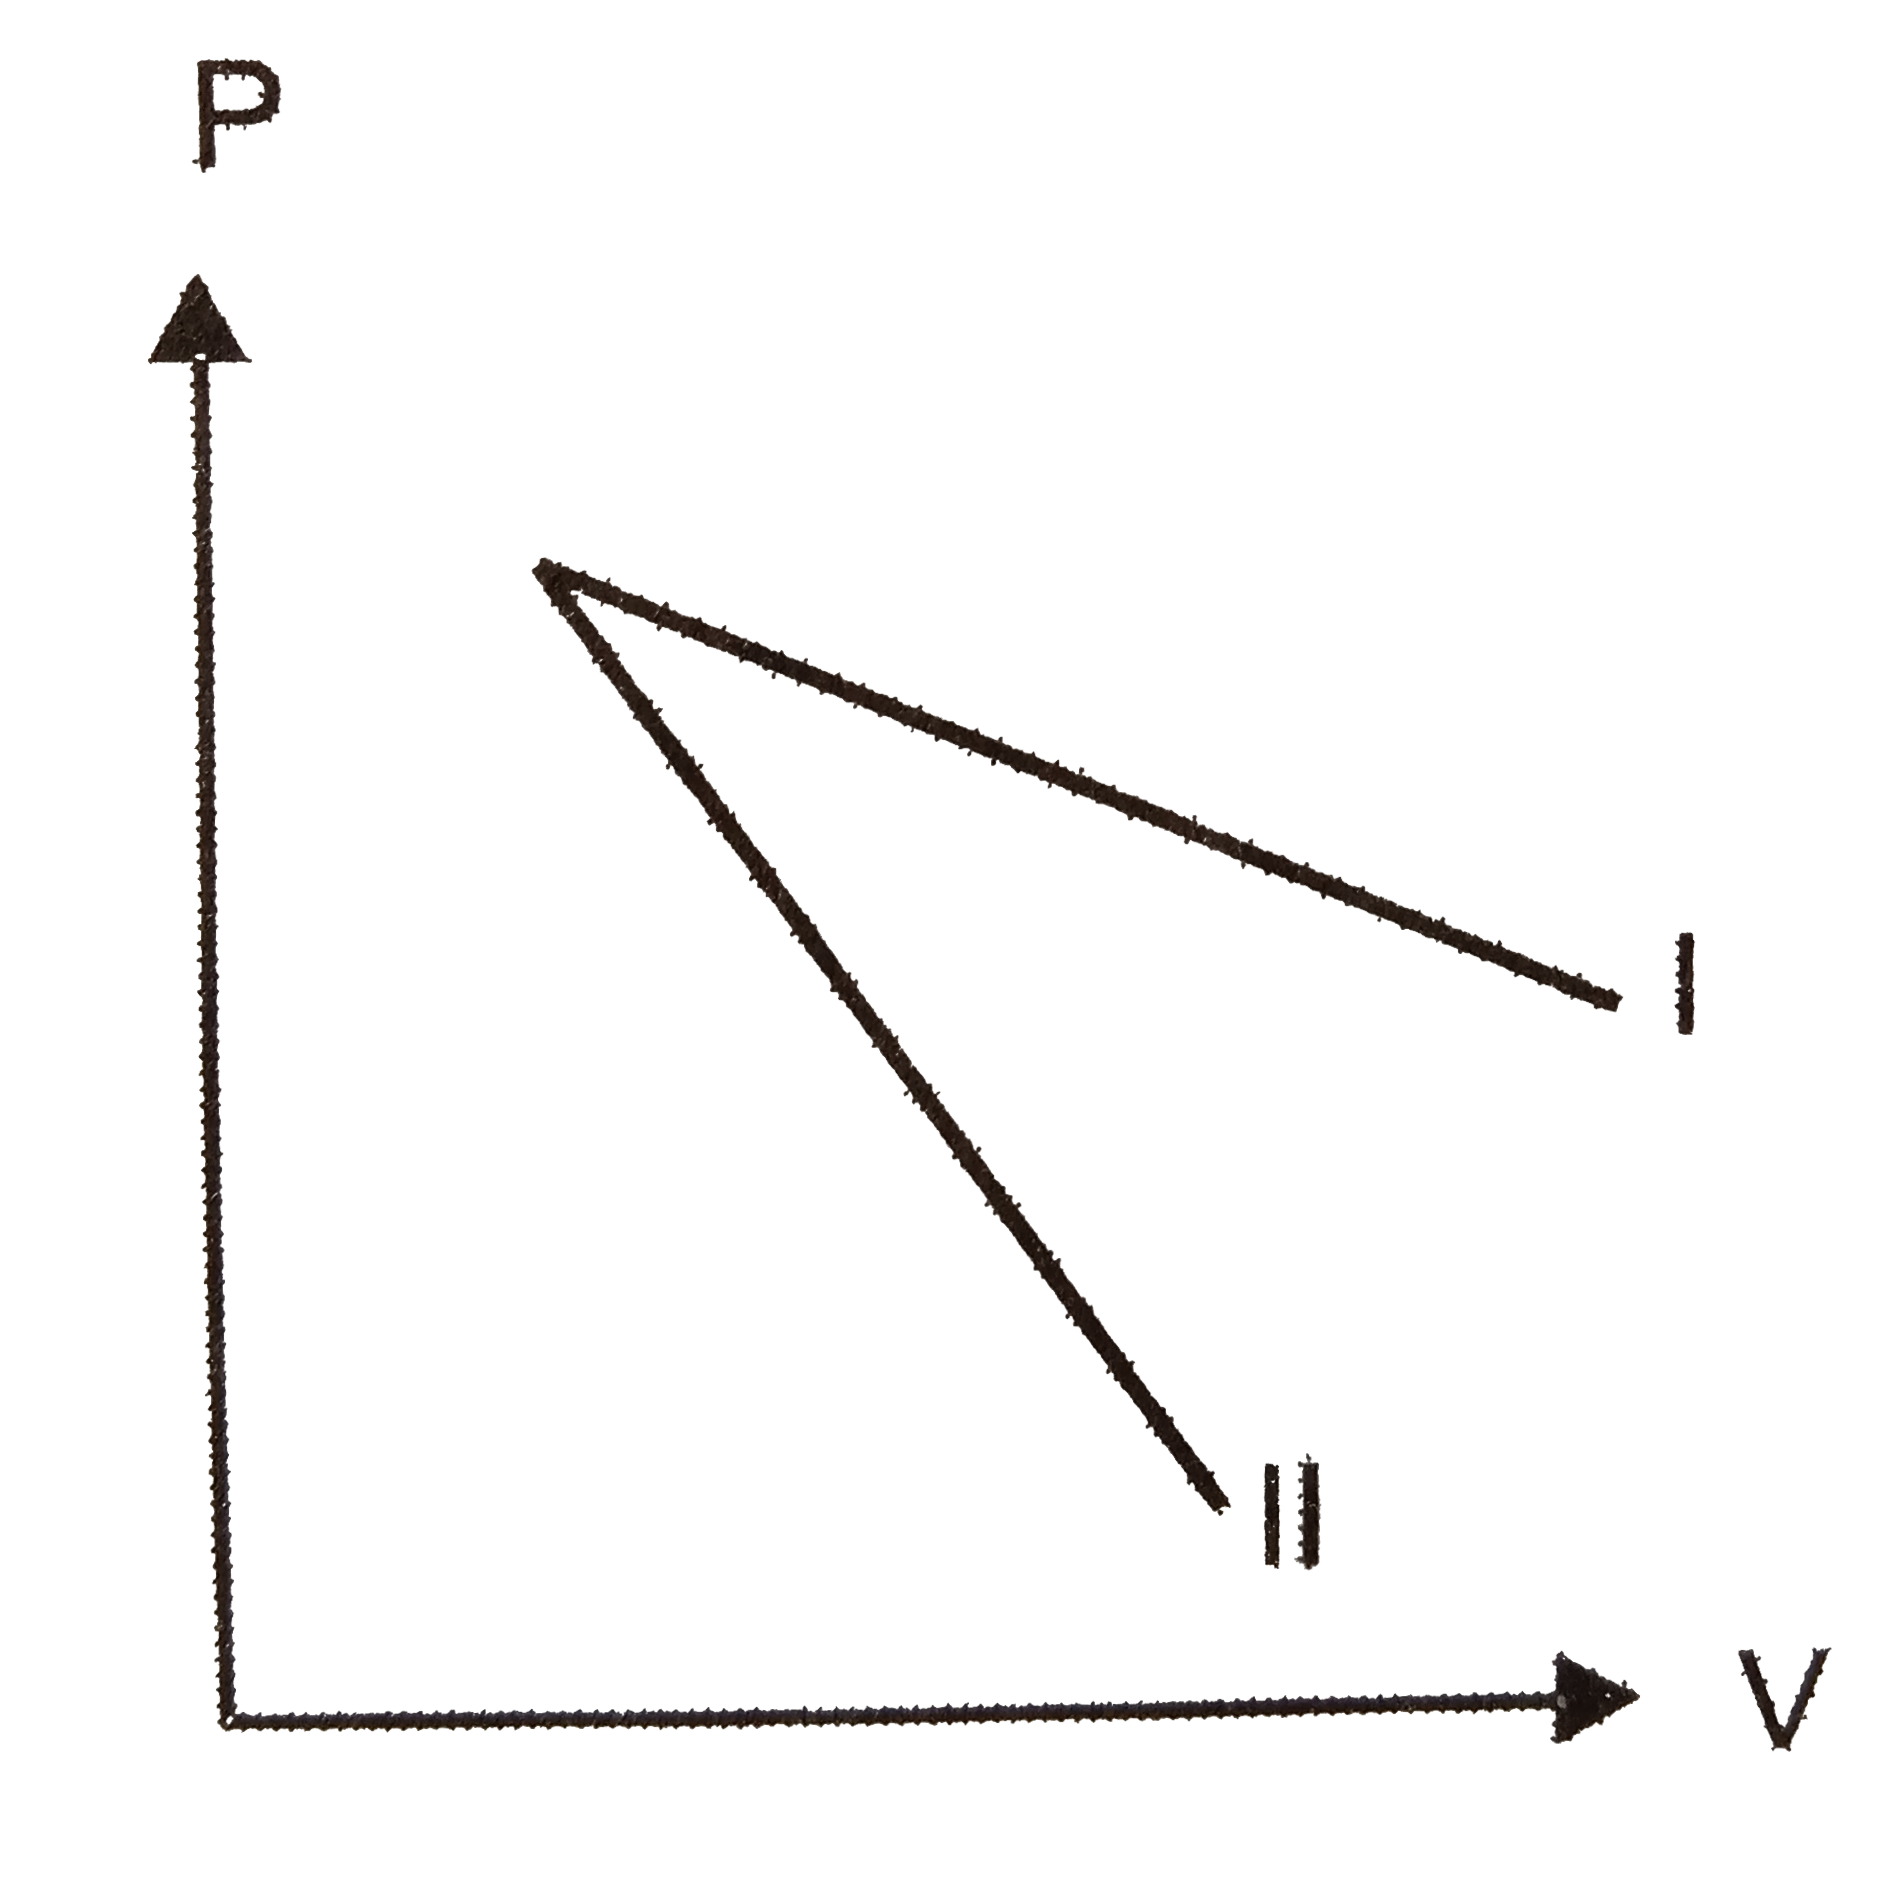
View SolutionP−V plots for two gases during adiabatic expansion are shown in figure. Plot I and II should correspond respectively to :
View SolutionP-V plot for two gases ( assuming ideal ) during adiabatic processes are given in the fig. Plot A and B should correspond respectively to :
View SolutionP-V plot for two gases (assuming ideal) during adiabatic processes are given in the figure. Plot A and plot B should correspond respectively to :

View SolutionP-V plots for two gases during an adiabatic process are given in the figure: Plot A and plot B should correspond to : (Assume ideal behaviour)
View SolutionP−V plot for two gases (assuming ideal) during adiabatic processes are given in the figure. Plot A and Plot B should correspond respectively to:
View SolutionP - V plots for two gases, undergoing adiabatic processes are as shown in the figure.
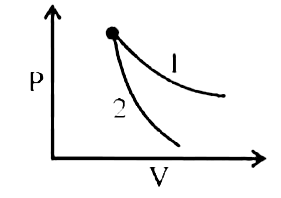
Plots 1 and 2 should correspond respectively to
View SolutionP-V plots for two gases during adiabatic processes are shown in the figure. Plots 1 and 2 should corresponds respectively to

View SolutionP−V plots for two gases during adiabatic expansion are shown in figure. Plot I and II should correspond respectively to :

View SolutionP−V plots for two gases during P4 adiabatic process are shown in the figure. Plots 1 and 2 should correspond respectively to
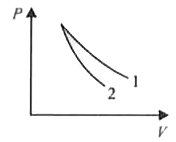
View SolutionP-V plot for two gases (assuming ideal) during adiabatic processes are given in the figure. Plot A and plot B should correspond respectively to :

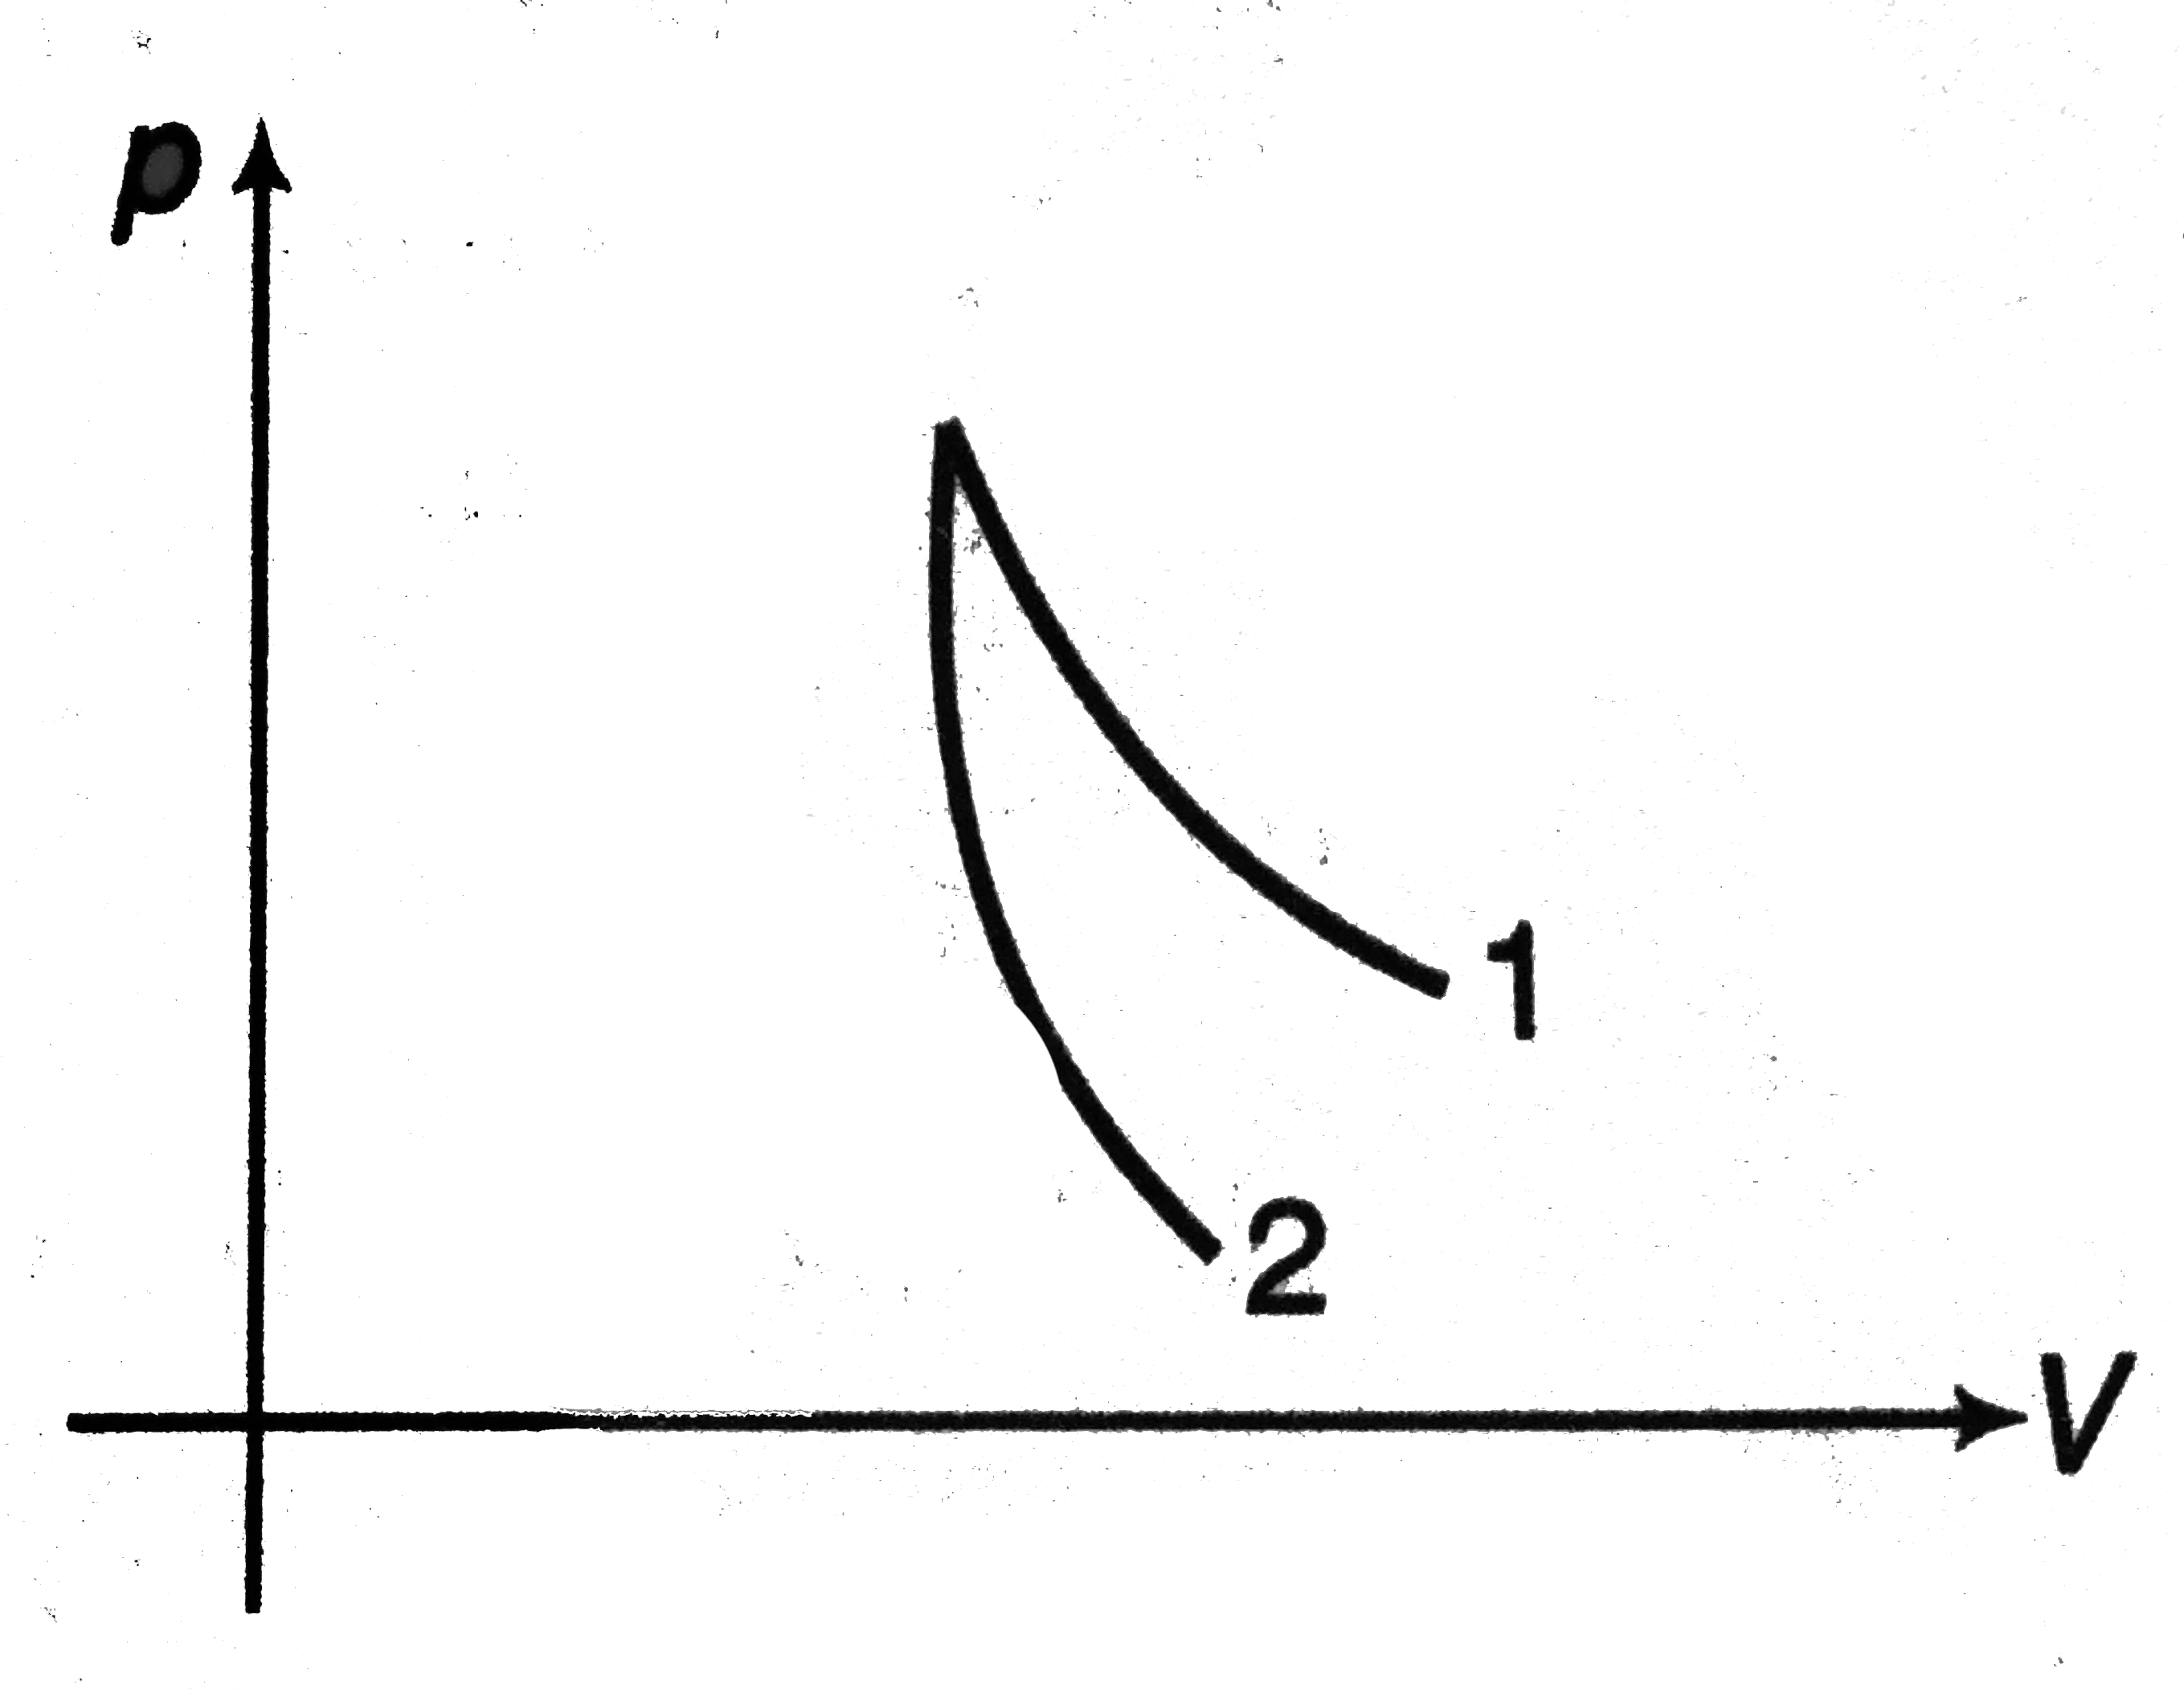
View Solutionp-V plots for two gases during adiabatic processes are shown in the figure. Plots 1 and 2 should correspond respectively to
View Solution
