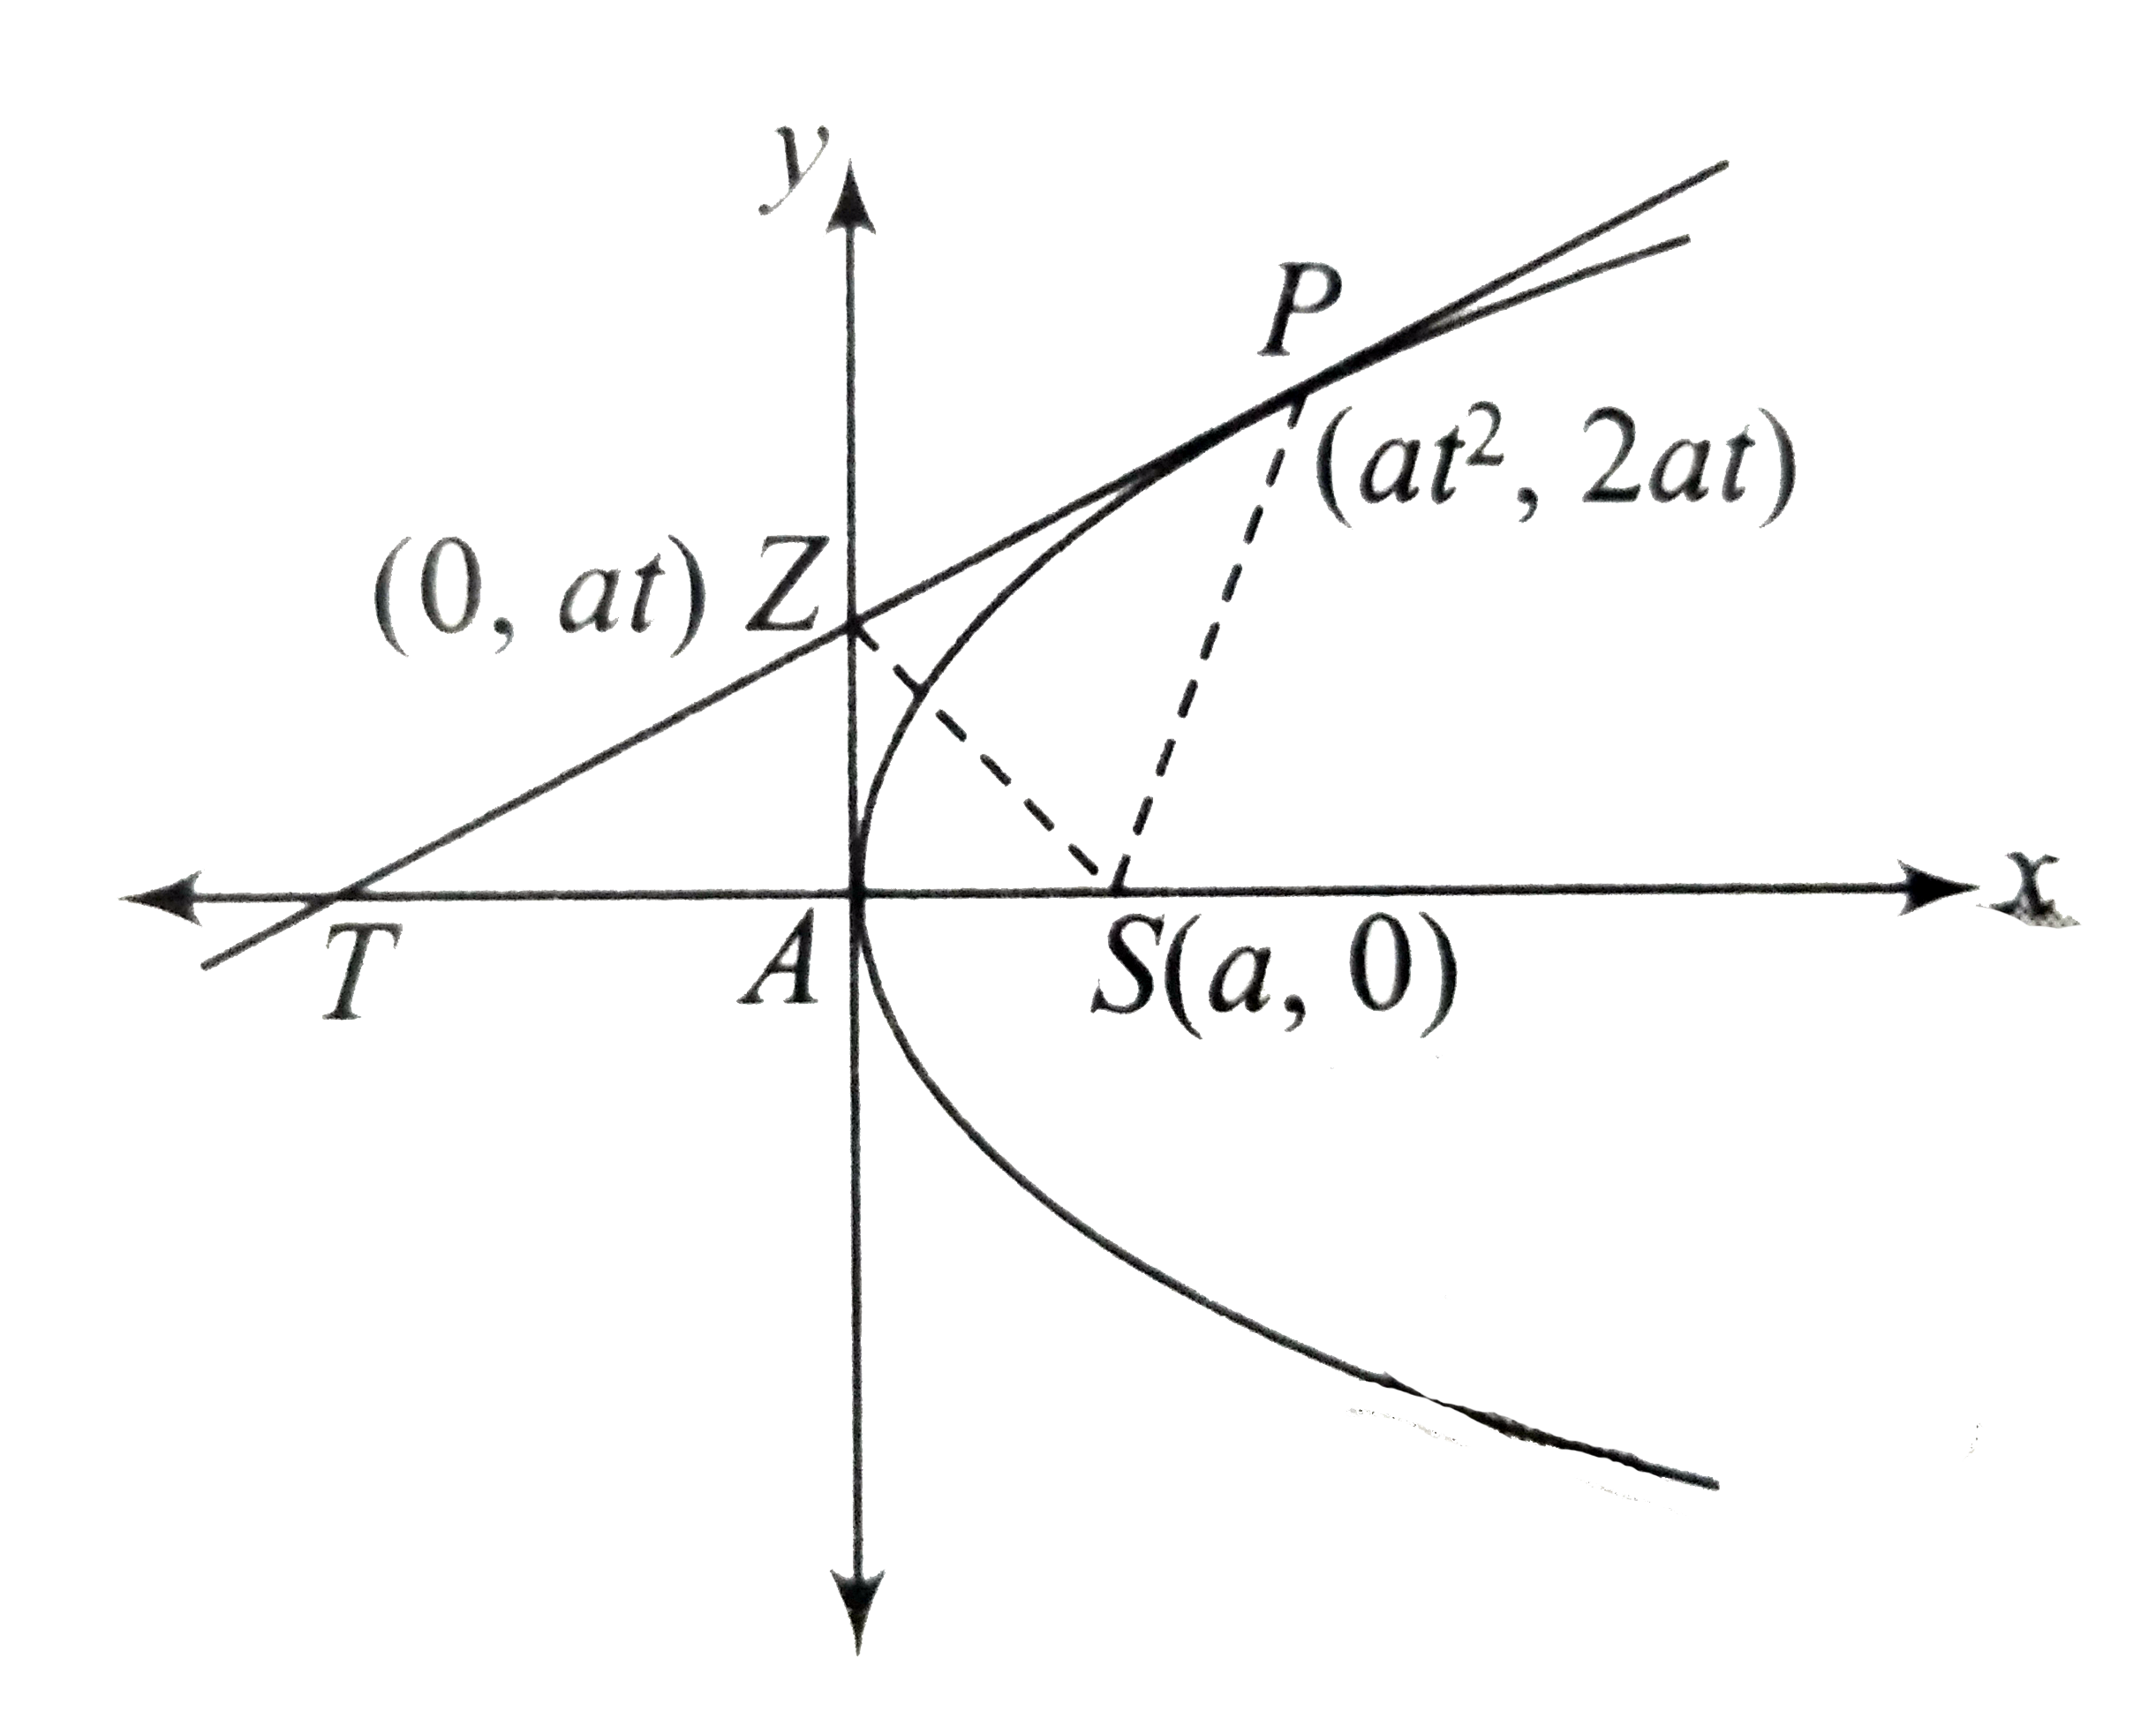
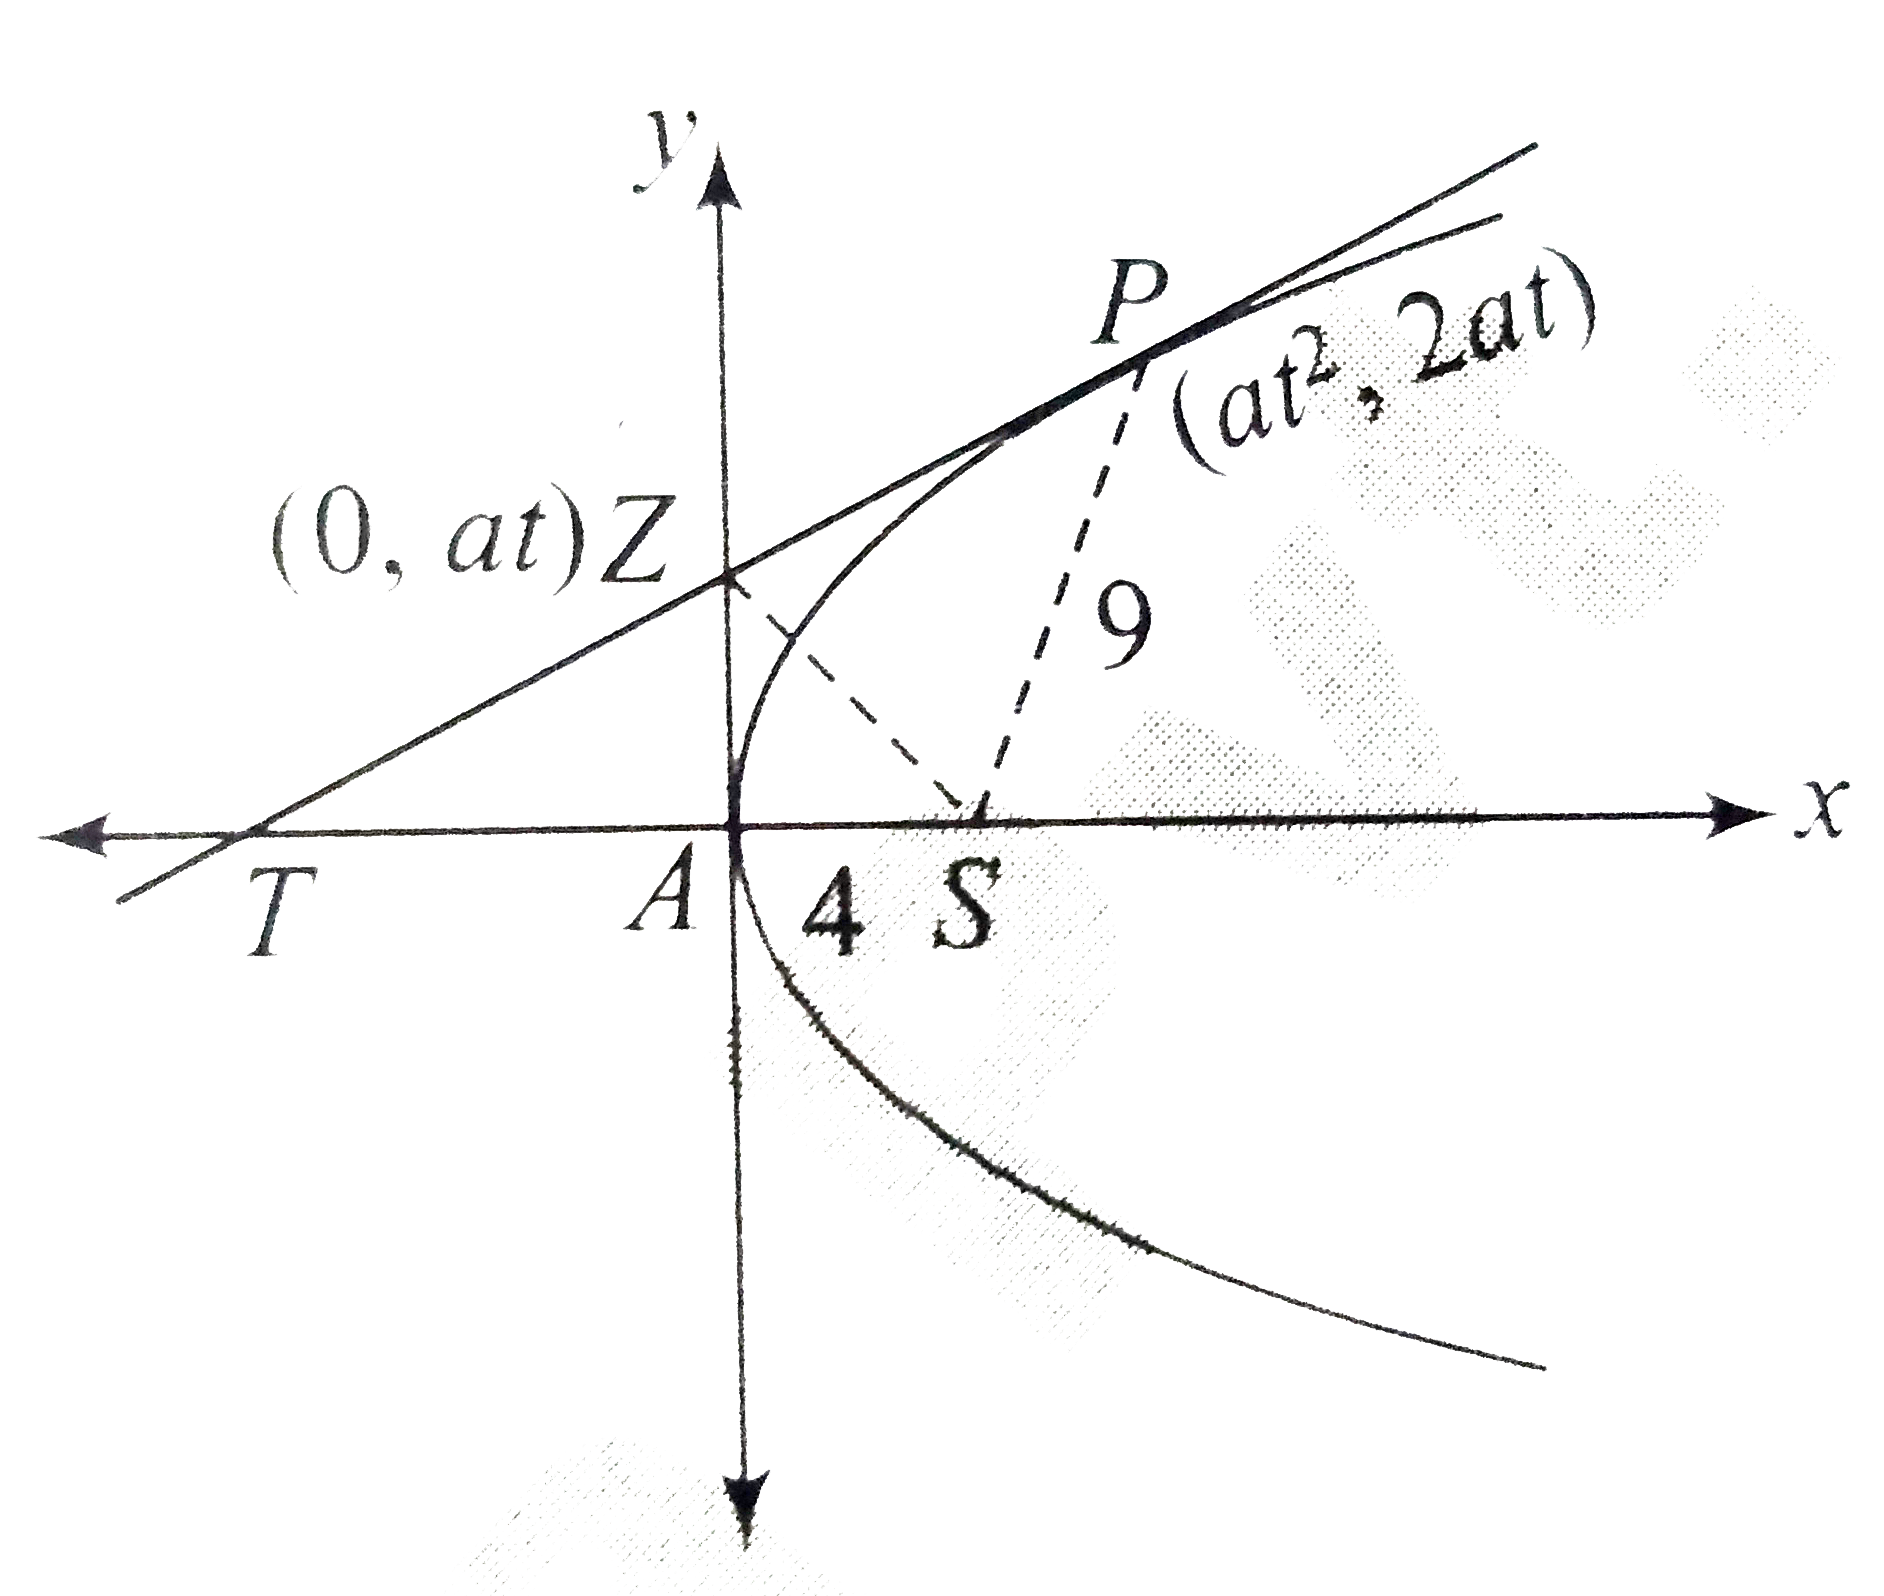
In the following figure, AS=4 and SP=9. The value of SZ is
 Solution in Tamil
6
5.5
6.5
none of these
The correct Answer is:A
Let P(at2,2at) be any point on the parabola y2=4ax, then the equation of the tangent at P is yt=x+at2. It cuts y-axis at (0,at).

Clearly, SZ is perpendicular to PT.
Now, SZ=√a2+a2t2=a√1+t2
Sp=a+at2 and AS=a
∴SZ=a2(1+t2) and AS.SP=a2(t2+1)
Clearly, SZ2=AS.SP
So, from the figure, we have
⇒SZ2=(4)(9)⇒SZ=6
Topper's Solved these Questions
- PARABOLABOOK - CENGAGECHAPTER - PARABOLAEXERCISE - Multiple Correct Answers Type
10 Videos
- PARABOLABOOK - CENGAGECHAPTER - PARABOLAEXERCISE - Comprehension Type
1 Videos
- PARABOLABOOK - CENGAGECHAPTER - PARABOLAEXERCISE - JEE Advenced Single Answer Type
18 Videos
- PAIR OF STRAIGHT LINESBOOK - CENGAGECHAPTER - PAIR OF STRAIGHT LINESEXERCISE - Exercise (Numerical)
5 Videos
- PERMUTATION AND COMBINATIONBOOK - CENGAGECHAPTER - PERMUTATION AND COMBINATIONEXERCISE - Question Bank
4 Videos
Similar Questions
A family of curve S is given by S≡x2+2xy+y2−4x(1−λ)−4y(1+λ)+4, then S=0 represents
View SolutionA parabola is drawn through two given points A(1,0) and B(−1,0) such that its directrix always touches the circle x²+y2=4. Then, The locus of focus of the parabola is=
View Solutionabout to only mathematics
View SolutionThe distance between the lines (x+7y)2+4√2(x+7y)−42=0 is_____________
View SolutionIf the number of ways in which a selection of 100 balls can be made out of 100 identical red balls, 100 identical blue balls and 100 identical white balls is
View SolutionHow many lines of symmetry does the above figure have ?
View SolutionWhich of the following are correct chain isomers of butane ? (i)
View SolutionDetermine the point of symmetry of a regular hexagon.
View SolutionDtermine the images of the following figure about the given line :
View SolutionMatch the following Column A to Column B

View SolutionMatch the following Column A to Column B

View SolutionMatch the following Column A to Column B

View SolutionFind the area of the figure given below.

View SolutionThe area of the shaded part in the figure given below is ______.

View SolutionThe inequation represented by the graph given below is :
View SolutionThe inequation that best describes the graph given below is _________
View Solution
