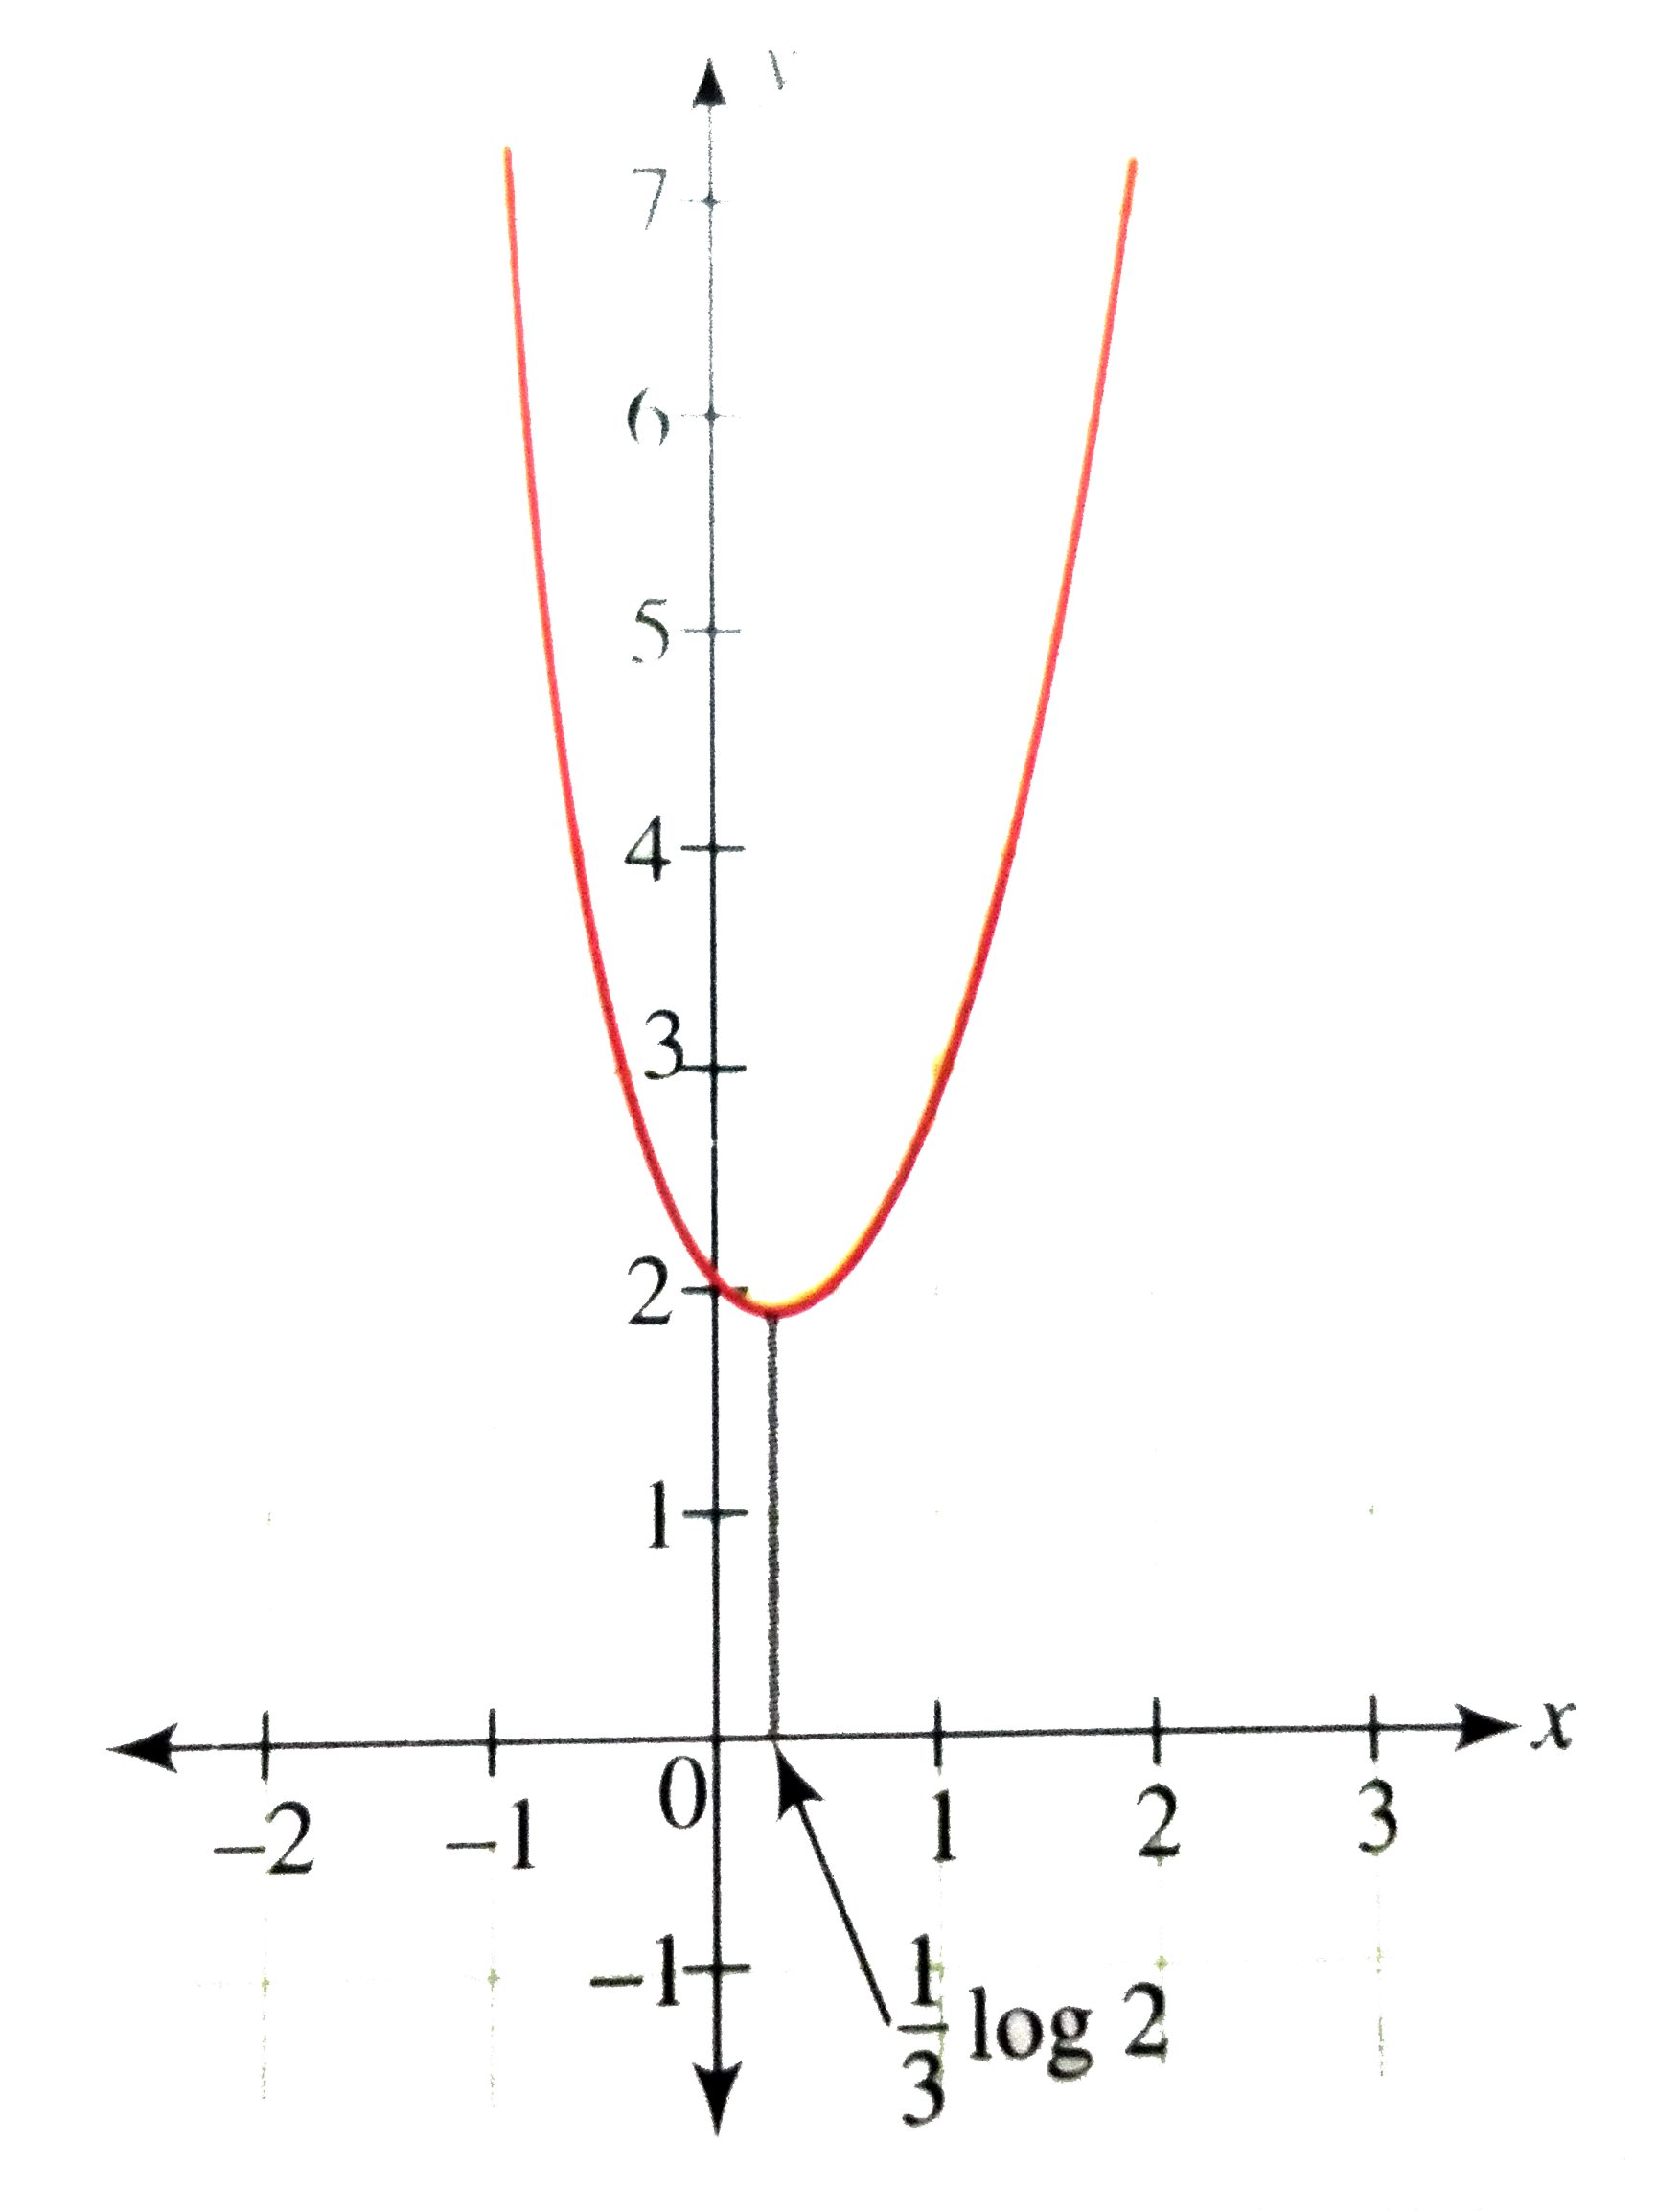
Draw the graph of y=ex+e−2xSolution in Tamil
Video Solution
Text Solution
We have y=f(x)=ex+e−2x
Clearly, the doamin of the function is R.
f(0)=1+1=2
Also f(x)>0,∀x∈R
f′(x)=ex−2e−x=e−2xe3x−2
f′(x)=0∴e3x=2 or x=13log2
f(13log2)e13log2+e−23log2=21/3+2−2/3=3223
f(x) decreases in (−∞,13log2) and increases in (13log2,∞)
Hence the graph of the function is as shown in the following figure.

|
Updated on:21/07/2023
Topper's Solved these Questions
Similar Questions
Draw the graph of y=sin2x−cosx
02:01View SolutionLet →a and →b be two vectors of equal magnitude 5 units. Let →p,→q be vectors such that →p=→a−→b and →q=→a+→b. If |→p×→q|=2{λ−(→a.→b)2}12, then value of λ is
02:54View SolutionSolve: (x+2)3=2x(x2−1)
02:00View SolutionDraw the graph of y=−logex.
View SolutionDraw the graph of y=|loge(x+3)|.
View SolutionDraw the graph of y=|loge|x||.
02:50View SolutionDraw the graph of y=loge(−x),−logex,y=|logex|,y=loge|x| and y=|loge|x|| transforming the graph of y=logex.
03:22View SolutionDraw the graph of y=ex+e−2x
01:47View SolutionDraw the graph of y=(logex)2
03:33View SolutionDraw the graph of y=ex−e−x2.
05:39View SolutionDraw the graph of y=|loge(x+3)|.
04:51View SolutionDraw the graph of y=exsin2πx.
04:49View SolutionDraw the graph of y=loge(−x),−logex,y=|logex|,y=loge|x| and y=|loge|x|| transforming the graph of y=logex.
03:45View SolutionDraw the graph of y=ex+e−2x
04:08View SolutionDraw the graph of y=ex−e−x2.
03:19View Solution
