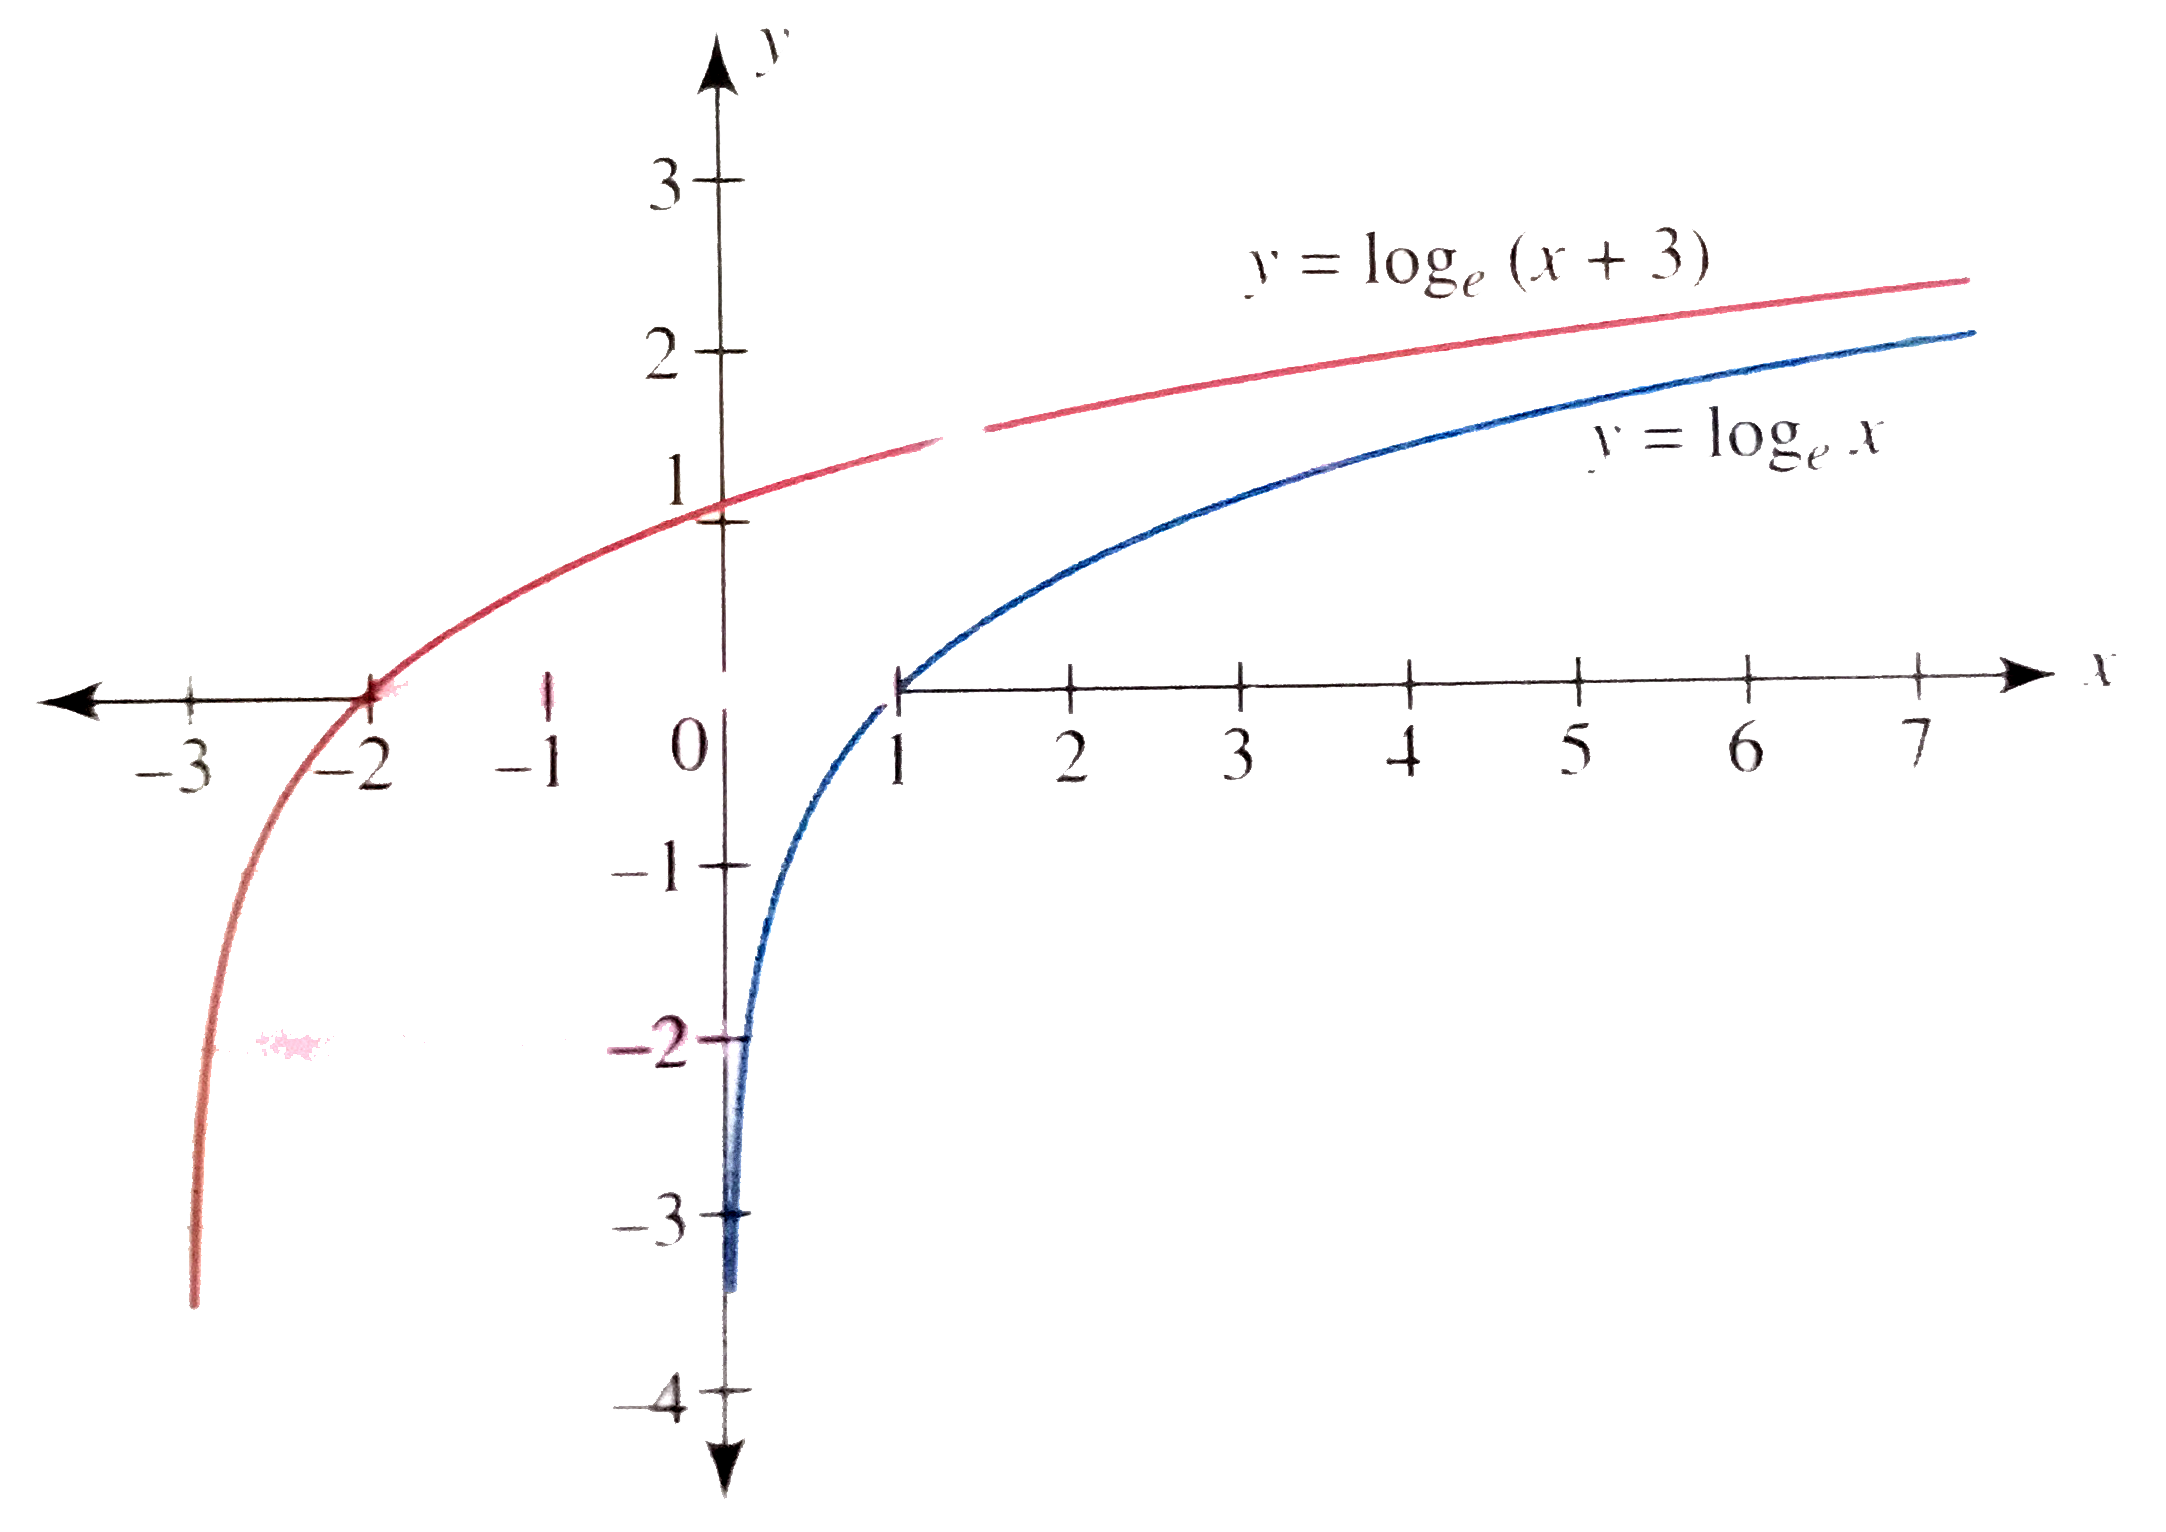
Draw the graph of y=loge(x+3),Solution in Tamil
To draw the graph of y=loge(x+3), we shift the graph of y=logex'3' units to the left.

Topper's Solved these Questions
- GRAPHICAL TRANSFORMATIONSBOOK - CENGAGECHAPTER - GRAPHICAL TRANSFORMATIONSEXERCISE - Exercise
14 Videos
- GRAPH OF INVERSE TRIGONOMETRIC FUNCTIONSBOOK - CENGAGECHAPTER - GRAPH OF INVERSE TRIGONOMETRIC FUNCTIONSEXERCISE - Exercise
18 Videos
- GRAPHS OF POLYNOMIAL AND RATIONAL FUNCTIONSBOOK - CENGAGECHAPTER - GRAPHS OF POLYNOMIAL AND RATIONAL FUNCTIONSEXERCISE - Exercises
4 Videos
Similar Questions
Draw the graph of y=tan−1x−cot−1x.
View SolutionDraw the graph of y=tan−1x+cot−1x
View SolutionSketch the graph of an example of a rational function f that satisfies all the given conditions.
(i) f(0)=0,f(1),limx→∞f(x)=0,f is odd
(ii) limx→0+f(x)=∞,limx→0−f(x)=−∞,limx→∞f(x)=1,limx→−∞f(x)=1
(iii) limx→−2f(x)=∞,limx→−∞f(x)=3,limx→∞f(x)=3,f(0)=0
View SolutionDraw the graph for y=|logx|
View SolutionDraw the graph of y=loge(x+3),
View SolutionDraw the graph of y=x/ln x
View SolutionDraw the graph of y=|−ln|−x∣∣
View SolutionDraw the graph of y=−log(x) when the graph of y=logx is known.
View SolutionDraw the graph of y=|logx| when the graph of y=log(x) is known.
View SolutionDraw the graph of y=loge(x+3),
View SolutionDraw the graph of y=x/ln x
View SolutionDraw the graph of y=−log(x) when the graph of y=logx is known.
View SolutionDraw the graph of y=|logx| when the graph of y=log(x) is known.
View SolutionTo draw the graph of y = log e ( − x ) , flip the graph of y = log e x over the y-axis shown in the following figure.
View SolutionDraw the graph of y=x/ln x
View Solution
