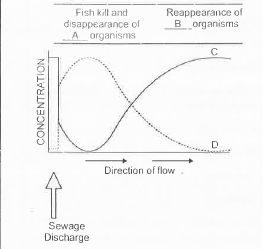
The graph given below represents the effect of sewage discharge on some important characteristics of river.
Select the correct option with respect to the peaks A and B.
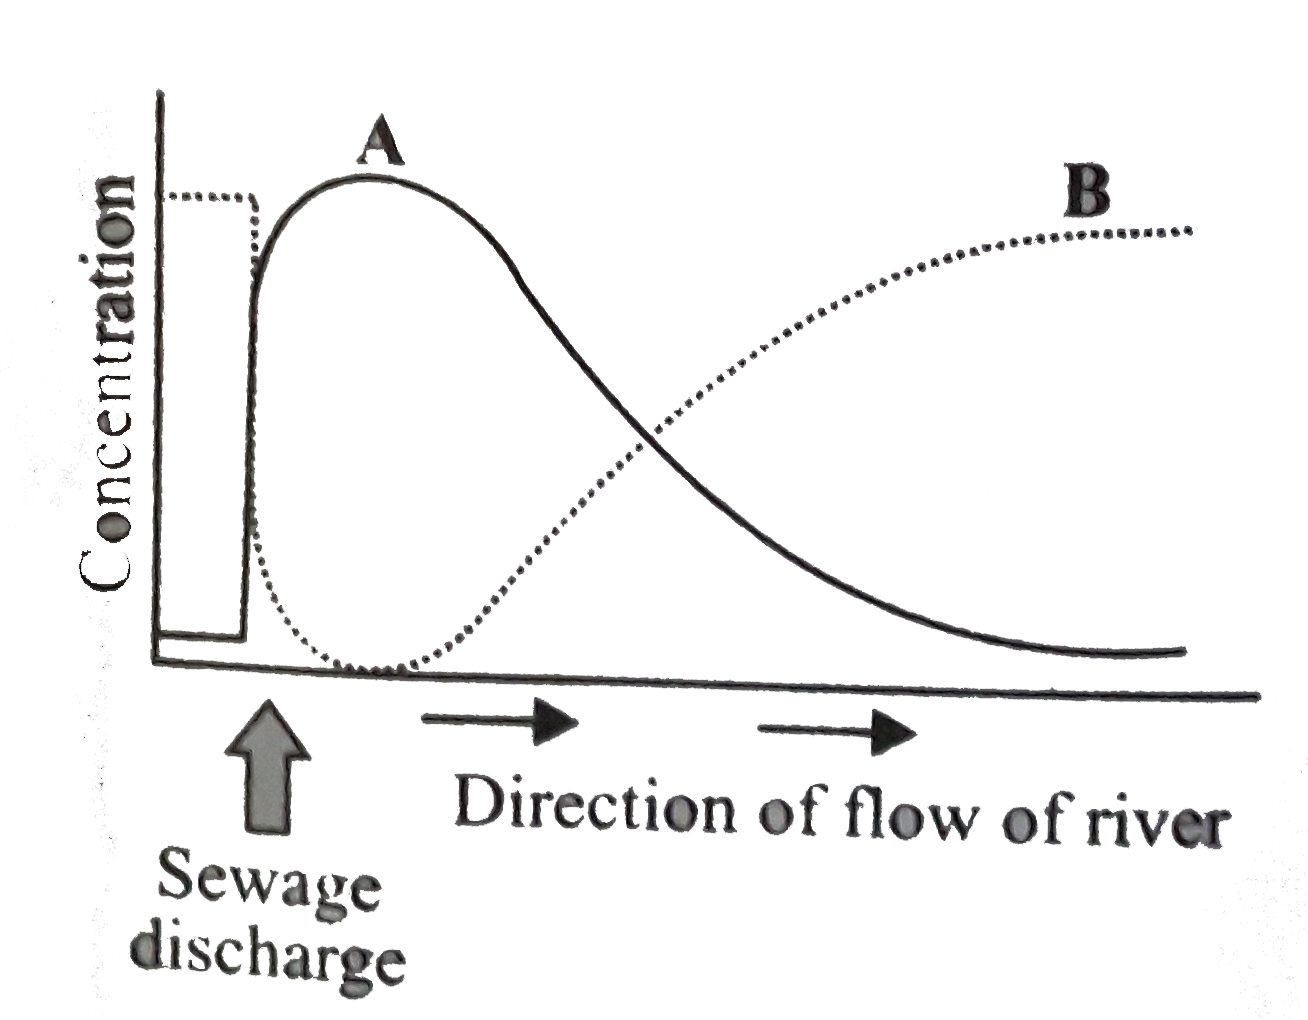
Peak A - Sharp increase in BOD, disappearance of clean water organisms.
Peak B - Increase in dissolved oxygen, reappearance of clean water organisms.
Peak A - Increase in dissolved oxygen, reappearance of clean water organisms.
Peak B - Sharp decline in dissolved oxygen, disappearance of clean water organisms.
Peak A - Sharp increases in BOD, appearance of clean water organisms
Peak B - Increase in dissolved oxygen, disappearance of clean water organisms
Peak A - Increased number of anaerobic bacteria, disappearance of clean water organisms.
Peak B - Sharp decline in dissolved O2, reappearance of clean water organisms.
The correct Answer is:B
Step by step video, text & image solution for The graph given below represents the effect of sewage discharge on some important characteristics of river. Select the correct option with respect to the peaks A and B. by Biology experts to help you in doubts & scoring excellent marks in Class 12 exams.
Updated on:21/07/2023Topper's Solved these Questions
- ENVIRONMENTAL ISSUES Book:PHYSICS WALLAHChapter:ENVIRONMENTAL ISSUES Exercise:NEET PAST 10 YEARS QUESTIONS
Explore 40 Videos
- ENVIRONMENTAL ISSUES Book:PHYSICS WALLAHChapter:ENVIRONMENTAL ISSUES Exercise:NEET PAST 10 YEARS QUESTIONS
Explore 40 Videos
- ECOSYSTEMBook:PHYSICS WALLAHChapter:ECOSYSTEMExercise:NEET Past 10 Years Questions
Explore 45 Videos
- EVOLUTIONBook:PHYSICS WALLAHChapter:EVOLUTIONExercise:NEET Past 10 Years Questions
Explore 46 Videos
Similar Questions
Knowledge Check
The graph given below represents the effect of sewage discharge on some important characteristics of river.
Select the correct option with respect to the peaks A and B.
 APeak A - Sharp increase in BOD, disappearance of clean water organisms.
Peak B - Increase in dissolved oxygen, reappearance of clean water organisms.BPeak A - Increase in dissolved oxygen, reappearance of clean water organisms.
Peak B - Sharp decline in dissolved oxygen, disappearance of clean water organisms.CPeak A - Sharp increases in BOD, appearance of clean water organisms
Peak B - Increase in dissolved oxygen, disappearance of clean water organismsDPeak A - Increased number of anaerobic bacteria, disappearance of clean water organisms.
Peak B - Sharp decline in dissolved O2, reappearance of clean water organisms.The graph given below represents the effect of sewage discharge of some important characteristics of river
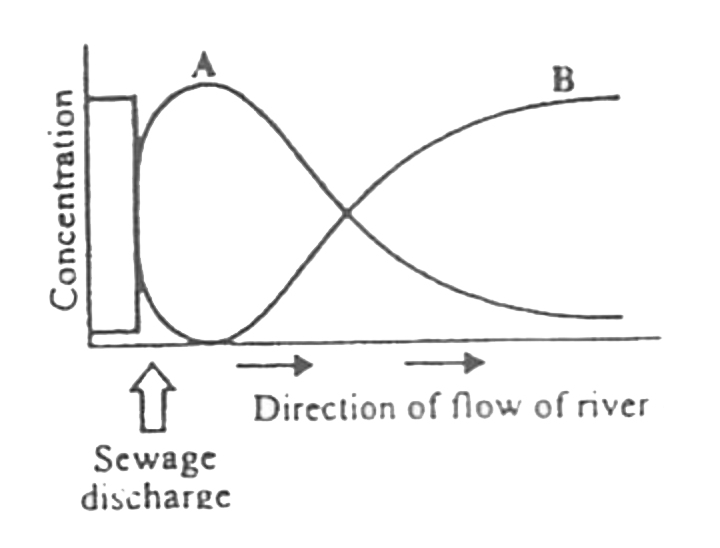
Select the CORRECT option with respect to peaks A and B.APeak A - Sharp increase in BOD , the disappearance of clean water organisms
Peak B - In crease in dissolved oxygen , the reappearance of clean water organisms.BPeak A - Increase in dissolved oxygen , the reappearance of clean water organisms.
Peak B - Sharp decline in dissolved oxygen , the disappearance of clean water organisms.CPeak A - Sharp increase in BOD , the appearance of clean water organisms.
Peak B - Increases of clean water organisms.DPeak A - Increased number of anaerobic bacteria, the disappearance of clean water organisms.
Peak B. Sharp decline in dissolved O2 , the reappearance of clean water organismsChoose the correct representation of effect of sewage discharge on important characteristics of a river.
A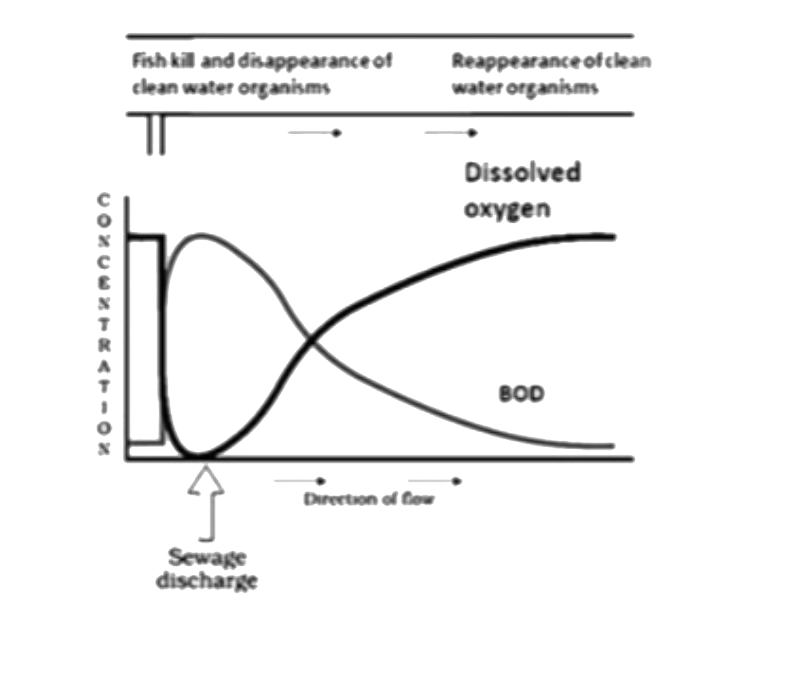 B
B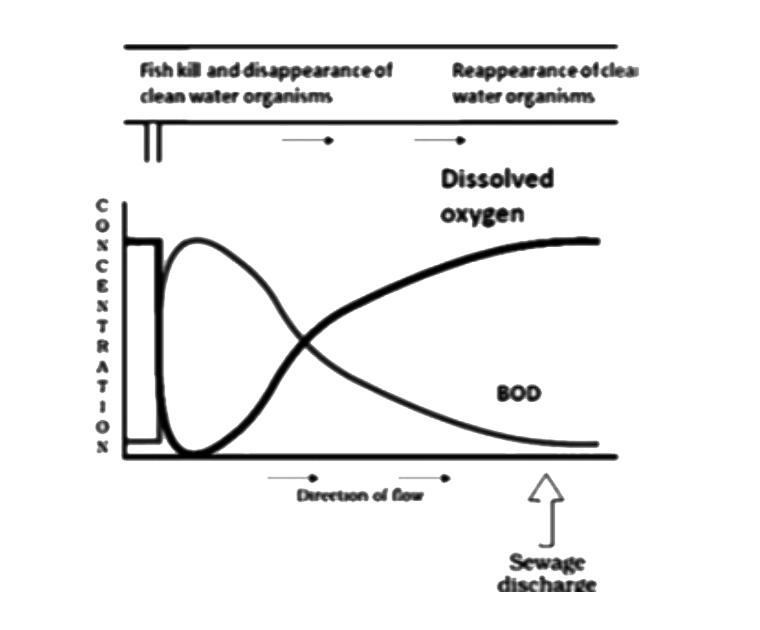 C
C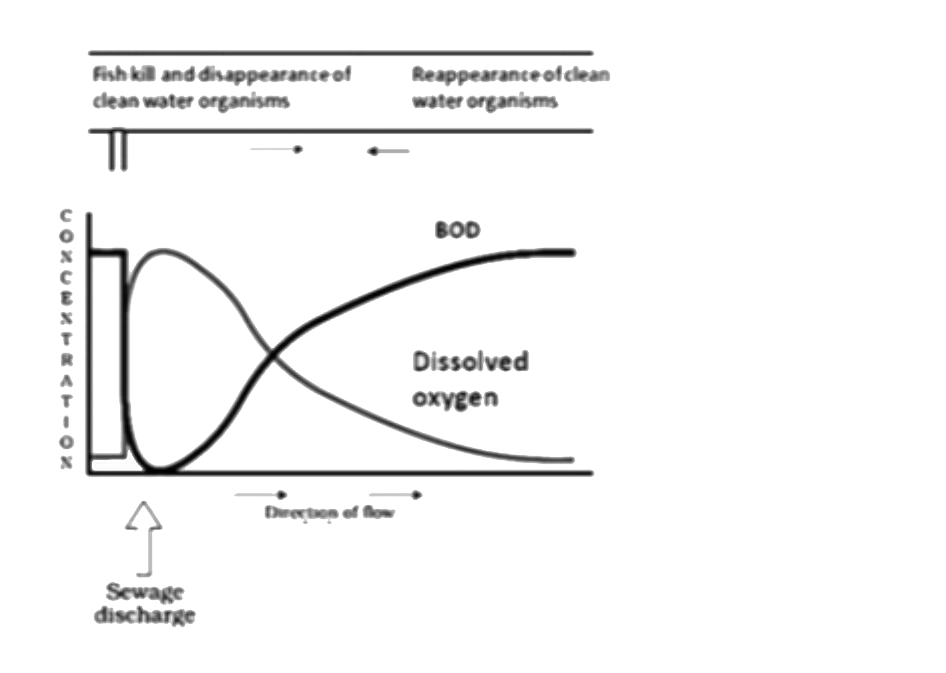 D
D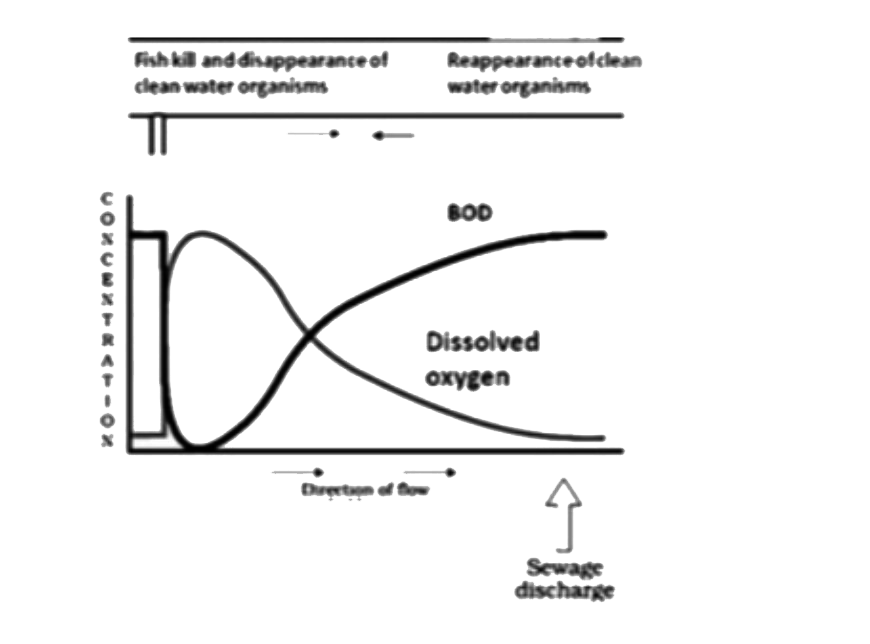
Select the correct option that represents the given Venn diagram.

View SolutionThe given graph depicts the depicts the efect of sewage discharge on some important characteristics of a river. Select the correct label for A,B,C and D
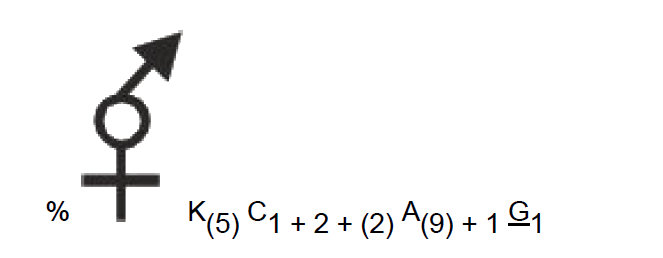
View SolutionSelect the correct option with respect to given floral formula
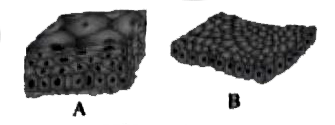
View SolutionIdentify the correct option with respect to the figures (A & B) given below.
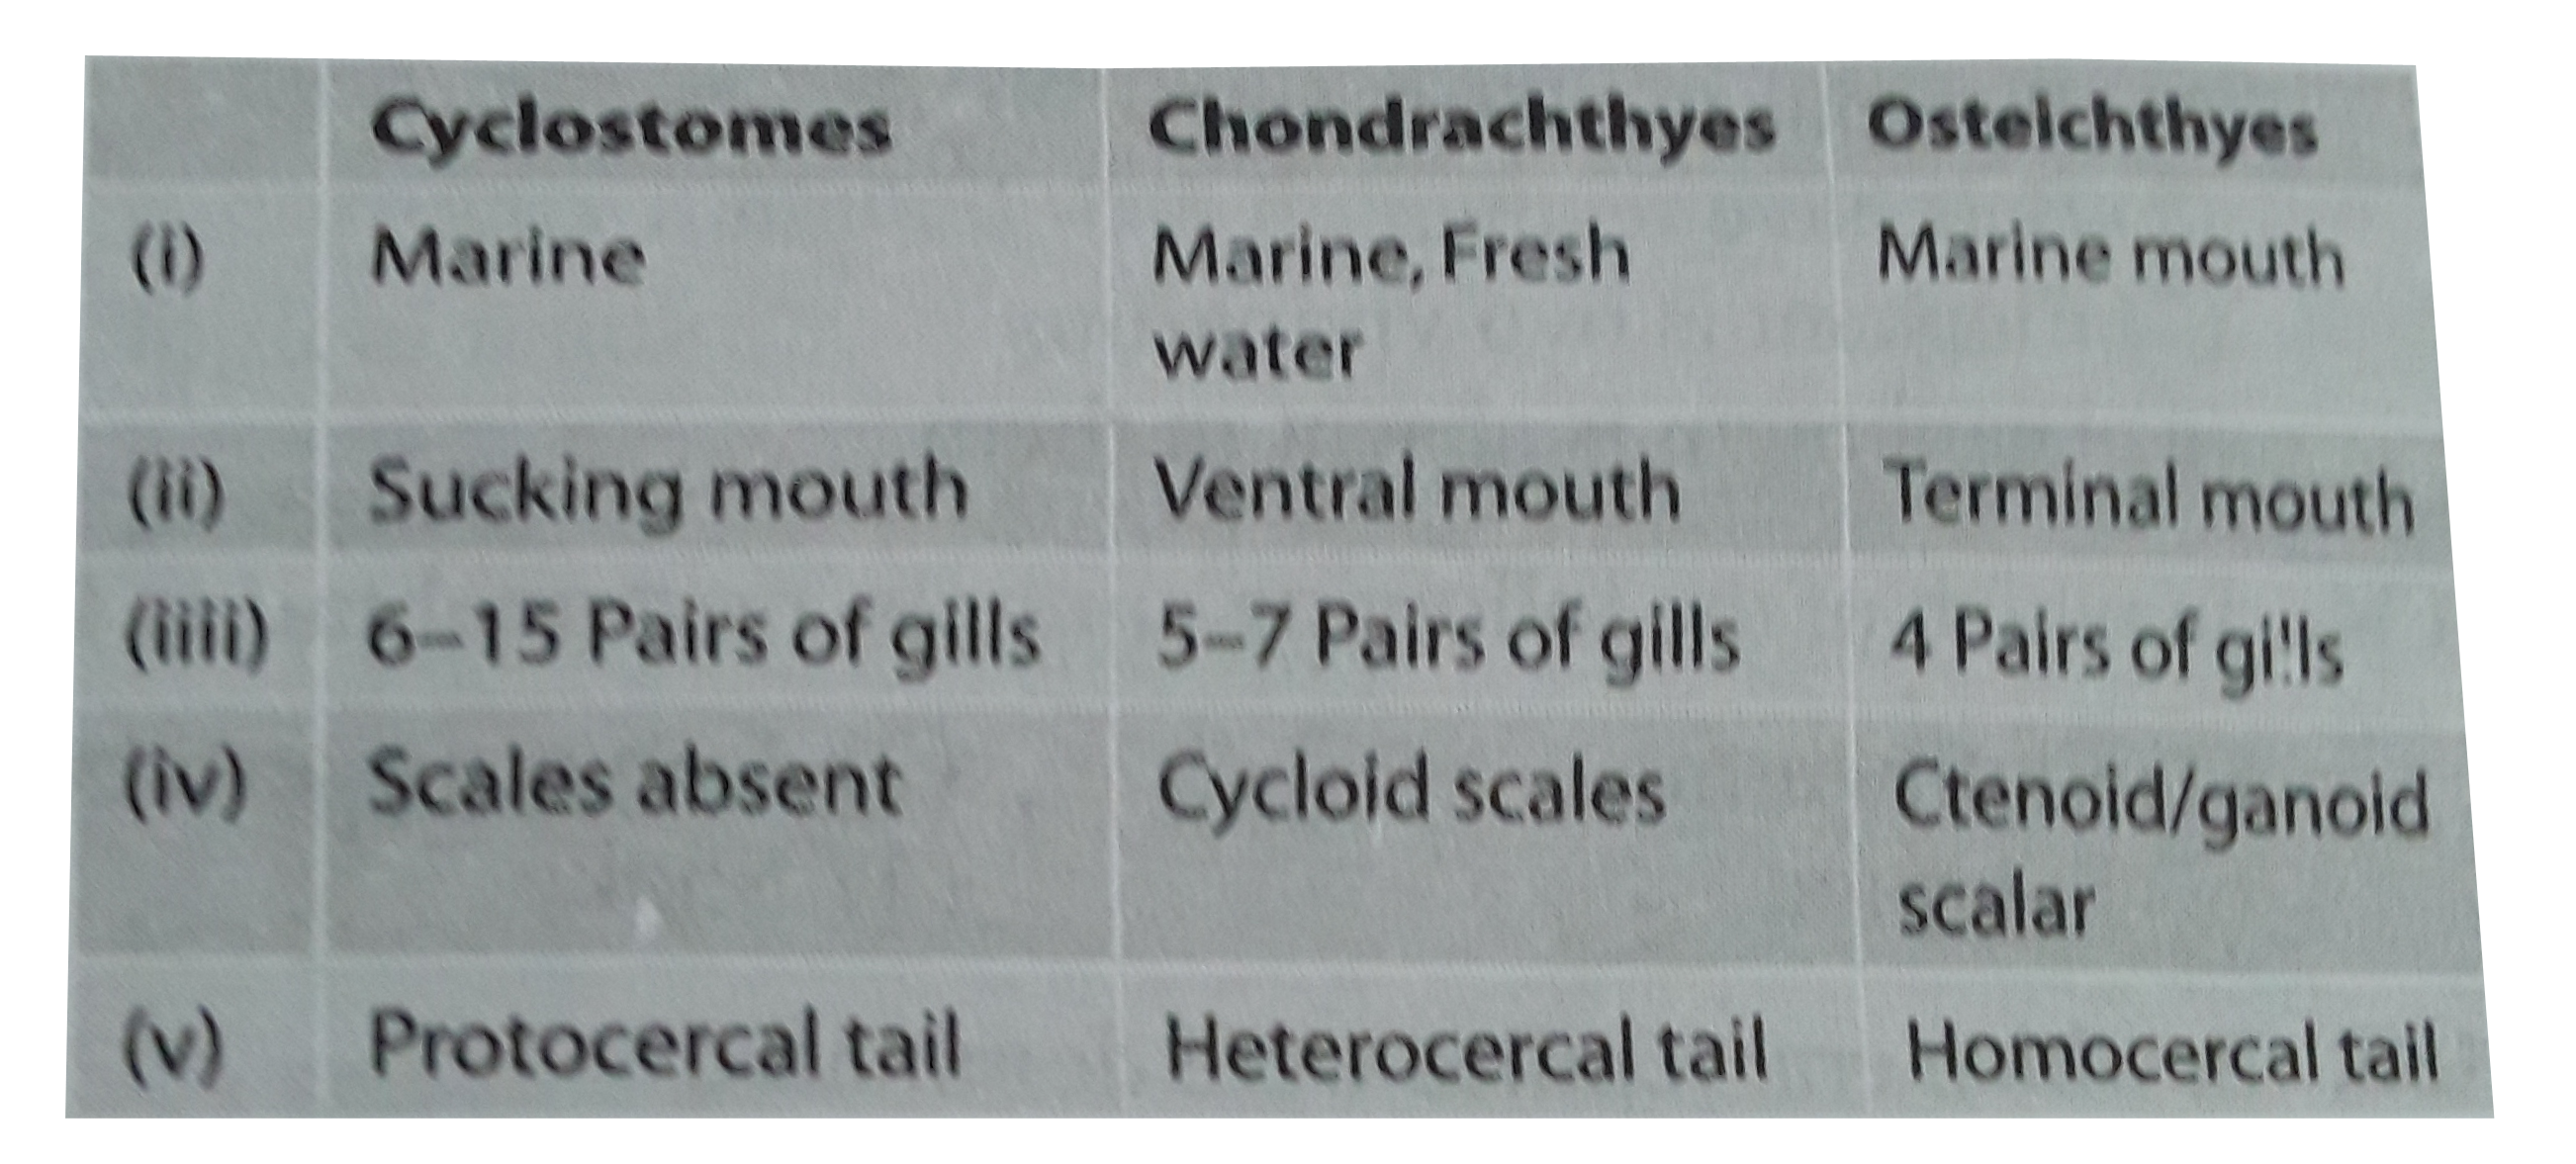
View SolutionSelect the correct option in respect of characteristics of each group :
View Solution


