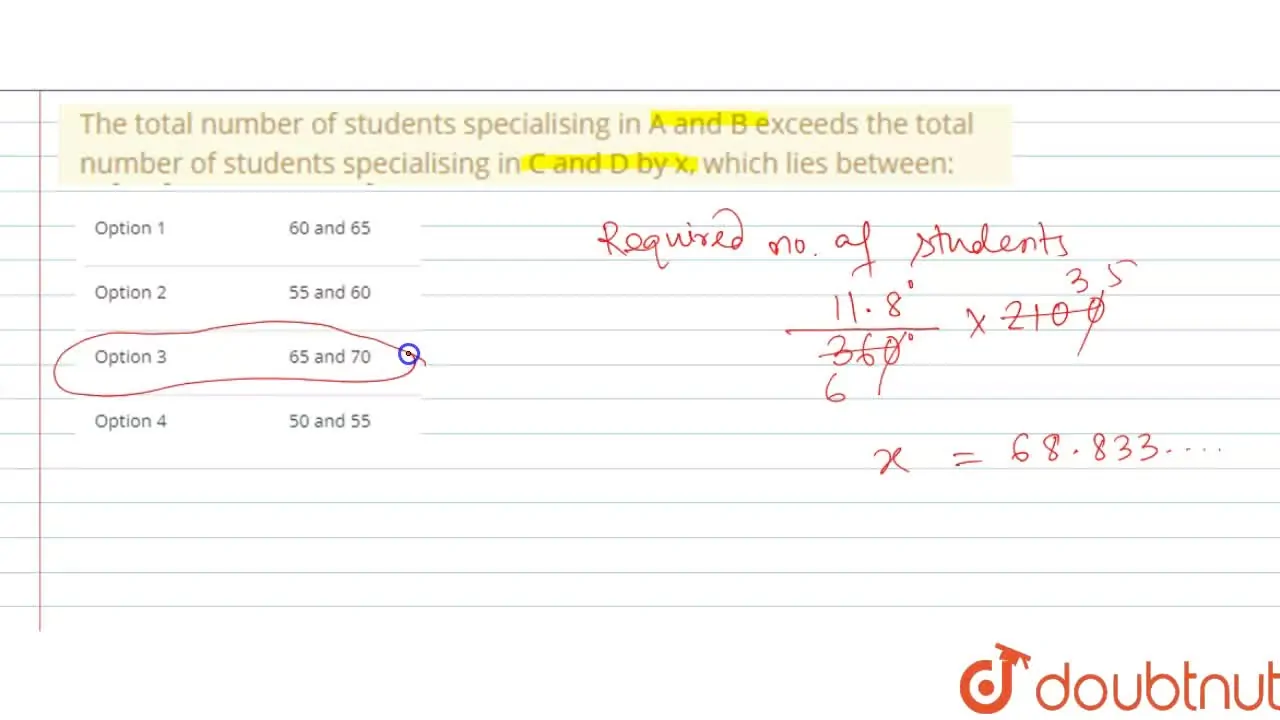
Study the pie-chart and answer the questions:
Break up (degree wise) of students in terms of specialization in different areas(A, B, C, D & E) in an MBA program.
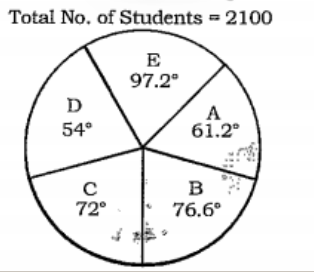
The total number of students specialising in A and B exceeds the total number of students specialising in C and D by x, which lies between:
पाई-चार्ट का अध्ययन करें और प्रश्नों के उत्तर दें: एमबीए प्रोग्राम में विभिन्न क्षेत्रों (ए, बी, सी, डी एंड ई) में विशेषज्ञता के मामले में छात्रों का ब्रेक अप (डिग्री वार)। <

ए और बी में विशेषज्ञता वाले छात्रों की कुल संख्या सी और डी में विशेषज्ञता वाले छात्रों की कुल संख्या से अधिक है।
60 and 65
55 and 60
65 and 70
50 and 55
Step by step video & image solution for Study the pie-chart and answer the questions:Break up (degree wise) of students in terms of specialization in different areas(A, B, C, D & E) in an MBA program. The total number of students specialising in A and B exceeds the total number of students specialising in C and D by x, which lies between: पाई-चार्ट का अध्ययन करें और प्रश्नों के उत्तर दें: एमबीए प्रोग्राम में विभिन्न क्षेत्रों (ए, बी, सी, डी एंड ई) में विशेषज्ञता के मामले में छात्रों का ब्रेक अप (डिग्री वार)। < ए और बी में विशेषज्ञता वाले छात्रों की कुल संख्या सी और डी में विशेषज्ञता वाले छात्रों की कुल संख्या से अधिक है। by Maths experts to help you in doubts & scoring excellent marks in Class 14 exams.
Related Playlists
Similar Questions
Study the pie-chart and answer the questions:
Break up (degree wise) of students in terms of specialization in different areas(A, B, C, D & E) in an MBA program.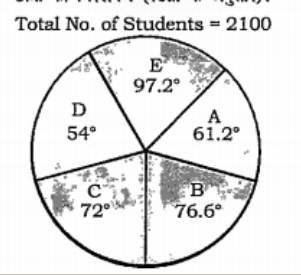
The number of students specialising in E is what percent more than that of students specialising in C?
पाई-चार्ट का अध्ययन करें और प्रश्नों के उत्तर दें: एमबीए प्रोग्राम में विभिन्न क्षेत्रों (ए, बी, सी, डी एंड ई) में विशेषज्ञता के मामले में छात्रों का ब्रेक अप (डिग्री वार)।

E में विशेषज्ञता प्राप्त छात्रों की संख्या C में विशेषज्ञता वाले छात्रों से कितने प्रतिशत अधिक है?View SolutionStudy the given pie chart and answer the question that follows.
Break-up (degree-wise) of the number of students in five schools (A, B, C, D and E) in a city.
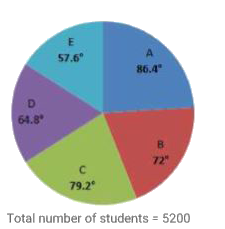
If the total number of students in schools D and E exceeds the number of students in school A by x, then x lies between:View SolutionStudy the pie-chart and answer the question.
Distribution (degree wise ) of the total number of employeesofa company in its five offices A,B,C,D&E.
Total Number of employees = 9200
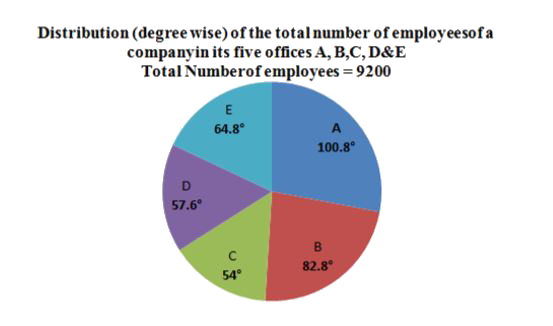
Total number of employees of the company in offices C and D exceeds the number of employees in office B by x, where X lies between:View SolutionStudy the given pie chart and ansewr the question that follows .
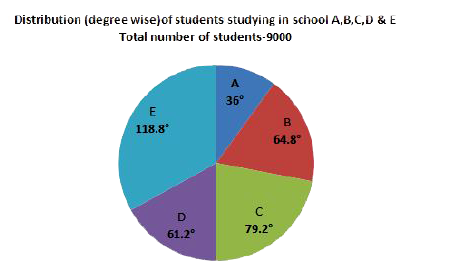
The number of students in school E exceeds the total number of students in schools A and B by x, where x lies between :View SolutionStudy the given pie chart and answer the question that follows
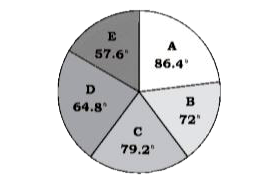
If the total number of students in schools D and E exceeds the number of students in school by x, then x lies betweenView SolutionStudy the pie chart and answer the question. Distribution of the number of employees of a companyworking in 5 department A, B , C, D and E
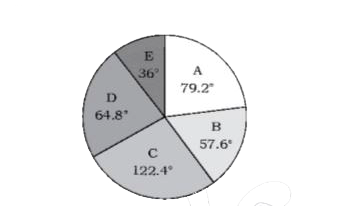
IF the total number of employees are 3200.If the total number of employees working in deparments A and B exceeds the number of employees in department C by x, then x lies between:View SolutionStudy the below table and answer the question.
The number of students enrolled for a Vocational Course (VC) in Institutes A, B, C, D and E during 6 years:

The total number of students enrolled in VC in Institutes C,D and E in 2017 exceeds the total number of students enrolled in Institute B in 2015, 2017 and 2019 by x, where x lines between :View SolutionStudy the given pie chart and answer the question that follows.
Break-up of the students studying in schools A,B,C,D and E managed by a society, in 2019
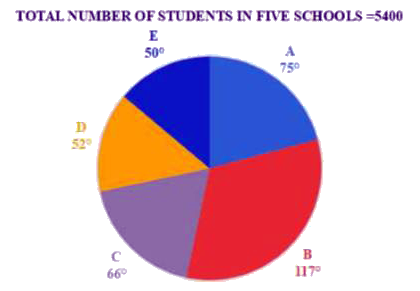
The average number of students in schools A,B and C is what percentage more than the number of students in school E ?View SolutionStudy the given graph and answer the question that follows: Breakup for distribution (degree wise) of the employees working in five departments (A,B,C,D, and E) in a company The total numbers of employees working in departments A and C exceeds the total number of employees working in departments B and D by x. The value of x lies between:
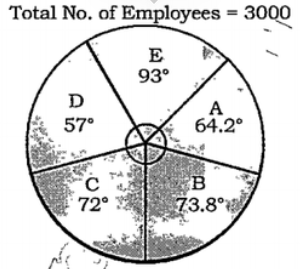
दिए गए ग्राफ का अध्ययन करें और नीचे दिए गए प्रश्न का उत्तर दें। विभाग A और C में कार्य करने वाले कर्मचारियों की कुल संख्या, विभाग B और D में कार्य करने वाले कर्मचारियों की कुल संख्या से अधिक है। x का मान किसके बीच होगा?View Solution
Study the pie chart and answer the question that follows
आरेख का अध्ययन करें और प्रश्न का उत्तर दे।
Break up (degree wise) of students in terms of specialization in different areas (A,B,C,D&E) in MBA program.
MBA कार्यक्रम में विभिन्न क्षेत्रों (A, B, C, D और E) में विशेषज्ञता के संदर्भ में छात्रों का वितरण
The number of students specialising in E is what percent more than that of students specialising in C?
E में विशेषज्ञता प्राप्त छात्रों की संख्या, C में विशेषज्ञता प्राप्त छात्रों की संख्या की तुलना में कितना प्रतिशत अधिक है?View Solution

