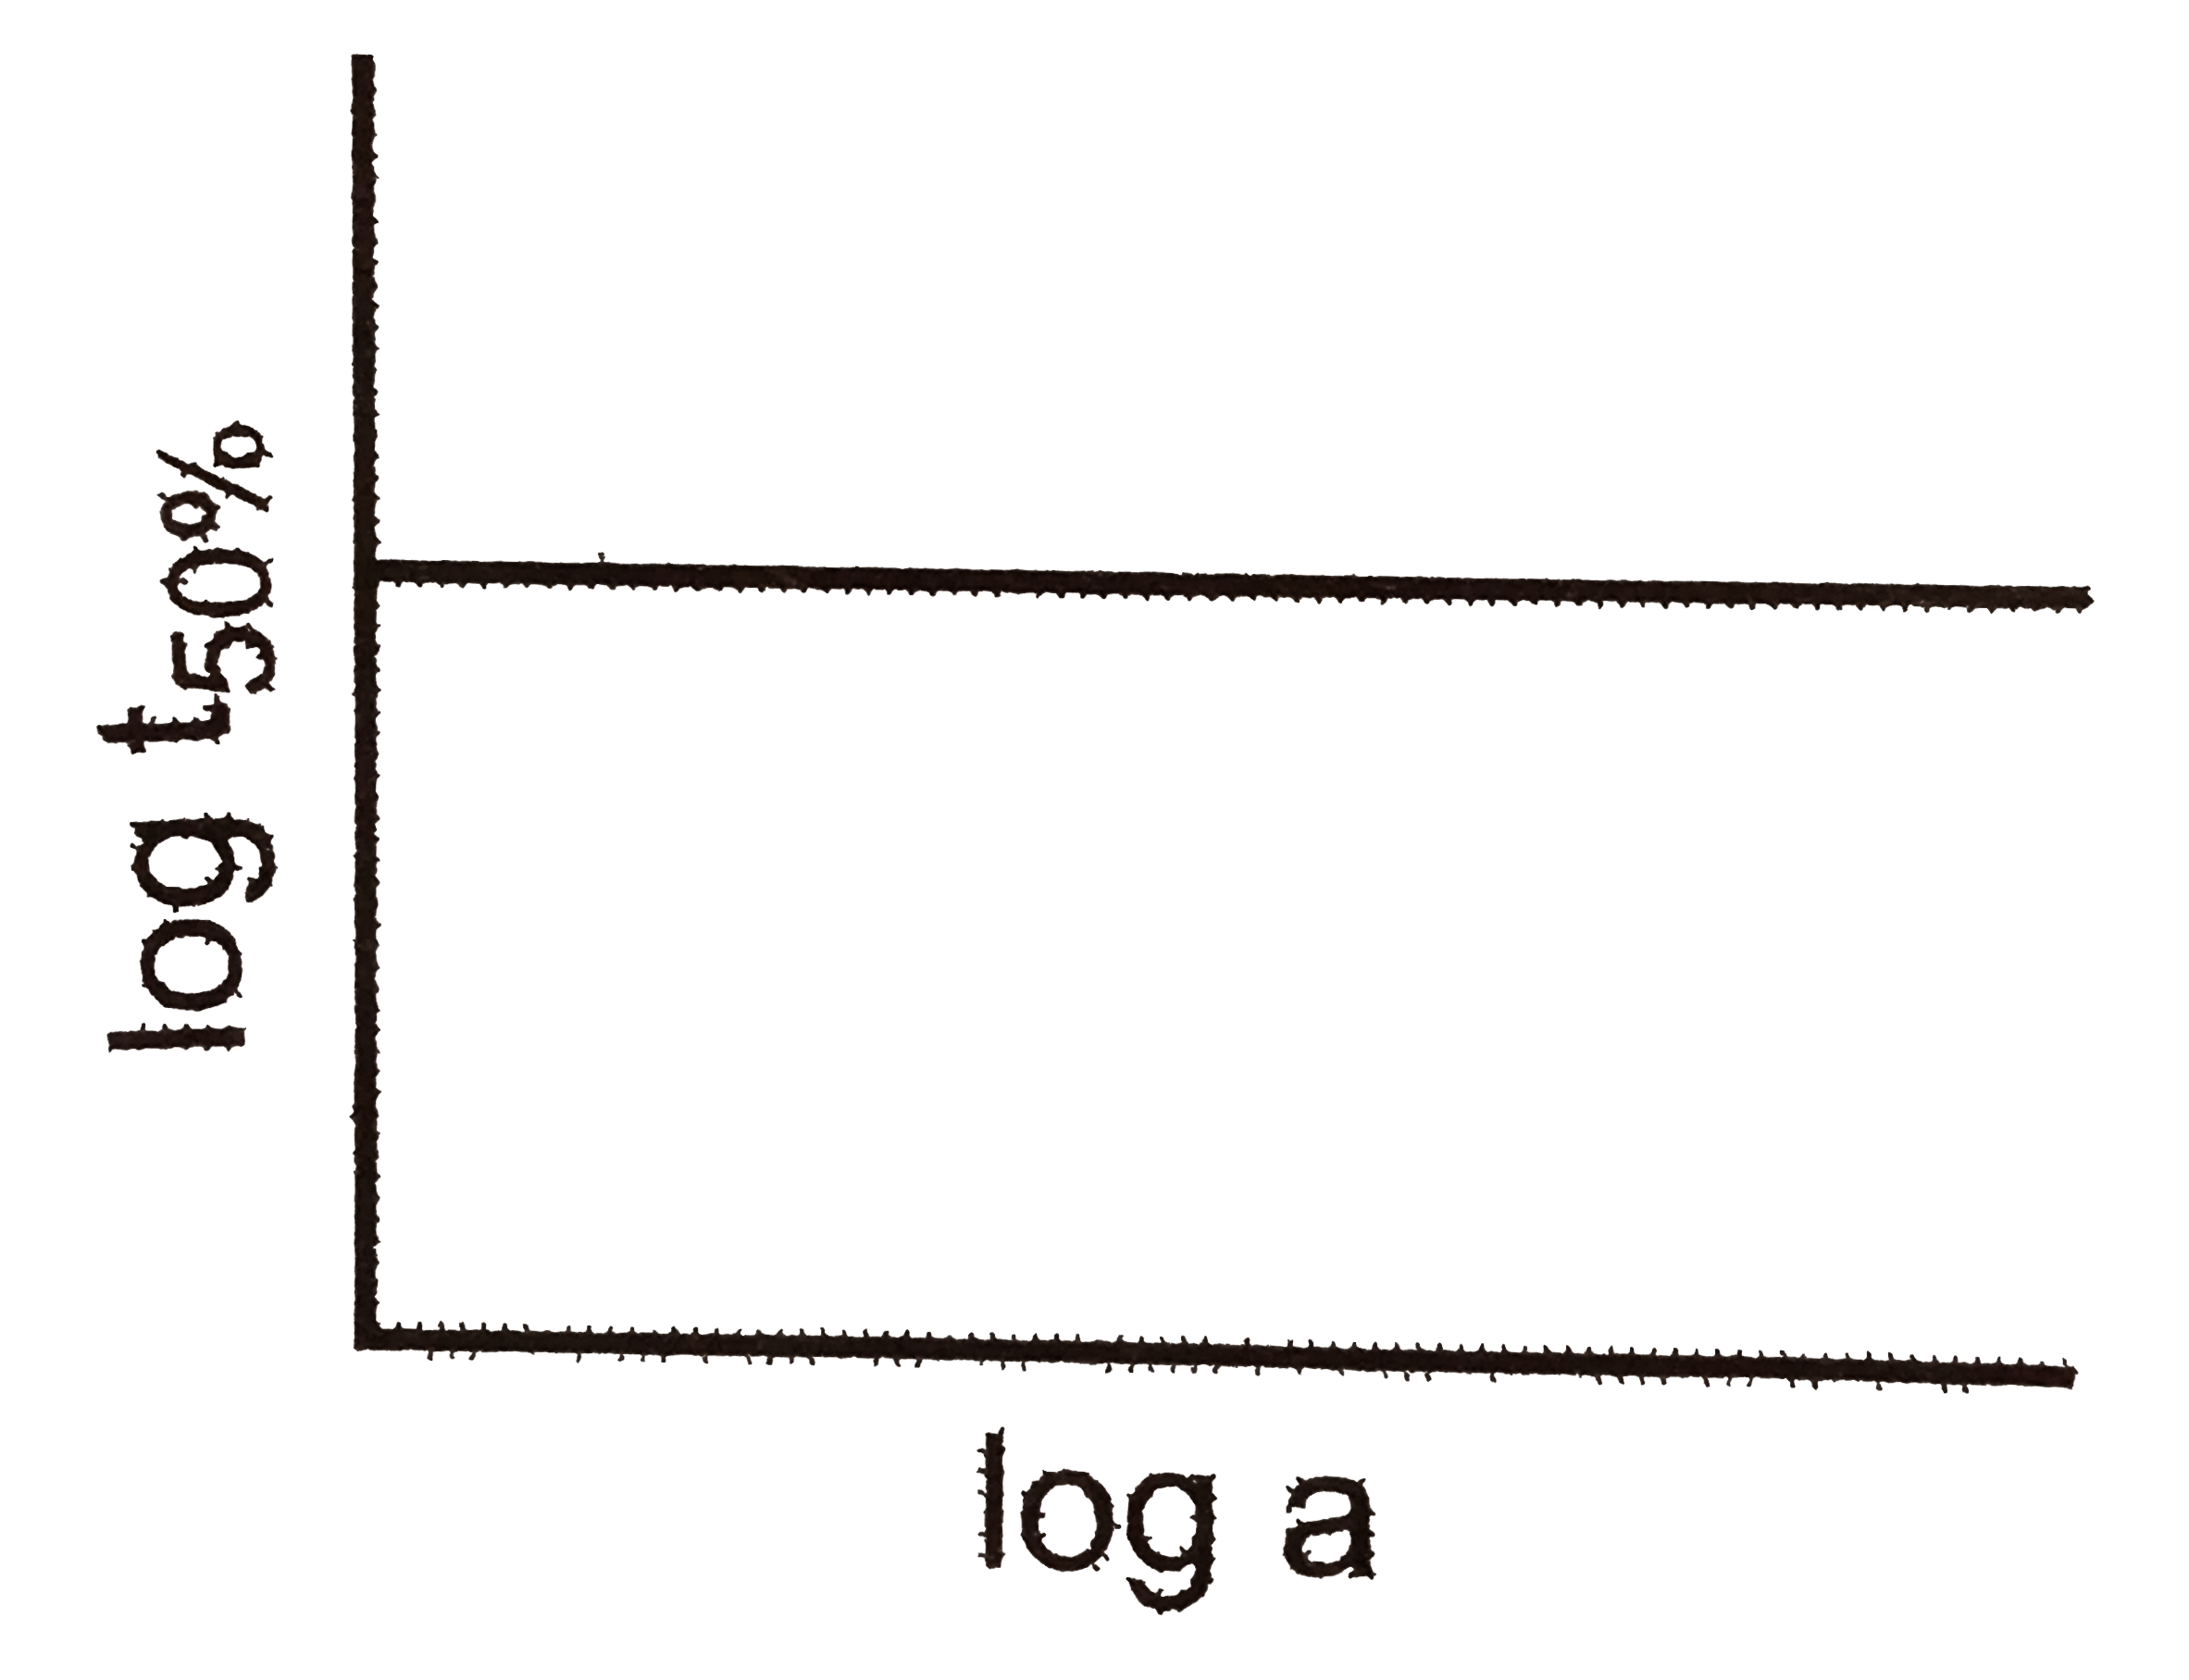
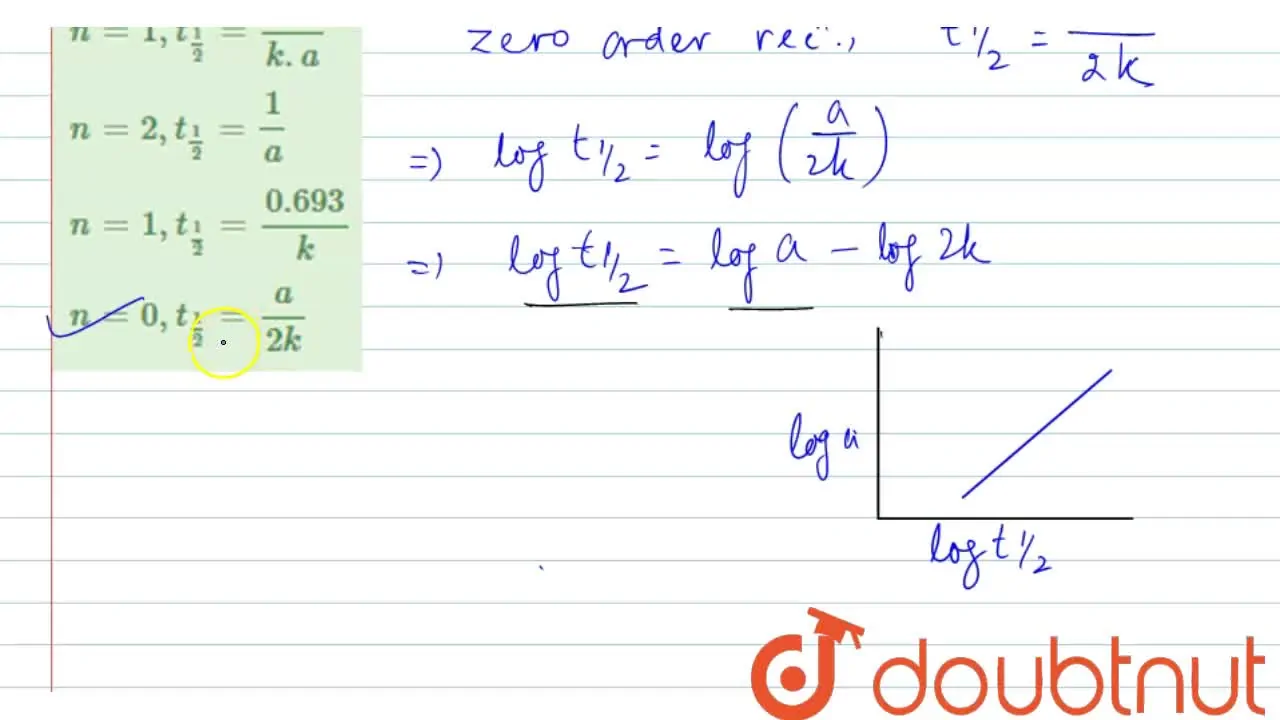
A graph plotted between logt12 vs log concentration is a straight line. What is your conclusion?
[Given : n = order of reaction]
n=1,t12=1k.a
n=2,t12=1a
n=1,t12=0.693k
n=0,t12=a2k
The correct Answer is:C
Step by step video & image solution for A graph plotted between log t_((1)/(2)) vs log concentration is a straight line. What is your conclusion? [Given : n = order of reaction] by Chemistry experts to help you in doubts & scoring excellent marks in Class 12 exams.
Similar Questions
A graph plotted between log t50% vs log concentration is a straight line. What conclusion can you draw from this graph?
 View Solution
For a lst order reaction , a straight line is obtained if you plot
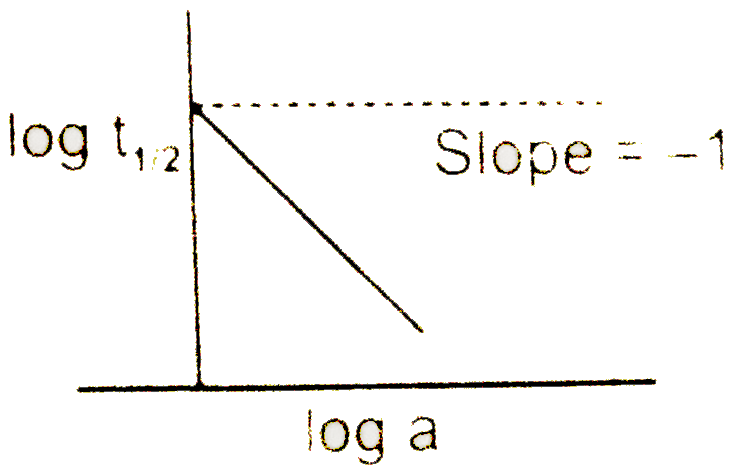
View SolutionFollowing is the graph between logt1/2 and loga (a initial concentration) for a given reaction at 300K

Find the order of reaction.View SolutionA graph plotted between logk versus 1/T for calculating activation energy is shown by
View SolutionA graph between logt12 and log a (abscissa), a being the initial concentration of A in the reaction For reaction A→Product, the rate law is :
 View Solution
A graph between logt12 and log a (abscissa), a being the initial concentration of A in the reaction For reaction A→Product, the rate law is :
 View Solution
The graph between logk versus 1/T is a straight line.
View SolutionIf t1/2vs1a2 is a straight line graph then determine the order of reaction.
View SolutionAt constant temperature if a graph plotted between logP and log(1V) has an intercept of unity then what will be the value of constant (k)
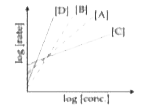
View SolutionConsider the following reaction
A→P1,B→P2,C→P3,D→P4,
The order of the above reaction are a,b,c and d, respectively . The following graph is obtained when log [rate ] vs. log [conc.] are plotted :

Among the following the correct sequence for the order of the reaction is :View Solution


