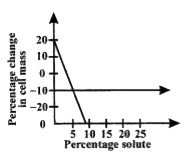
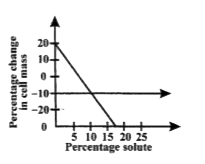
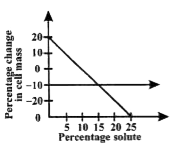
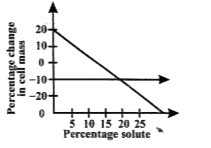
The effect of solute concentration of the mass of tissue cells is studied.It is observed from the collected data that the tissue cells were isotonic to 10 % solute concentration Which of the following graph represents that the cells are isotonic 10 % solute concentrations


The correct Answer is:B
Step by step video, text & image solution for The effect of solute concentration of the mass of tissue cells is studied.It is observed from the collected data that the tissue cells were isotonic to 10 % solute concentration Which of the following graph represents that the cells are isotonic 10 % solute concentrations by Biology experts to help you in doubts & scoring excellent marks in Class 12 exams.
Updated on:21/07/2023Similar Questions
Knowledge Check
The effect of solute concentration of the mass of tissue cells is studied.It is observed from the collected data that the tissue cells were isotonic to 10 % solute concentration Which of the following graph represents that the cells are isotonic 10 % solute concentrations
A B
B C
C D
D
If the solute concentration is increased inside the cell
AThe Ψs is lowered, and thus the Ψw is increasedBThe Ψs is increased, and thus the Ψwis decreasedCThe Ψs is lowered, and thus the Ψwis decreasedDThe Ψs is increased, and thus the Ψw is increasedA cell has a solute concentration of 0.09%. Which of the following solute concentrations will the cause the cell to burst ?
A0.02% soluteB0.09% soluteC0.1% soluteD0.5% solute
The external solution having more concentration then the cell sap is called
View SolutionTo initiate cell plasmolysis, the solution concentration must be :
View SolutionThe external solution having less concentration as that the of cell sap is called
View SolutionWhen a cell is placed in a solution whose osmotic concentration is equal to cell sap then ,
View SolutionWhen concentration of solute is low in plant cell, absorpion of water is
View Solution
