Which one of the following graphs show the relationship between the rate of an enzymatic activity and substrate conc(S) -
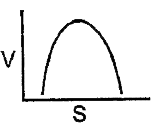
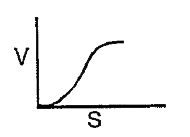
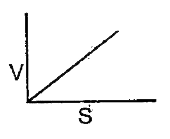
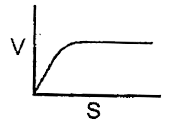
The correct Answer is:D
To determine the correct graph that shows the relationship between the rate of enzymatic activity and substrate concentration, we need to understand the fundamental principles of enzyme kinetics.
1. Understanding Enzyme Kinetics: Enzymes are biological catalysts that speed up chemical reactions. The rate of an enzymatic reaction is influenced by several factors, one of which is the concentration of the substrate.
2. Graph Characteristics: The typical graph that represents the relationship between the rate of enzymatic activity (reaction velocity) and substrate concentration (S) is known as the Michaelis-Menten curve.
3. Michaelis-Menten Model: According to this model:
- At low substrate concentrations, the reaction rate increases linearly with an increase in substrate concentration.
- As substrate concentration increases, the rate of reaction approaches a maximum velocity (Vmax) where all enzyme active sites are saturated.
- Eventually, the graph levels off, indicating that adding more substrate does not increase the reaction rate.
4. Identifying the Correct Graph: Look for a graph that starts with a steep incline (indicating increased reaction rate with increased substrate concentration), then gradually levels off as it approaches a maximum rate (Vmax).
5. Conclusion: Among the options provided, the graph that matches the description of the Michaelis-Menten relationship will be the correct answer.
- At low substrate concentrations, the reaction rate increases linearly with an increase in substrate concentration.
- As substrate concentration increases, the rate of reaction approaches a maximum velocity (Vmax) where all enzyme active sites are saturated.
- Eventually, the graph levels off, indicating that adding more substrate does not increase the reaction rate.
Similar Questions
Knowledge Check
- Question 1 - Select One
Which of the following graphs shows the relationship between the rate of an enzymatic activity and substrate concentration (S) ?
A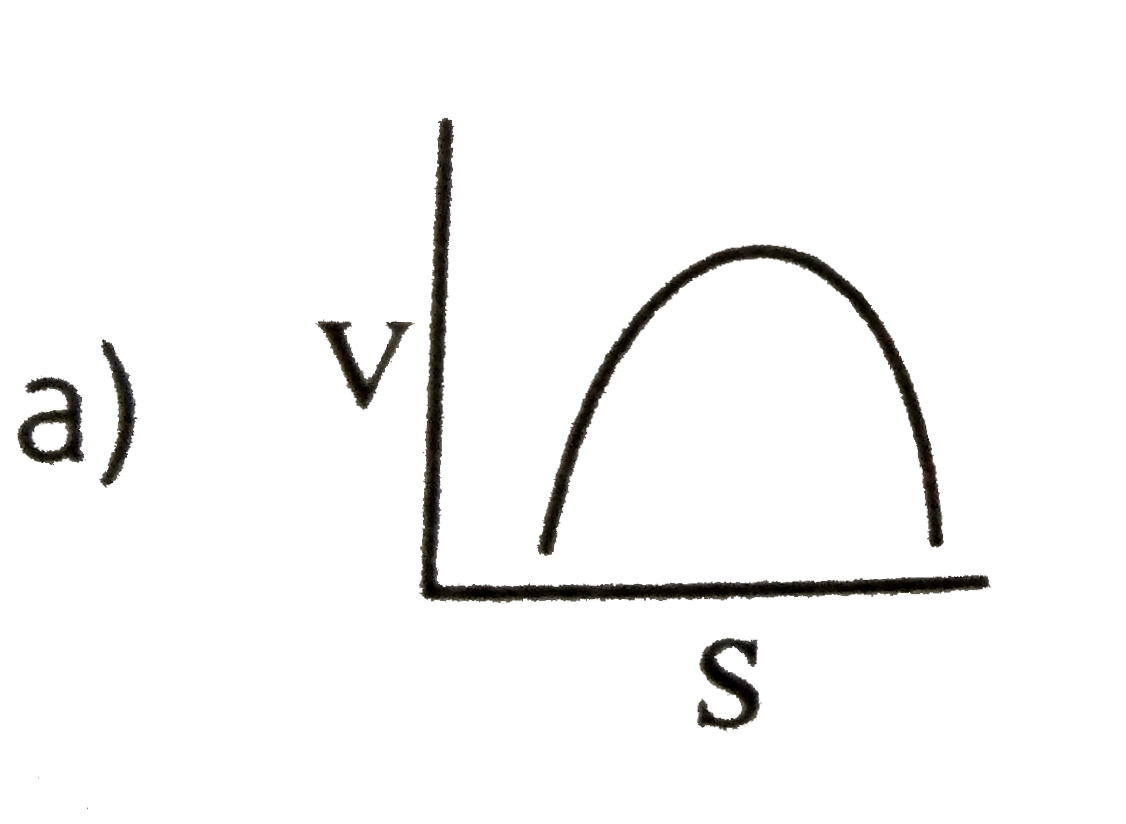 B
B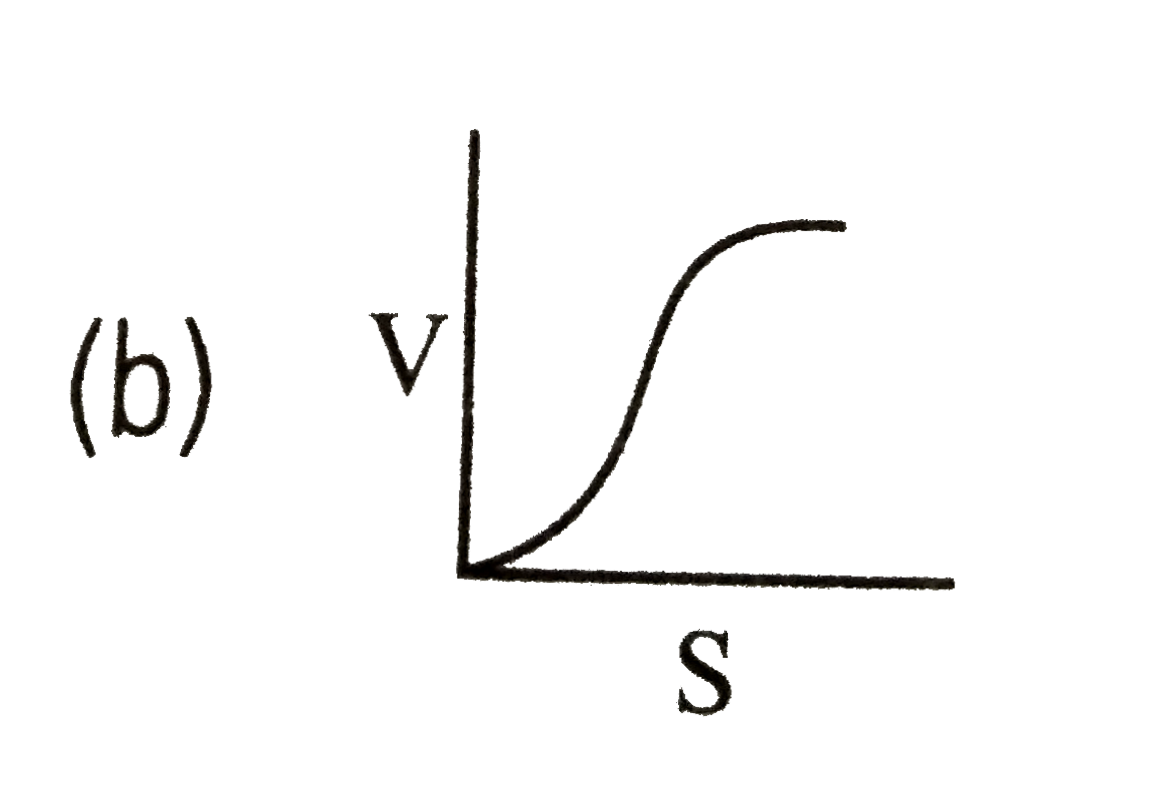 C
C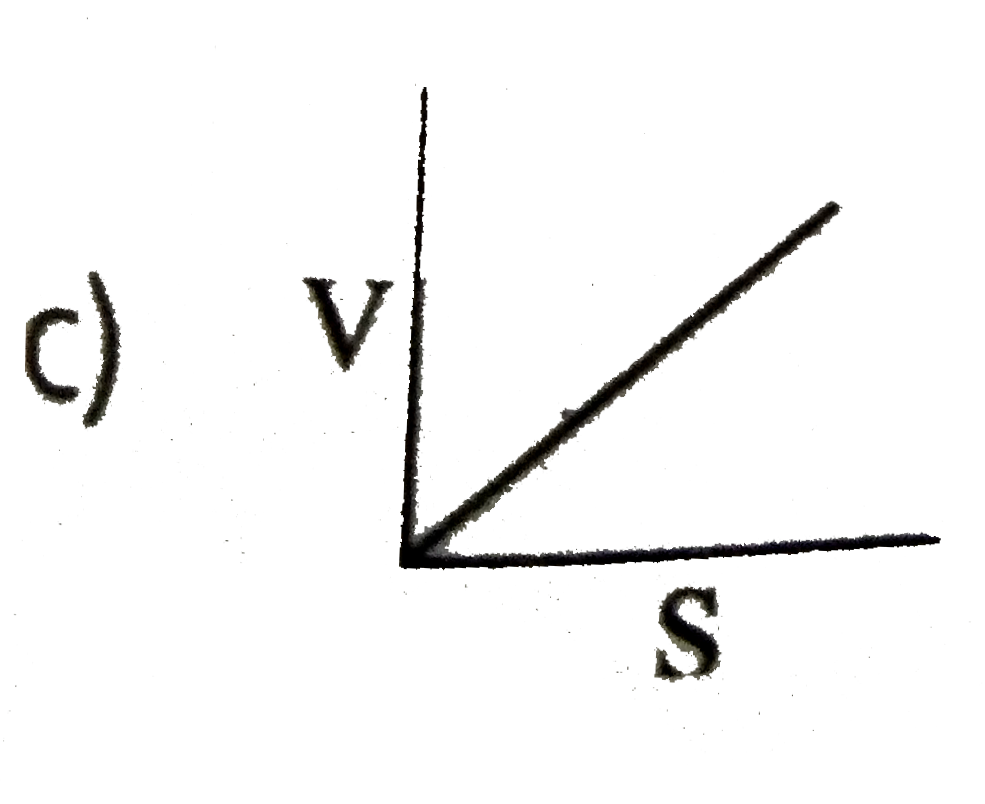 D
D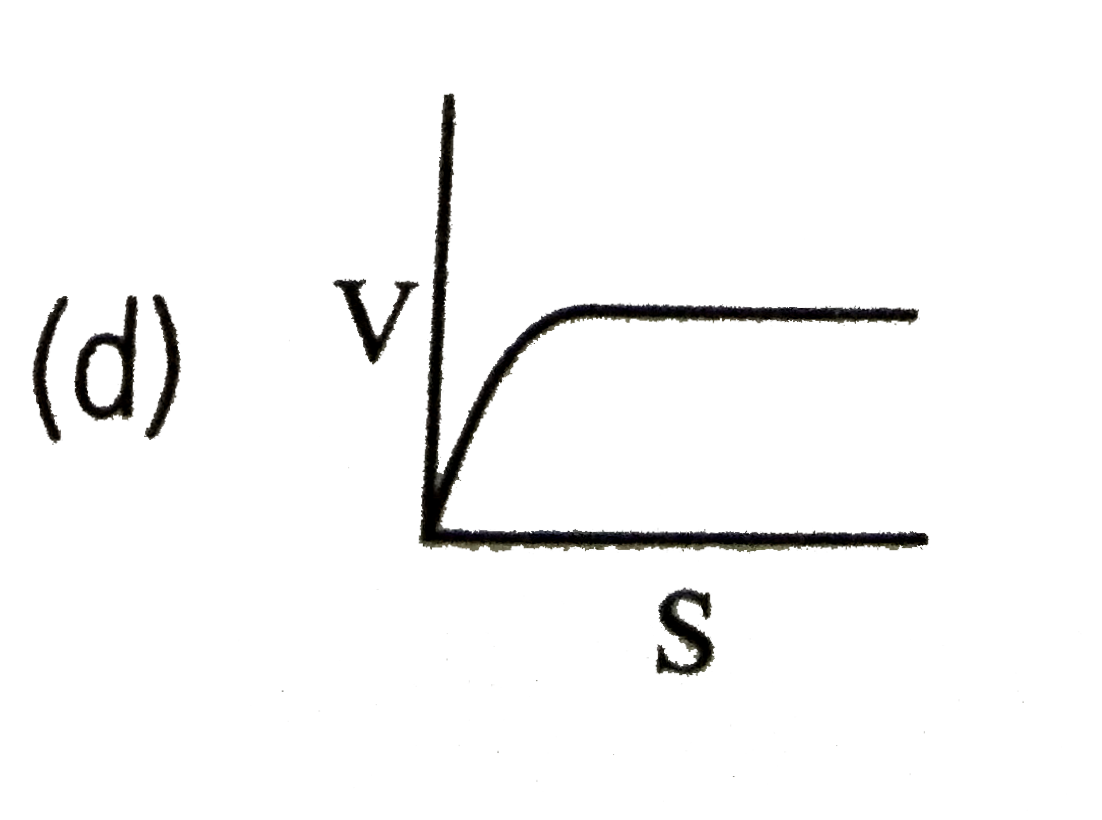
- Question 2 - Select One
Which of the following graphs shows the relationship between the rate of an enzymatic activity and substrate concentration (S) ?
A B
B C
C D
D
- Question 3 - Select One
Which of the following pairs show diagonal relationship?
AB,AlBLi,NaCC,SiDB,Si
Which one of the following is a correct relationship between mass and energy?
View SolutionWhich one of the following is a correct relationship between mass and energy?
View SolutionWhich one of the following is a correct relationship between mass and energy?
View SolutionWhich one of the following is a correct relationship between mass and energy?
View SolutionWhich of the following shows diagonal relationship ?
View Solution
