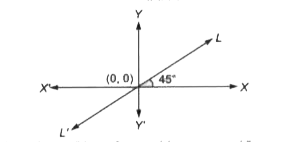
चित्र में खींची गई रेखा L का समीकरण है

x = 0
y = 0
x = y
y = -x
The correct Answer is:C
Step by step video, text & image solution for चित्र में खींची गई रेखा L का समीकरण है by Maths experts to help you in doubts & scoring excellent marks in Class 12 exams.
Updated on:21/07/2023Topper's Solved these Questions
Similar Questions
दो समान्तर रेखाओं 3x−5y+7=0 और 6x−10y−5=0 के बीच की दूरी है
View Solutionसम्मिश्र संख्या z=(1+i√3)24i(1−i√3) का कोणांक है
View Solution25×63÷7+27−2 का मान क्या होगा ?
View SolutionHow many lines of symmetry does the above figure have ?
View SolutionWhich of the following are correct chain isomers of butane ? (i)
View SolutionDetermine the point of symmetry of a regular hexagon.
View SolutionDtermine the images of the following figure about the given line :
View SolutionMatch the following Column A to Column B

View SolutionMatch the following Column A to Column B

View SolutionMatch the following Column A to Column B

View SolutionFind the area of the figure given below.

View SolutionThe area of the shaded part in the figure given below is ______.

View SolutionThe inequation represented by the graph given below is :
View SolutionThe inequation that best describes the graph given below is _________
View SolutionThe inequation that best describes the following graph is _________
View SolutionWhich inequations represent the shaded region in the given figure
View Solution
