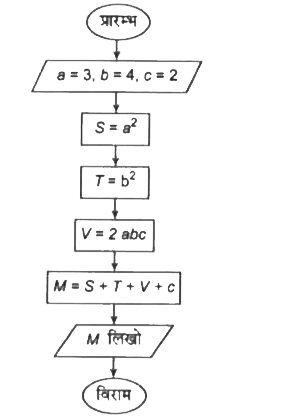
उपरोक्त प्रवाह चित्र में M का मान है
51
55
65
75
The correct Answer is:D
Step by step video, text & image solution for <bR> उपरोक्त प्रवाह चित्र में M का मान है by Maths experts to help you in doubts & scoring excellent marks in Class 12 exams.
Updated on:21/07/2023Topper's Solved these Questions
- अभिकलन Book:ARIHANT PUBLICATION MPChapter:अभिकलन Exercise:वस्तुनिस्ट प्रश्न
Explore 11 Videos
- अनुपात एवं समानुपातBook:ARIHANT PUBLICATION MPChapter:अनुपात एवं समानुपातExercise:वस्तुनिष्ठ प्रश्न
Explore 40 Videos
- आयतन तथा पृष्ठीय क्षेत्रफल Book:ARIHANT PUBLICATION MPChapter:आयतन तथा पृष्ठीय क्षेत्रफल Exercise:वस्तुनिष्ठ प्रश्न
Explore 55 Videos
Similar Questions
प्रवाह आलेख
View Solutionयदि a:b=29:13,b:c=27:514 तथा c:d=35:710 हो, तो a:b:c:d=?
View Solutionयदि एक तालाब की लम्बाई तथा चौड़ाई क्रमशः 5 मी तथा 6 मी हो तथा उसमें 210 घन मीटर पानी आता है, तो उसकी गहराई होगी
View SolutionHow many lines of symmetry does the above figure have ?
View SolutionWhich of the following are correct chain isomers of butane ? (i)
View SolutionDetermine the point of symmetry of a regular hexagon.
View SolutionDtermine the images of the following figure about the given line :
View SolutionMatch the following Column A to Column B

View SolutionMatch the following Column A to Column B

View SolutionMatch the following Column A to Column B

View SolutionFind the area of the figure given below.

View SolutionThe area of the shaded part in the figure given below is ______.

View SolutionThe inequation represented by the graph given below is :
View SolutionThe inequation that best describes the graph given below is _________
View SolutionThe inequation that best describes the following graph is _________
View SolutionWhich inequations represent the shaded region in the given figure
View Solution