दिए गए चित्र में, यदि DE ∣∣ BC हो तो x का मान ज्ञात करें।

The correct Answer is:x = 11 इकाई
Step by step video, text & image solution for दिए गए चित्र में, यदि DE || BC हो तो x का मान ज्ञात करें। by Maths experts to help you in doubts & scoring excellent marks in Class 10 exams.
Updated on:21/07/2023Topper's Solved these Questions
- त्रिभुज BOOK - KIRAN PUBLICATIONCHAPTER - त्रिभुज EXERCISE - EXERCISE - 6.3
35 Videos
- त्रिभुज BOOK - KIRAN PUBLICATIONCHAPTER - त्रिभुज EXERCISE - EXERCISE - 6.4
17 Videos
- त्रिभुज BOOK - KIRAN PUBLICATIONCHAPTER - त्रिभुज EXERCISE - EXERCISE - 6.1
7 Videos
- त्रिकोणमितीय अनुपात और सर्वसमिकाएँ BOOK - KIRAN PUBLICATIONCHAPTER - त्रिकोणमितीय अनुपात और सर्वसमिकाएँ EXERCISE - Exercise 8.4 (वस्तुनिष्ट प्रश्न)
19 Videos
- दो चर वाले रैखिक समीकरण युग्म BOOK - KIRAN PUBLICATIONCHAPTER - दो चर वाले रैखिक समीकरण युग्म EXERCISE - वस्तुनिष्ट प्रश्न
12 Videos
Similar Questions
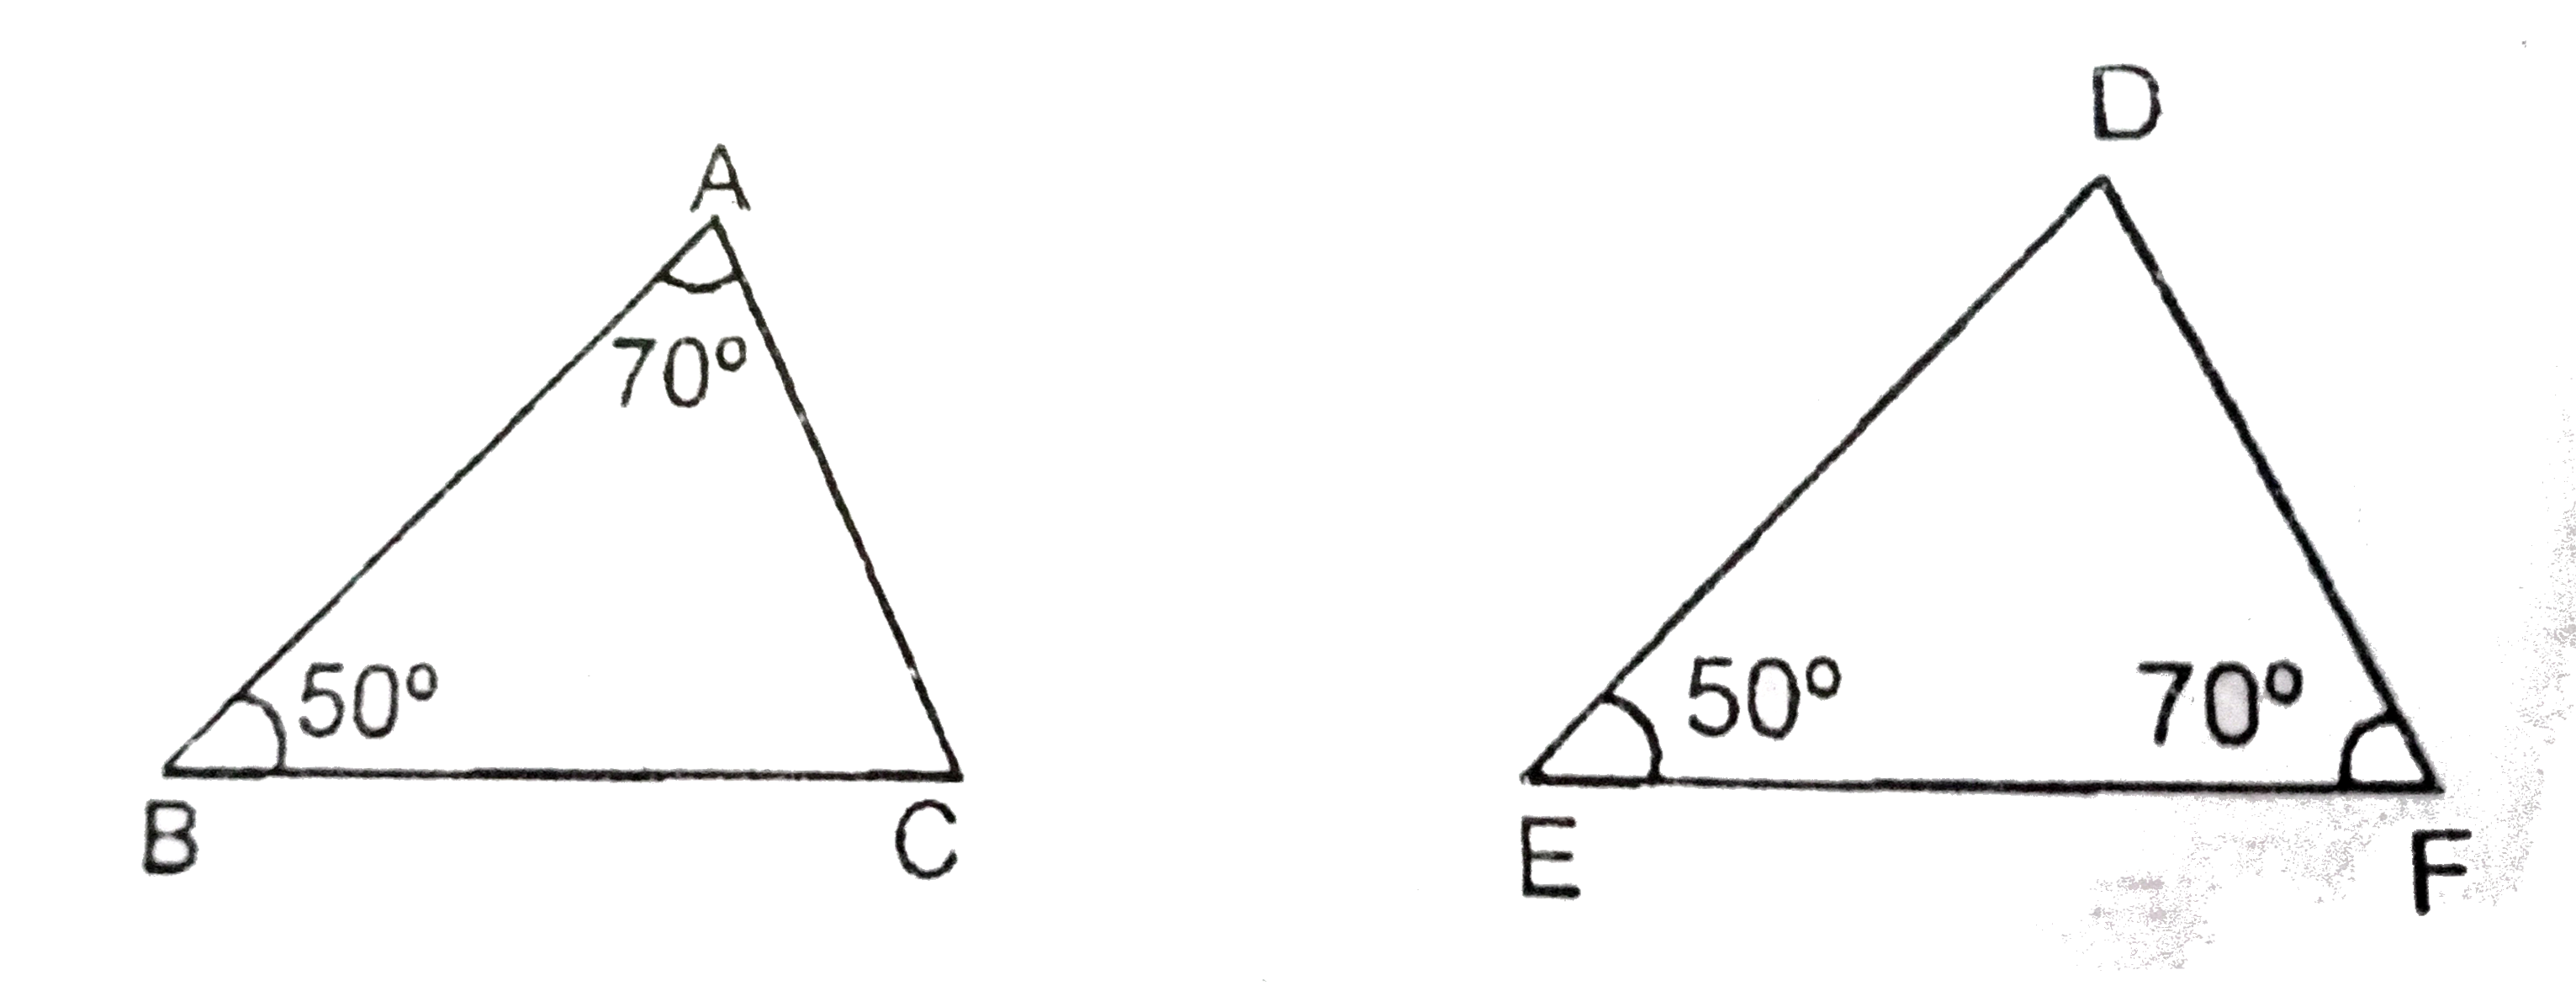
बताइए कि निम्नलिखित त्रिभुज - युग्मों में कौन समरूप है ? प्रयुक्त समरूपता कसौटी को लिखें साथ ही समरूप त्रिभुज - युग्मों का सांकेतिक रूप ( भुजाओं की लम्बाईयाँ cm में हो) में लिखें ।
(i)
View Solutionदो समरूप त्रिभुजों ABC और DEF में AC=3cm और DF=5cm दोनों त्रिभुजों के क्षेत्रफलों का अनुपात ज्ञात कीजिए ।
View Solutionसभी सर्वांगसम आकृतियाँ ........... होती है ।
View Solution9sec2A−9tan2A बराबर है
View Solutionयदि a1a2≠b1b2 तब समीकरण निकाय a1x+b1y+c1=0 और a2x+b2y+c2=0 के कितने हल हैं?
View SolutionHow many lines of symmetry does the above figure have ?
View SolutionWhich of the following are correct chain isomers of butane ? (i)
View SolutionDetermine the point of symmetry of a regular hexagon.
View SolutionDtermine the images of the following figure about the given line :
View SolutionMatch the following Column A to Column B

View SolutionMatch the following Column A to Column B

View SolutionMatch the following Column A to Column B

View SolutionFind the area of the figure given below.

View SolutionThe area of the shaded part in the figure given below is ______.

View SolutionThe inequation represented by the graph given below is :
View SolutionThe inequation that best describes the graph given below is _________
View Solution
