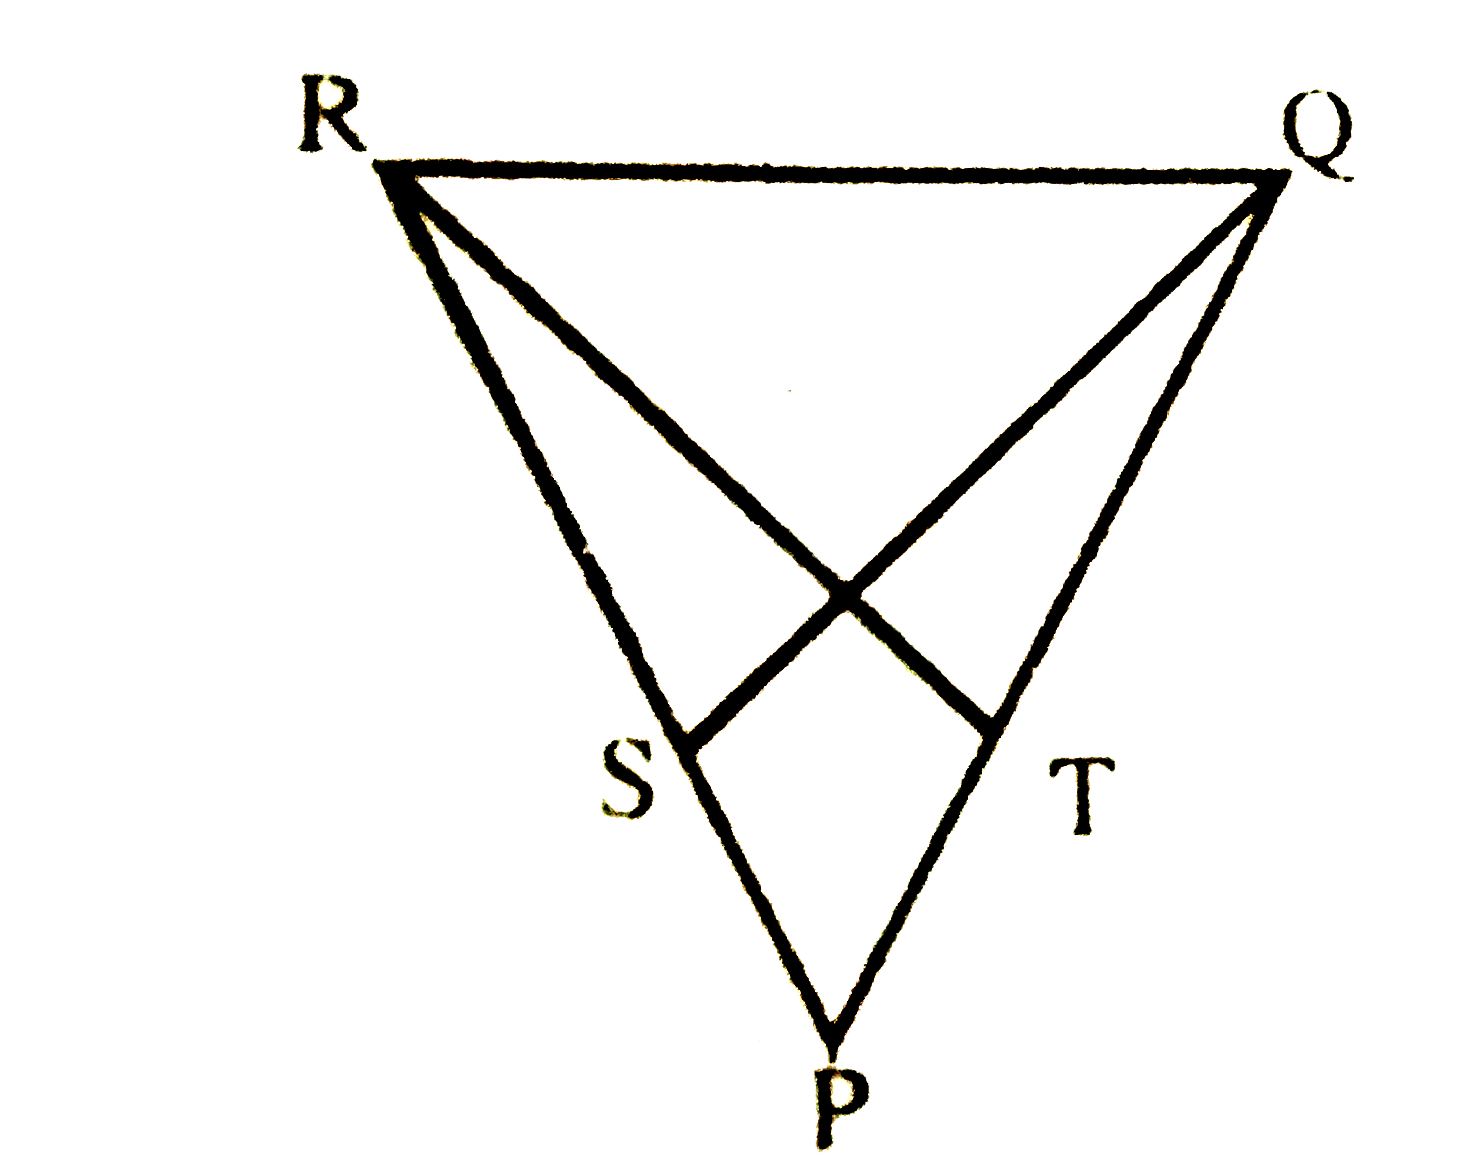
बगल के चित्र में RS = QT और QS = RT. साबित करें कि PQ = PR.

The correct Answer is:∠QRS=∠RQT
Step by step video, text & image solution for बगल के चित्र में RS = QT और QS = RT. साबित करें कि PQ = PR. by Maths experts to help you in doubts & scoring excellent marks in Class 9 exams.
Updated on:21/07/2023Topper's Solved these Questions
- त्रिभुजों की सर्वांगसमता Book:KIRAN PUBLICATIONChapter:त्रिभुजों की सर्वांगसमता Exercise:Exercise 9.2 (रिक्त स्थानों को भरे-)
Explore 10 Videos
- त्रिभुजों की सर्वांगसमता Book:KIRAN PUBLICATIONChapter:त्रिभुजों की सर्वांगसमता Exercise:Exercise 9.2 (सत्य या असत्य)
Explore 6 Videos
- त्रिभुजों की सर्वांगसमता Book:KIRAN PUBLICATIONChapter:त्रिभुजों की सर्वांगसमता Exercise:Exercise 9.1 (सत्य या असत्य)
Explore 10 Videos
- गोला Book:KIRAN PUBLICATIONChapter:गोला Exercise:Exercise 18.1
Explore 39 Videos
- दो चरों वाले रैखिक समीकरण Book:KIRAN PUBLICATIONChapter:दो चरों वाले रैखिक समीकरण Exercise:EXERCISE-6.1
Explore 56 Videos
Similar Questions
किसी त्रिभुज में दो भुजाओं का अन्तर तीसरी भुजा से ............ होती है।
View Solutionनिम्नलिखित कथनों में सत्य के लिए T तथा असत्य के लिए F लिखें |
एक दी हुई रेखा पर एक बिन्दु से जो इस रेखा पर स्थित नहीं है, खींचे गये सभी रेखाखंडों में लाम्बिक रेखाखंड सबसे छोटा होता है |
View Solutionयदि △PQR≅△CAB तो PQ=CA
View Solutionr त्रिज्या वाले गोले का आयतन निम्नलिखित में कौन-सा होगा?
View Solutionनीचे दिए गए समीकरणों को ax+by+c=30 के रूप में लिखिए और प्रत्येक स्थिति में a, b,cके मान बताइए।
2x+3y=4.37
View SolutionHow many lines of symmetry does the above figure have ?
View SolutionWhich of the following are correct chain isomers of butane ? (i)
View SolutionDetermine the point of symmetry of a regular hexagon.
View SolutionDtermine the images of the following figure about the given line :
View SolutionMatch the following Column A to Column B

View SolutionMatch the following Column A to Column B

View SolutionMatch the following Column A to Column B

View SolutionFind the area of the figure given below.

View SolutionThe area of the shaded part in the figure given below is ______.

View SolutionThe inequation represented by the graph given below is :
View SolutionThe inequation that best describes the graph given below is _________
View Solution