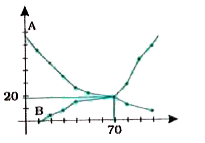
(i) Find the median of the data from the above graph.
(ii) State the type for curve A and curve B.Solution in Gujrati
The correct Answer is:(1) 70 (2) Curve A is more than type cummulative freuquency curve (ogive) and curve B is less than type cummulative frequency curve (ogive).
Step by step video, text & image solution for (i) Find the median of the data from the above graph. (ii) State the type for curve A and curve B. by Maths experts to help you in doubts & scoring excellent marks in Class 10 exams.
Updated on:21/07/2023Topper's Solved these Questions
- QUESTION PAPER-2BOOK - KUMAR PRAKASHANCHAPTER - QUESTION PAPER-2EXERCISE - Section C
14 Videos
- QUESTION PAPER-2BOOK - KUMAR PRAKASHANCHAPTER - QUESTION PAPER-2EXERCISE - Section -A- True & False
3 Videos
- QUESTION PAPER -1BOOK - KUMAR PRAKASHANCHAPTER - QUESTION PAPER -1EXERCISE - SECTION D ( Answer the following as required with calculations)
1 Videos
- REAL NUMBERS BOOK - KUMAR PRAKASHANCHAPTER - REAL NUMBERS EXERCISE - TEST YOUR SKILLS
26 Videos
Similar Questions
On dividing x3−3x2+x+2 by a polynomial g(x)=x2−x+1, then quotient and remainder.
View SolutionThe perpendicular at a point of contact to the tangent to a circle passes through the centre.
View SolutionDraw a line segment of length 6.5 cm and divide it in the ratio 3:4. Measure the two parts and write the steps of construction.
View SolutionShow that the square of any positive integer is of the form 4m or 4m + 1 for some integer m.
View SolutionHow many lines of symmetry does the above figure have ?
View SolutionWhich of the following are correct chain isomers of butane ? (i)
View SolutionDetermine the point of symmetry of a regular hexagon.
View SolutionMatch the following Column A to Column B

View SolutionMatch the following Column A to Column B

View SolutionMatch the following Column A to Column B

View SolutionFind the area of the figure given below.

View SolutionThe inequation represented by the graph given below is :
View SolutionThe inequation that best describes the graph given below is _________
View SolutionThe inequation that best describes the following graph is _________
View SolutionIn Fig, find the value of x.
ltimg src="https://d10lpgp6xz60nq.cloudfront.net/physics_images/PS_MATH_IX_C12_S01_032_Q01.png" width="80%"gt
View SolutionMatch the followings (column I with column II)
ltimg src="https://d10lpgp6xz60nq.cloudfront.net/physics_images/NCERT_BIO_XI_C03_E01_011_Q01.png" width="80%"gt
View Solution
