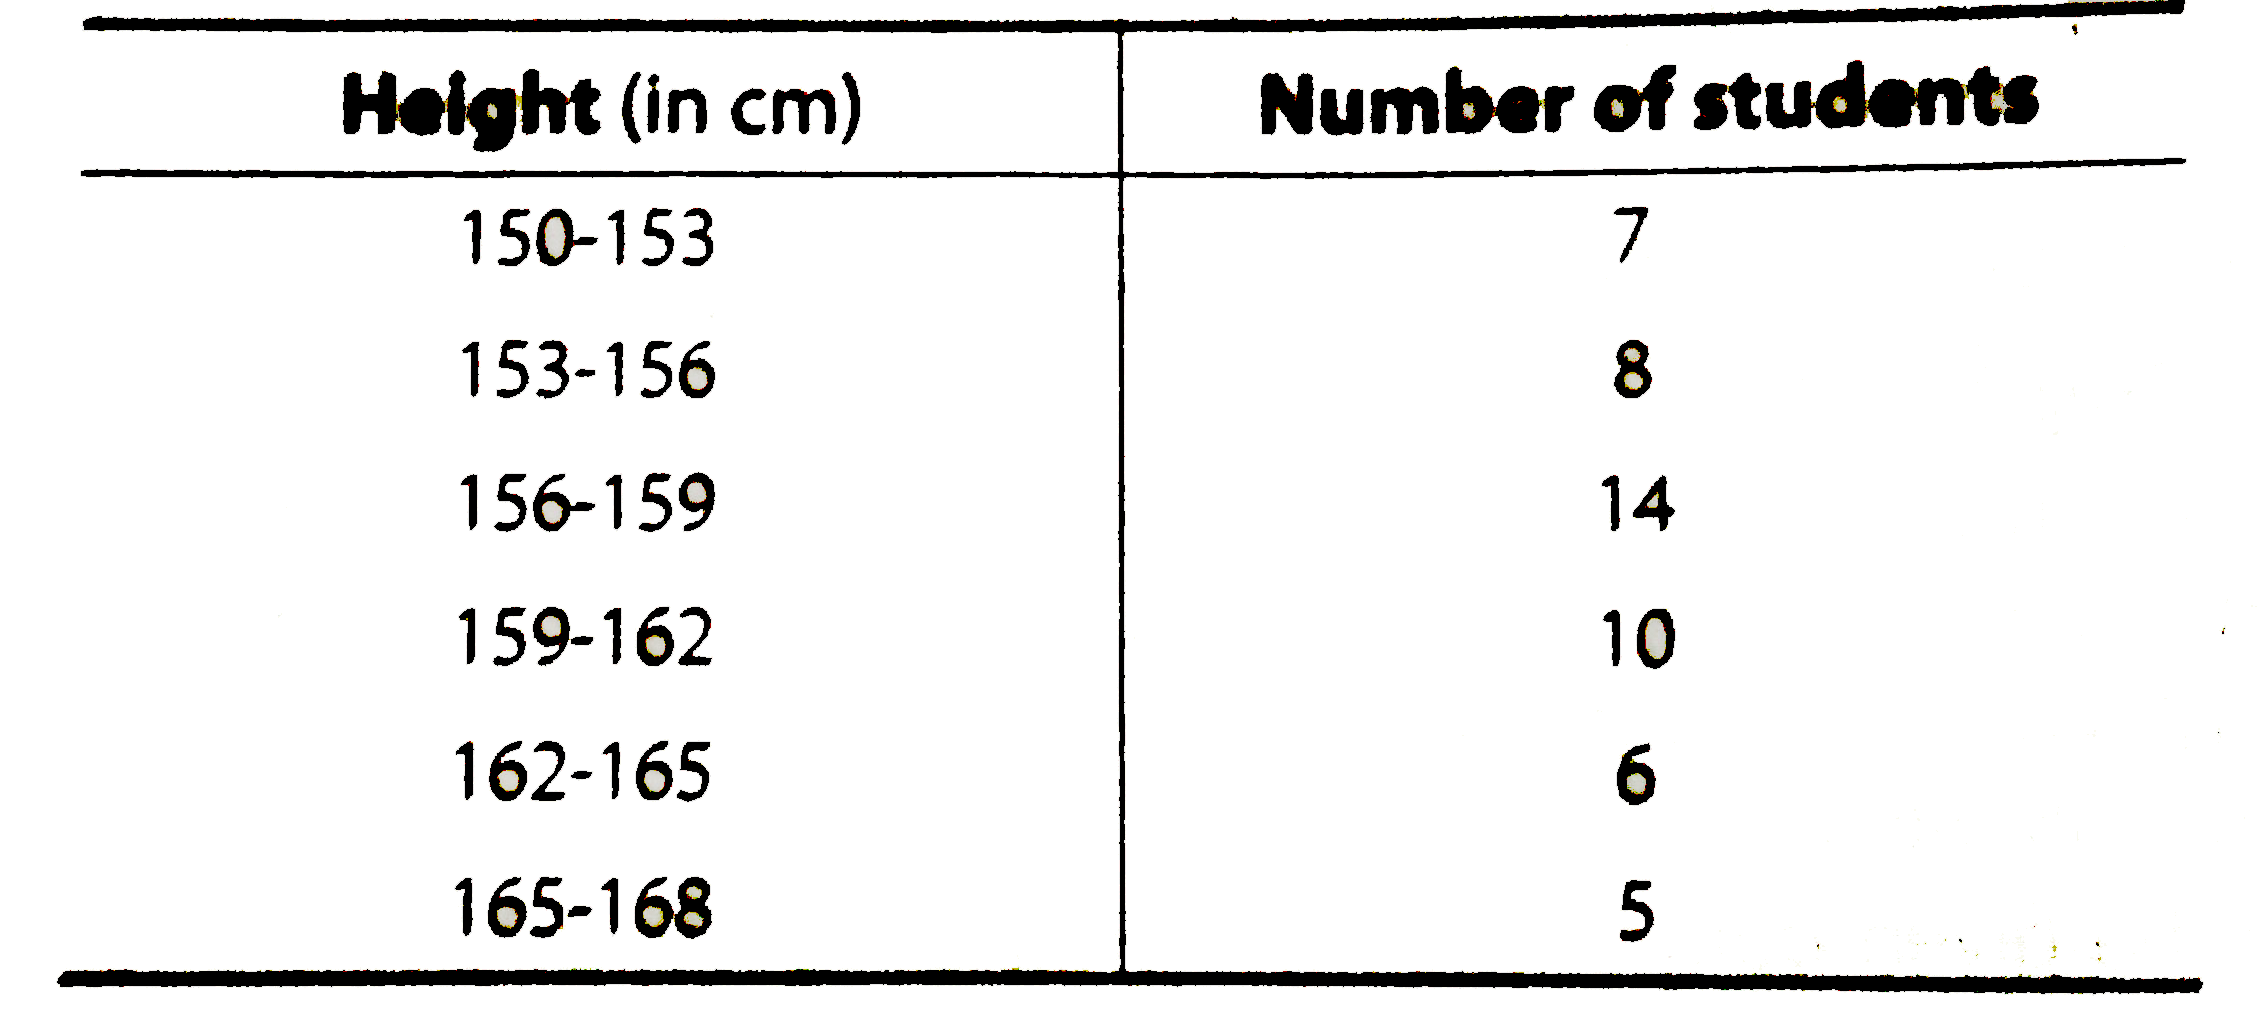
Draw a less than cumuative frequency curve (ogive) for the following distribution :

The cumulative frequecny table for the given distribution is :
 ltbr Taking upper class limits along X-axis and corresponding cumulative frequencies along Y-axis mark the points (10,7), (15,16), (20,28),(25,36) and (30,42). Join the points marked by a free hand curve (as shown in figure)
(#NTN_MATH_X_C14_S01_033_S02.png" width="80%">
Topper's Solved these Questions
- STATISTICS Book:NAGEEN PRAKASHAN ENGLISHChapter:STATISTICS Exercise:Problems From NCERT/exemplar
Explore 4 Videos
- STATISTICS Book:NAGEEN PRAKASHAN ENGLISHChapter:STATISTICS Exercise:Exercise 14 A
Explore 17 Videos
- SOME APPLICATIONS OF TRIGONOMETRYBook:NAGEEN PRAKASHAN ENGLISHChapter:SOME APPLICATIONS OF TRIGONOMETRYExercise:Long Answer Questions
Explore 5 Videos
- TRIANGLES Book:NAGEEN PRAKASHAN ENGLISHChapter:TRIANGLES Exercise:Revision Exercise Long Questions
Explore 1 Video
Similar Questions
Draw a cumulative frequency curve (ogive) for the following distribution
Mark 5−1010−1515−2020−2525−30 no. of students 7 9 12 8 6
View SolutionDraw a cumulative frequency curve (ogive) for each of the following distributions :
Class interval 10−1920−2930−3940−4950−59Frequency 23 16 15 20 12
View SolutionDraw a cumulative frequency curve (ogive) for each of the following distributions :
Class interval 10−1515−2020−2525−3030−3535−40Frequency 10 15 17 12 10 8
View SolutionConstruct a frequency polygon for the following distribution :

View SolutionThe mode for the following frequency distribution :

View SolutionDraw a cumulative frequency curve and cumulative frequency polygon for the following frequency distribution by less than method. Age (in yrs). 0-9 10-19 20-29 30-39 40-49 50-59 60-69 No. of Person 5 15 20 23 17 11 9
View SolutionDraw a histogram of the following distribution.

View SolutionDraw a frequency polygon from the following frequency distribution

View SolutionFind the mean for the following frequency distribution :

View SolutionCompute the mode for the following frequency distribution :

View Solution

