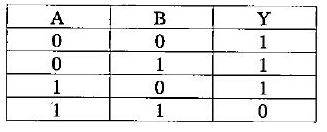
The truth table given below represents

Video Solution
Text Solution
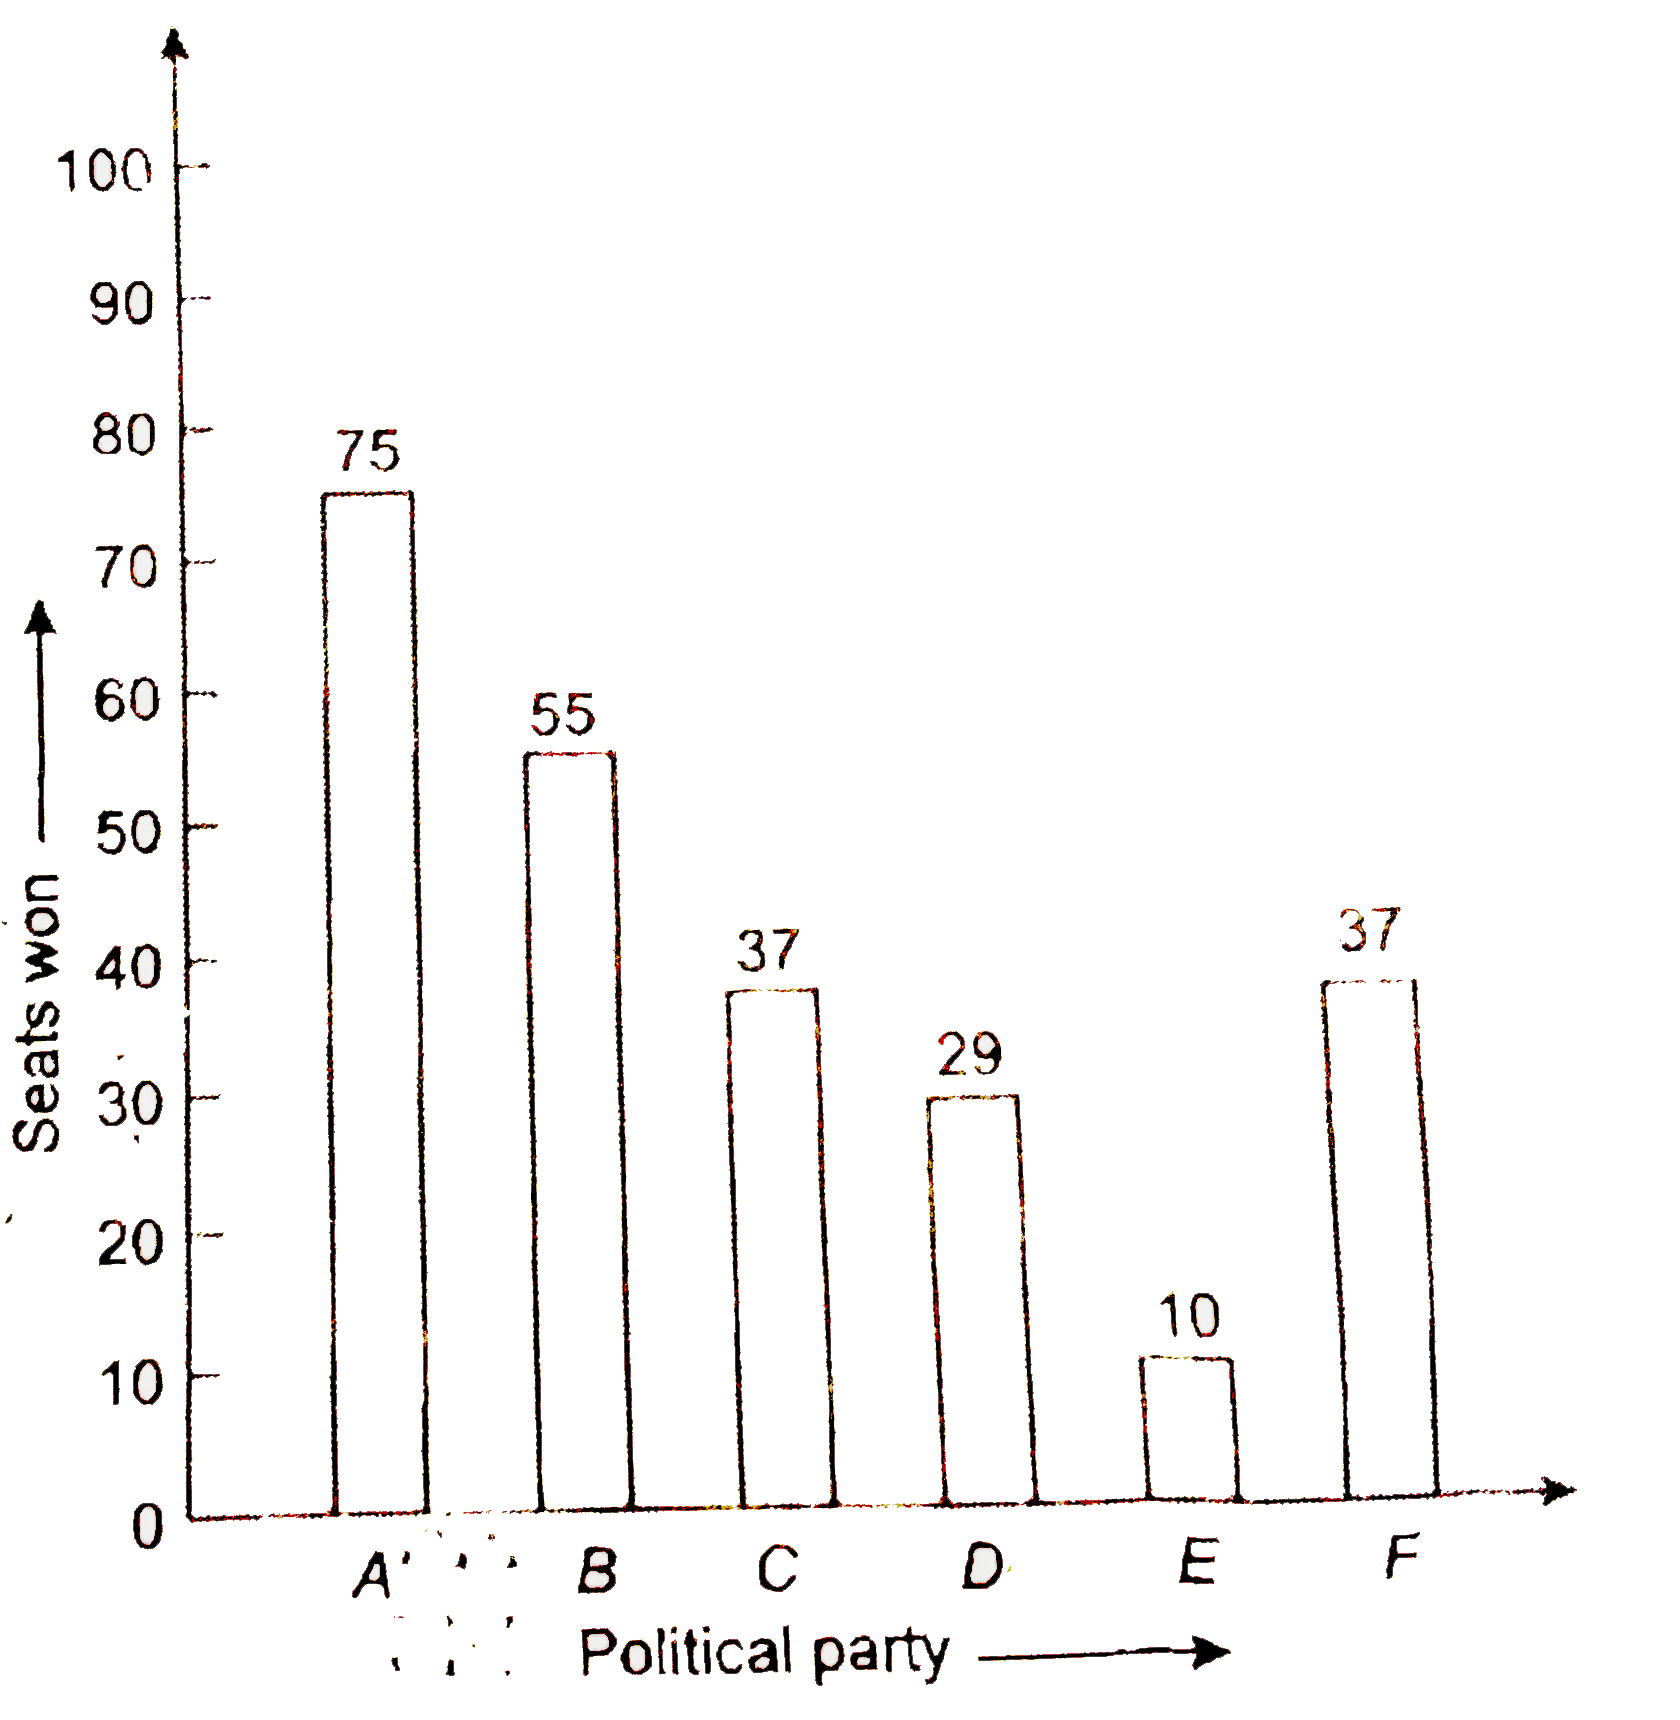
We draw the bar graph of this data, note that the unit in the second column is seats won by political party.
(i) We represent the political party on the horizontal axis choosing any scale since width of the bar is not important but for clarity, we take equal widths for all bars and maintain equal gaps in between. Let on political party be represented by one unit.
(ii) We represented the seats won on the vertical axis.
Here, we can choose the scale as 1 unit = 10
Now, the graph is drawn in figure.
Party 'A' won the maximum number of seats i.e., 75.
|
Topper's Solved these Questions
- STATISTICSBOOK - NAGEEN PRAKASHAN ENGLISHCHAPTER - STATISTICSEXERCISE - Exercise 14a
10 Videos
- STATISTICSBOOK - NAGEEN PRAKASHAN ENGLISHCHAPTER - STATISTICSEXERCISE - EXERCISE 14B
13 Videos
- STATISTICSBOOK - NAGEEN PRAKASHAN ENGLISHCHAPTER - STATISTICSEXERCISE - Revision Exercise
12 Videos
- QUADRILATERALSBOOK - NAGEEN PRAKASHAN ENGLISHCHAPTER - QUADRILATERALSEXERCISE - Revision Exercise (long Answer Questions)
5 Videos
- SURFACE AREA AND VOLUMEBOOK - NAGEEN PRAKASHAN ENGLISHCHAPTER - SURFACE AREA AND VOLUMEEXERCISE - Revision Exercise (long Answer Questions)
10 Videos
Similar Questions
Symbol given below represents
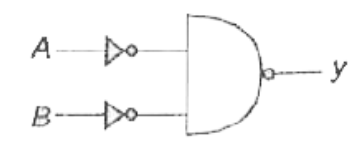
View SolutionThe logic gate given below represents a

View SolutionThe arrangement given below represents a logic gate:

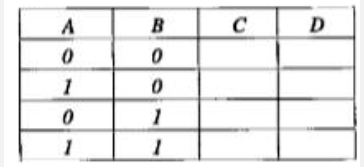
Copy the following truth table in your answer booklet and complete it showing outputs at C and D
View SolutionThe truth table given below is for :-
ABY001010100111
View SolutionThe circuit given below represents which of the logic operations?

View SolutionThe diagram given below represents
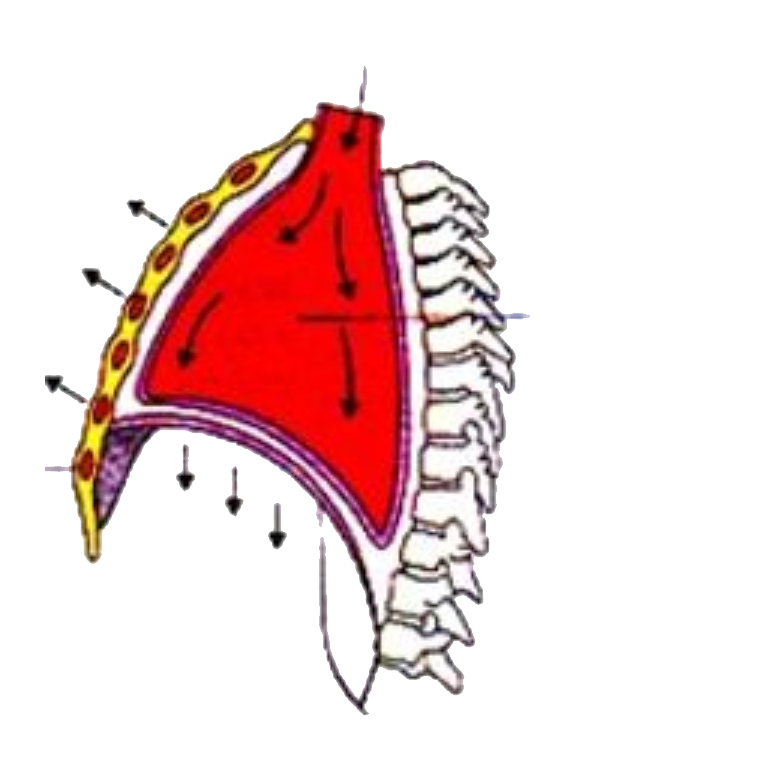
View SolutionThe pair of structure given below represents
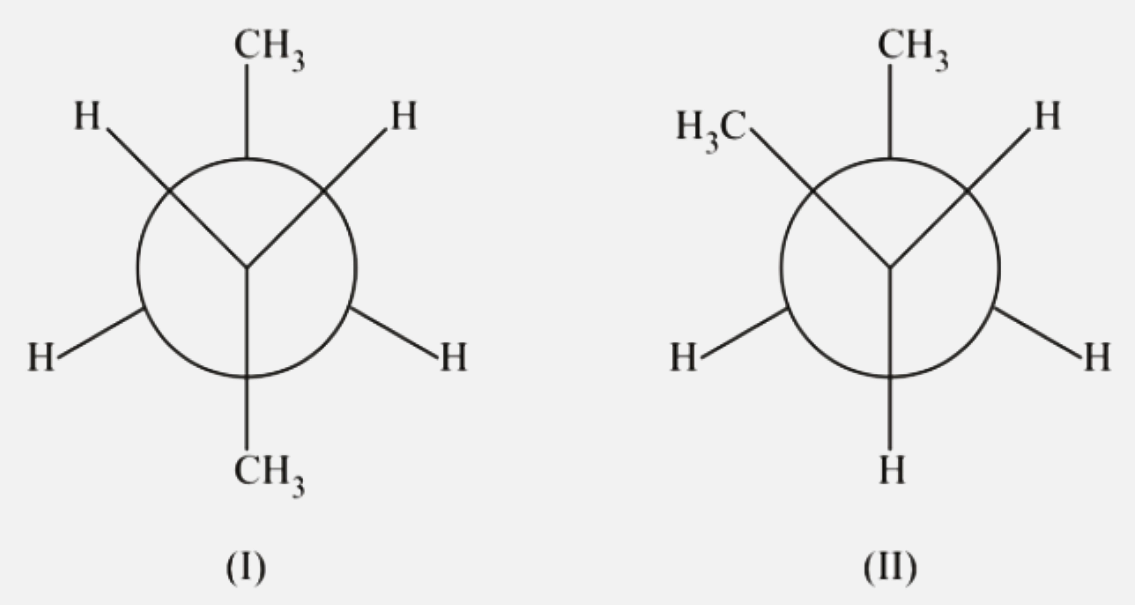
View SolutionThe pair of structures given below represents:
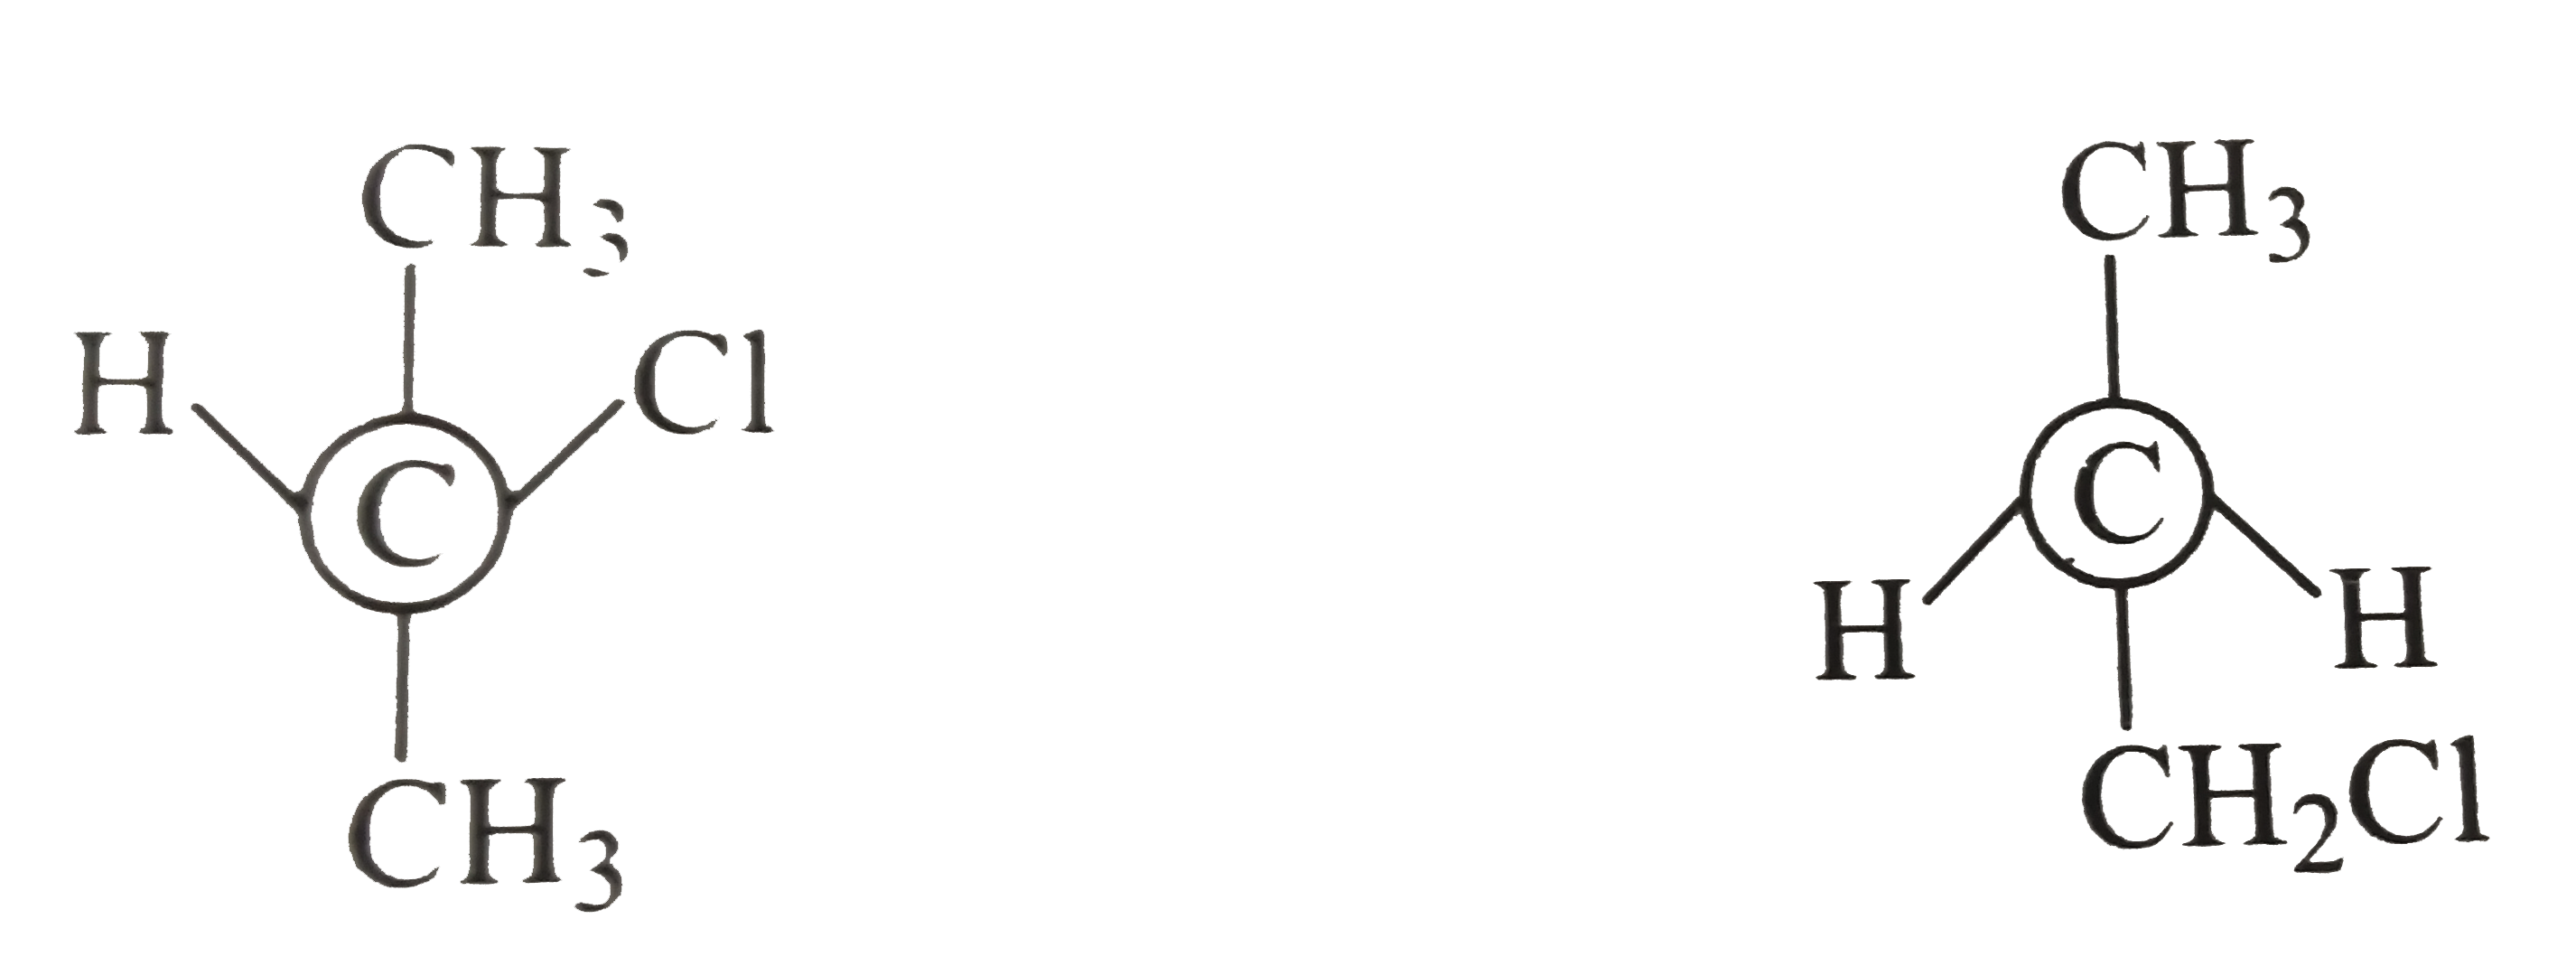
View SolutionIdentify the logic gate whose truth table is given below and draw its symbol :
View SolutionComplete the table given below :
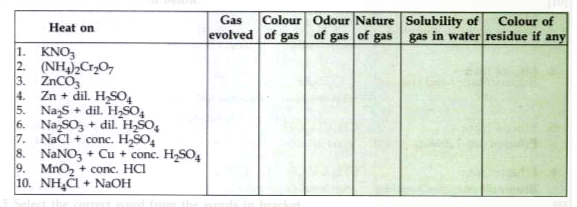
View Solution
