A study was conduced to find out the concentration of sulphur dioxide in the air in parts per million (ppm) of a certain city. The data obtained for 30 days is as follow:
0.03 0.08 0.08 0.09 0.04 0.170.16 0.05 0.02 0.06 0.18 0.200.11 0.08 0.12 0.13 0.22 0.070.08 0.01 0.10 0.06 0.09 0.180.11 0.07 0.05 0.07 0.01 0.04
You were asked to prepare a frequency distribution table, regarding the concentration of sulphur dioxide in the air in parts per million of a certain city for 30 days. Using this table, find the probability of the concentration of sulphur dioxide in the interval 0.12-0.16 on any of these days.
To solve the problem, we will follow these steps:
Step 1: Organize the Data
First, we need to list the data provided for the concentration of sulphur dioxide in parts per million (ppm) over 30 days. The data is:
0.03,0.08,0.08,0.09,0.04,0.17,0.16,0.05,0.02,0.06,0.18,0.20,0.11,0.08,0.12,0.13,0.22,0.07,0.08,0.01,0.10,0.06,0.09,0.18,0.11,0.07,0.05,0.07,0.01,0.04
Step 2: Create a Frequency Distribution Table
Next, we will create a frequency distribution table with appropriate class intervals. We will use intervals of 0.04.
| Class Interval | Frequency |
|----------------|-----------|
| 0.01 - 0.04 | 5 |
| 0.04 - 0.08 | 11 |
| 0.08 - 0.12 | 7 |
| 0.12 - 0.16 | 2 |
| 0.16 - 0.20 | 4 |
| 0.20 - 0.24 | 1 |
| Total | 30 |
Step 3: Calculate the Probability
Now, we need to find the probability of the concentration of sulphur dioxide falling within the interval 0.12 to 0.16.
- Number of favorable outcomes (frequency for 0.12 - 0.16): 2
- Total number of outcomes: 30
The probability \( P \) is given by the formula:
\(
P = \frac{\text{Number of favorable outcomes}}{\text{Total number of outcomes}} = \frac{2}{30} = \frac{1}{15}
\)
Final Answer
The probability of the concentration of sulphur dioxide in the interval 0.12 to 0.16 on any of these days is \( \frac{1}{15} \).
---
First, we need to list the data provided for the concentration of sulphur dioxide in parts per million (ppm) over 30 days. The data is:
Next, we will create a frequency distribution table with appropriate class intervals. We will use intervals of 0.04.
|----------------|-----------|
| 0.01 - 0.04 | 5 |
| 0.04 - 0.08 | 11 |
| 0.08 - 0.12 | 7 |
| 0.12 - 0.16 | 2 |
| 0.16 - 0.20 | 4 |
| 0.20 - 0.24 | 1 |
| Total | 30 |
Now, we need to find the probability of the concentration of sulphur dioxide falling within the interval 0.12 to 0.16.
- Total number of outcomes: 30
\(
P = \frac{\text{Number of favorable outcomes}}{\text{Total number of outcomes}} = \frac{2}{30} = \frac{1}{15}
\)
The probability of the concentration of sulphur dioxide in the interval 0.12 to 0.16 on any of these days is \( \frac{1}{15} \).
Topper's Solved these Questions
- PROBABILITYBook:NAGEEN PRAKASHAN ENGLISHChapter:PROBABILITYExercise:Exercise
Explore 12 Videos
- PROBABILITYBook:NAGEEN PRAKASHAN ENGLISHChapter:PROBABILITYExercise:Revision Exercise (very Short Answer /short Answer Questions)
Explore 10 Videos
- PROBABILITYBook:NAGEEN PRAKASHAN ENGLISHChapter:PROBABILITYExercise:Revision Exercise (very Short Answer /short Answer Questions)
Explore 10 Videos
- POLYNOMIALSBook:NAGEEN PRAKASHAN ENGLISHChapter:POLYNOMIALSExercise:Revision Exercise (short Answer Questions)
Explore 16 Videos
- QUADRILATERALSBook:NAGEEN PRAKASHAN ENGLISHChapter:QUADRILATERALSExercise:Revision Exercise (long Answer Questions)
Explore 5 Videos
Similar Questions
A study was conducted to find out the concentration of sulphur dioxide in the air in parts per million (ppm) of a certain city. The data obtained for 30 days is as follows: 0.03 0.08 0.08 0.09 0.04 0.170.16 0.05 0.02 0.06 0.18 0.200.11 0.08 0.12 0.13 0.22 0.070.08 0.01 0.10 0.06 0.09 0.180.11 0.07 0.05 0.07 0.01 0.04 (i) Make a grouped frequency distribution table for this data with class intervals as 0.00 - 0.04, 0.04 - 0.08, and so on.(ii) For how many days, was the concentration of sulphur dioxide more than 0.11 parts per million?
View SolutionGiven below is the frequency distribution table regarding the concentration of sulphur dioxide in the air in parts per million of a certain city for 30 days.
Concentration0.00−0.040.04−0.080.08−0.120.12−0.160.16−0.200.20−0.24No. of days:489243
Find the probability of concentration of sulphur dioxide in the interval 0.12-0.16 on any of these days.
View SolutionTo find out the concentration of SO2 in the air (in parts per million, i.e., ppm), the data was collected for 30 localities in a certain city Find the mean concentration of SO2 in the air.

View SolutionTo find out the concentration of SO2in the air (in parts per million, i.e., ppm), the data was collected for 30 localities in a certain city and is presented below:Find the mean concentration of SO2in the air.
View SolutionA study was conducted to find out the concentration of sulphur dioxide in the air in parts per million (ppm) of a certain city. The data obtained for 30 days is a follows :

(i) Make a grouped frequency distribution table for this data with class-intervals as 0.00−0.04,0.04−0.08 and so on.
(ii) For how many day's was the concentration of sulphar dioxide more than 0.11 parts per million (ppm)?
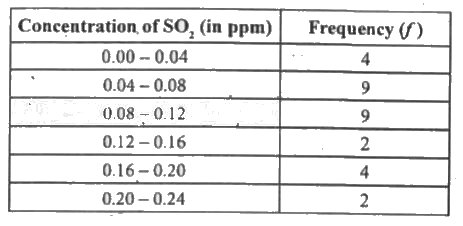
View SolutionTo find out the concentrations of SO2 in the air (in parts per million, i.e., ppm), the data was collected for 30 localities in a certain city and is presented below: Concentration of SO2 (in ppm) Frequency 0.00 - 0.04 4 0.04 - 0.08 9 0.08 - 0.12 9 0.12 - 0.16 2 0.16 - 0.20 4 0.20 - 0.24 2 Find the mean concentration of SO2 in the air.
View SolutionEvaluate: 0.8×0.8×0.8+0.5×0.5×0.50.8×0.8−0.8×0.5+0.5×0.5
View Solution0.012×0.15=
(a) 0.8
(b) 0.08
(c) 0.008
(d) 0.0018
View Solution0.4x+0.3y=1.70.7x−0.2y=0.8
View Solution0.02×0.05=
(a) 0.1
(b) 0.01
(c) 0.001
(d) 0.0001
View Solution

