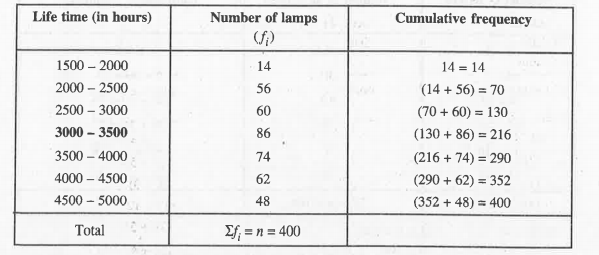
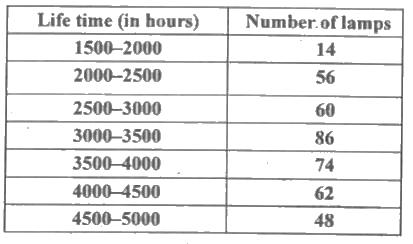
The following table gives the distribution of the life time of 400 neon lamps :

Find the median life time of a lamp.Solution in Punjabi
Step by step video & image solution for The following table gives the distribution of the life time of 400 neon lamps : Find the median life time of a lamp. by Maths experts to help you in doubts & scoring excellent marks in Class 10 exams.
Updated on:21/07/2023Topper's Solved these Questions
Similar Questions
The table below gives the percentage distribution of female teachers in the primary schools of rural areas of various states and union territories (U.T.) of India. Find the mean percentage of female teachers by all the three methods discussed in this section.

View SolutionA tower stands vertically on the ground. Front a point on the ground. which is 15 m away from the foot of the tower, the angle of elevation of the top of the tower is found to be 60∘. Find the height of the tower.
View SolutionRasheed got a playing lop (lattu ) as his birthday present, which surprisingly had no colour on it. He wanted to colour it with his crayons.The top is shaped like a cone surmounted by a hemisphere (see Fig 13.6). The entire top is 5 cm in height and the diameter of the top is 3.5 cm. Find the area he has to colour. (Take π=227)

View SolutionThe following table gives the distribution of the life time of 400 neon lamps Find the median life of a lamp.
View SolutionWhich of the following are correct chain isomers of butane ? (i)
View SolutionDetermine the point of symmetry of a regular hexagon.
View SolutionDtermine the images of the following figure about the given line :
View SolutionMatch the following Column A to Column B

View SolutionMatch the following Column A to Column B

View SolutionMatch the following Column A to Column B

View SolutionFind the area of the figure given below.

View SolutionThe inequation represented by the graph given below is :
View SolutionThe inequation that best describes the graph given below is _________
View SolutionThe inequation that best describes the following graph is _________
View SolutionIn Fig, find the value of x.
ltimg src="https://d10lpgp6xz60nq.cloudfront.net/physics_images/PS_MATH_IX_C12_S01_032_Q01.png" width="80%"gt
View SolutionThe following table gives the distribution of the life time of 400 neon lamps :

Find the median life time of a lamp
View Solution
