Consider the reversible isothermal expansion of an ideal gas in a closed ststem at two different temeratures T1andT2(T1<T2). The correct graphical depiction of the dependence of work done (w) on the final volume (V) is :
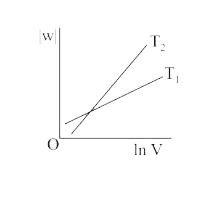
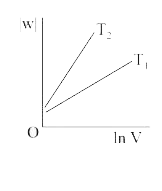
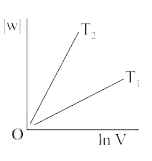
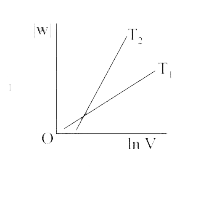
The correct Answer is:D
For reversible isothermal expansion of an ideal gas.
w=−nRTlnV2V1(V2→Final volume,V1→Initial volume)
∴|w|=nRTlnV2V1
|w|=nRTlnV2−nRTlnV1
So in a graph of |w| versus ln V2, the intercept cannot be positive.
Topper's Solved these Questions
- THERMODYNAMICSBOOK - VMC MODULES ENGLISHCHAPTER - THERMODYNAMICSEXERCISE - JEE ADVANCED (ARCHIVE)
44 Videos
- THERMODYNAMICSBOOK - VMC MODULES ENGLISHCHAPTER - THERMODYNAMICSEXERCISE - LEVEL-2 (NUMERICAL VALUE TYPE)
15 Videos
- THERMOCHEMISTRYBOOK - VMC MODULES ENGLISHCHAPTER - THERMOCHEMISTRYEXERCISE - JEE ADVANCED (ARCHIVE)
31 Videos
- THERMODYNAMICS & THERMOCHEMISTRYBOOK - VMC MODULES ENGLISHCHAPTER - THERMODYNAMICS & THERMOCHEMISTRYEXERCISE - Impeccable
48 Videos
Similar Questions
Consider the reversible isothermal expansion of an ideal gas in a closed system at two different temperatures T1 and T2(T1<T2). The correct graphical depiction of the dependence of work done (w) on the final volume (V) is:
View SolutionThe p−V diagrams of same mass of a gas are drawn at two different temperatues T1 and T2 Explain whether T1>T2 or T2>T1.
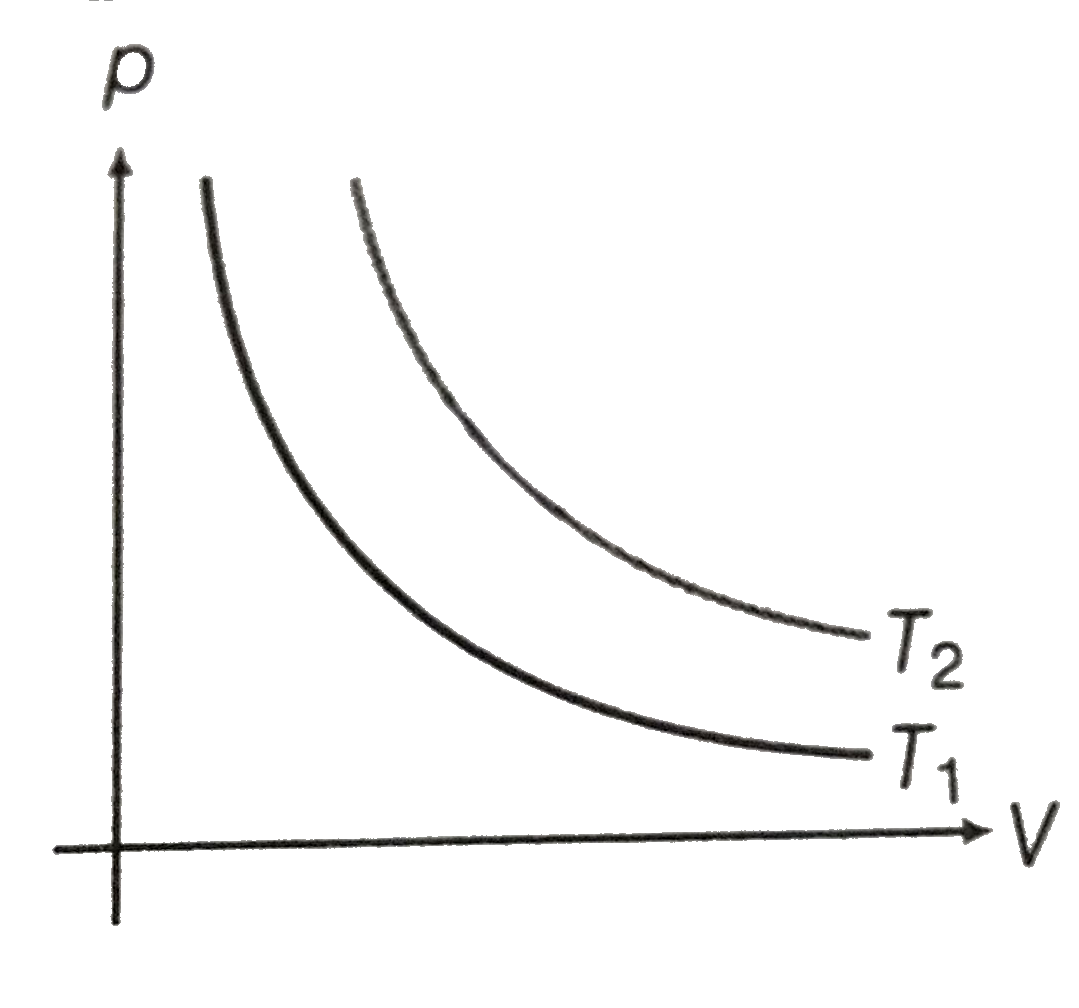
View Solution
Knowledge Check
The isothermal diagram of a gas at three different temperatures T1,T2andT3, is show in the given figure .Then
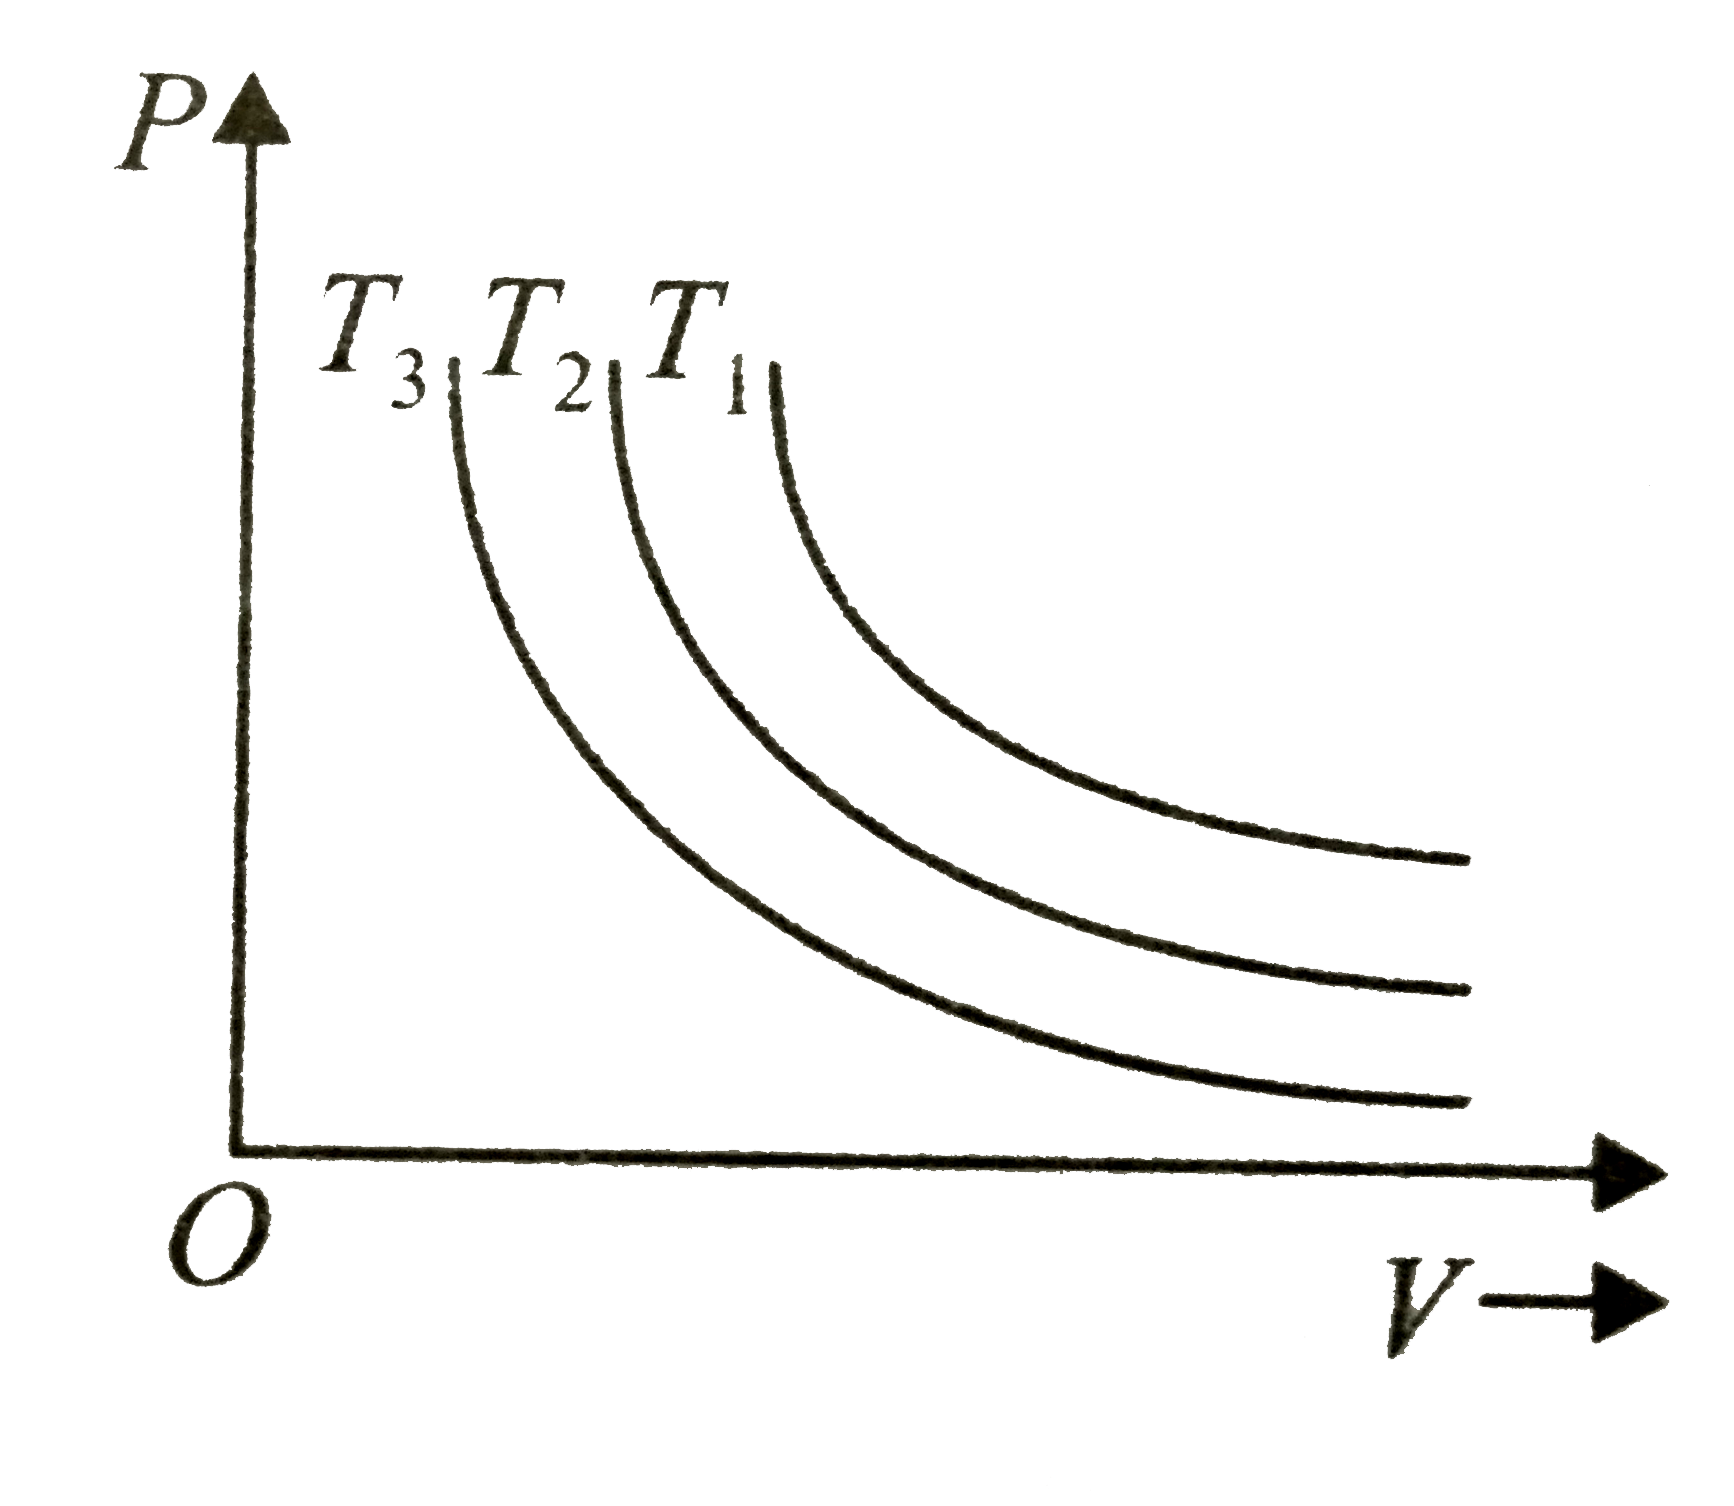 Aa.T1<T2<TBb. T1<T2>T3Cc.T1>T2>T3Dd.T1>T2<T3
p−V diagram of same mass of a gas are drawn at two different temperatures (T1) and (T2). Explain whether T1>T2orT2>T1.
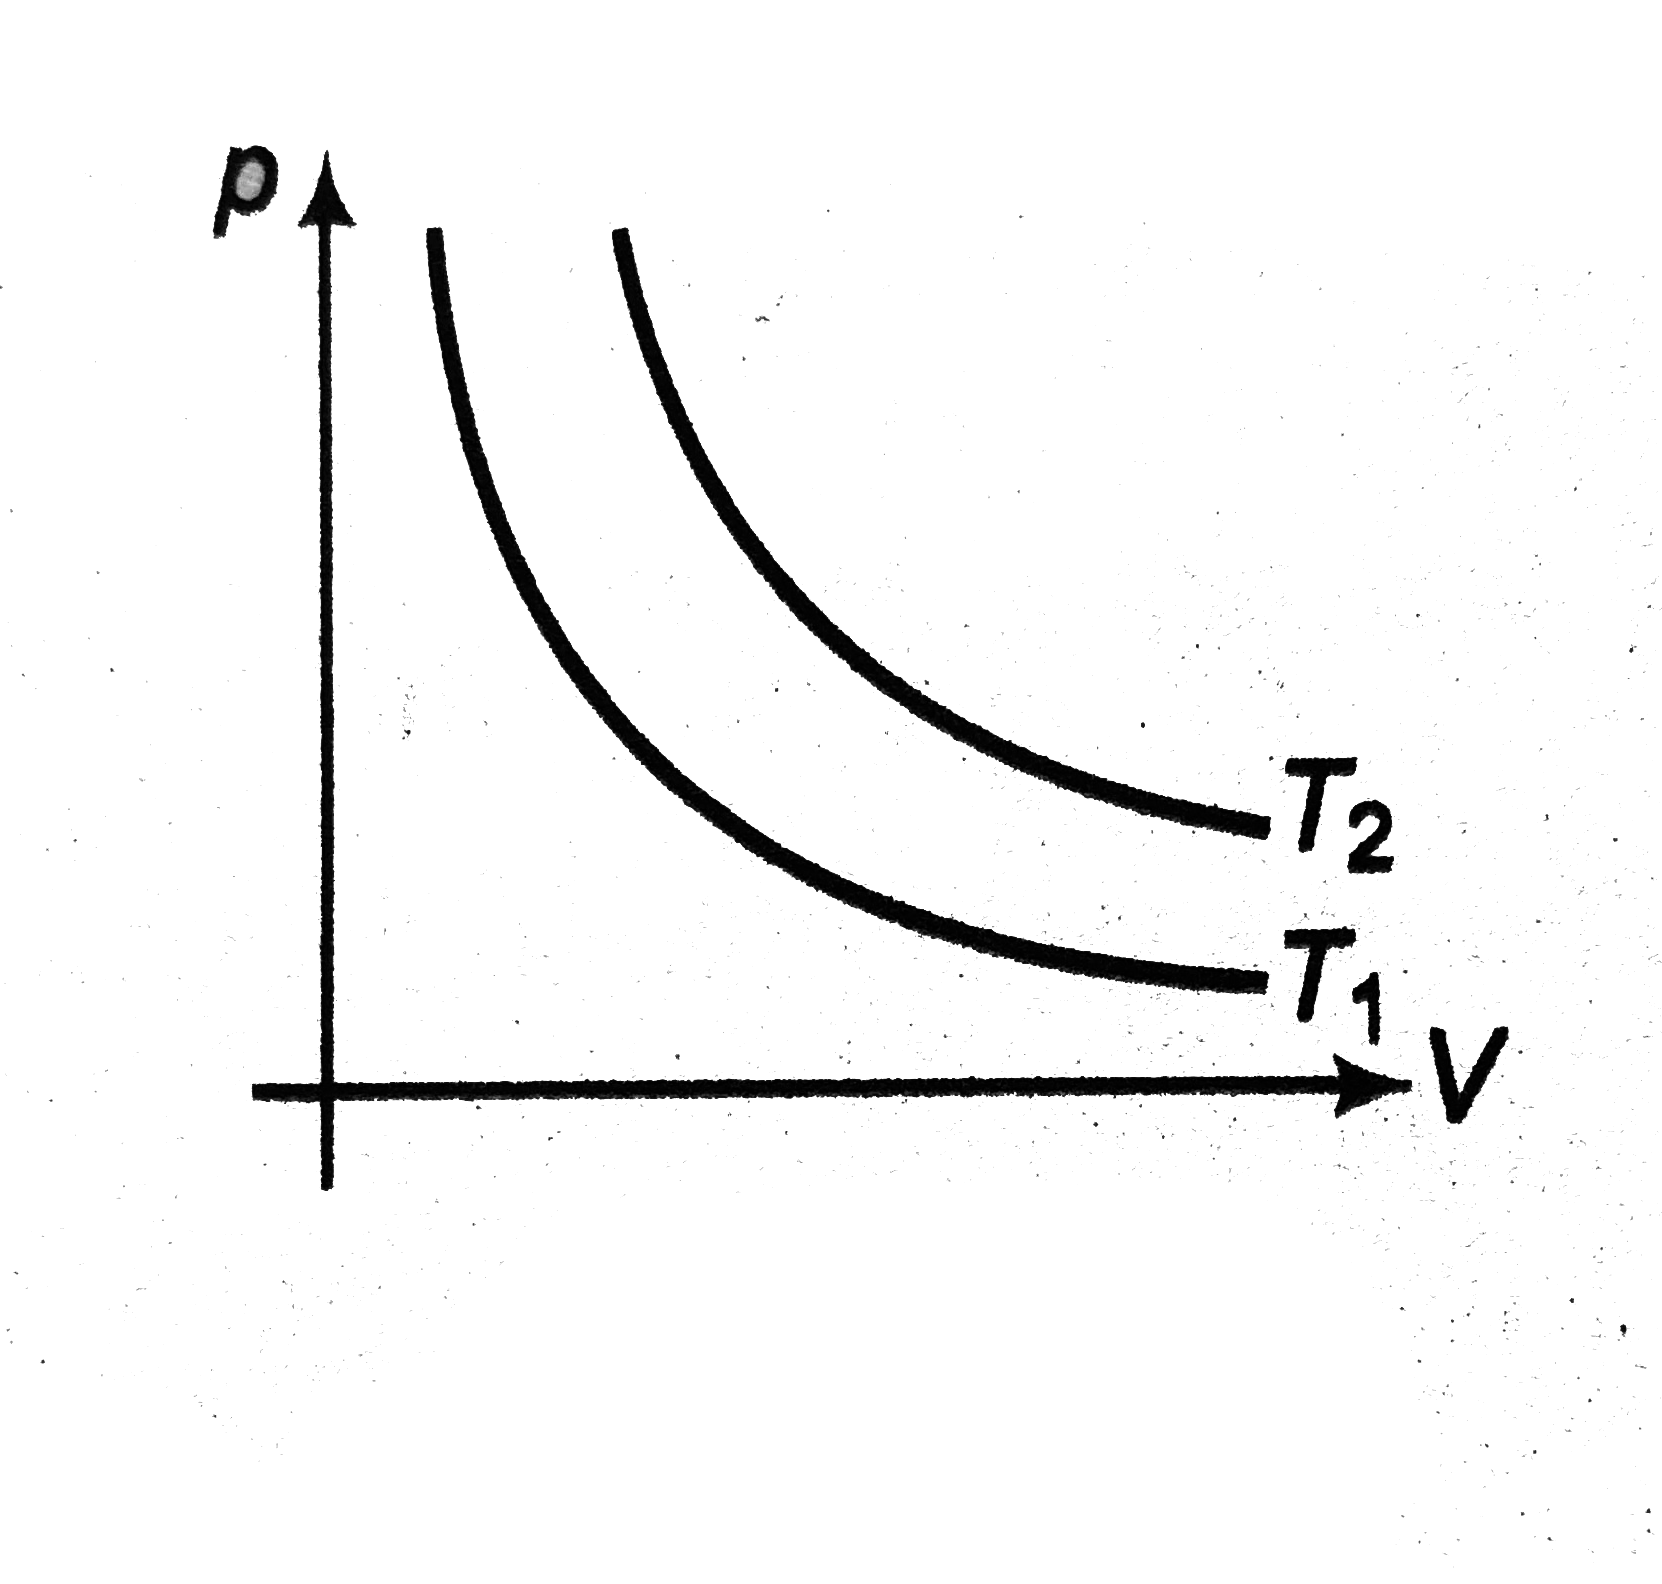 .
.
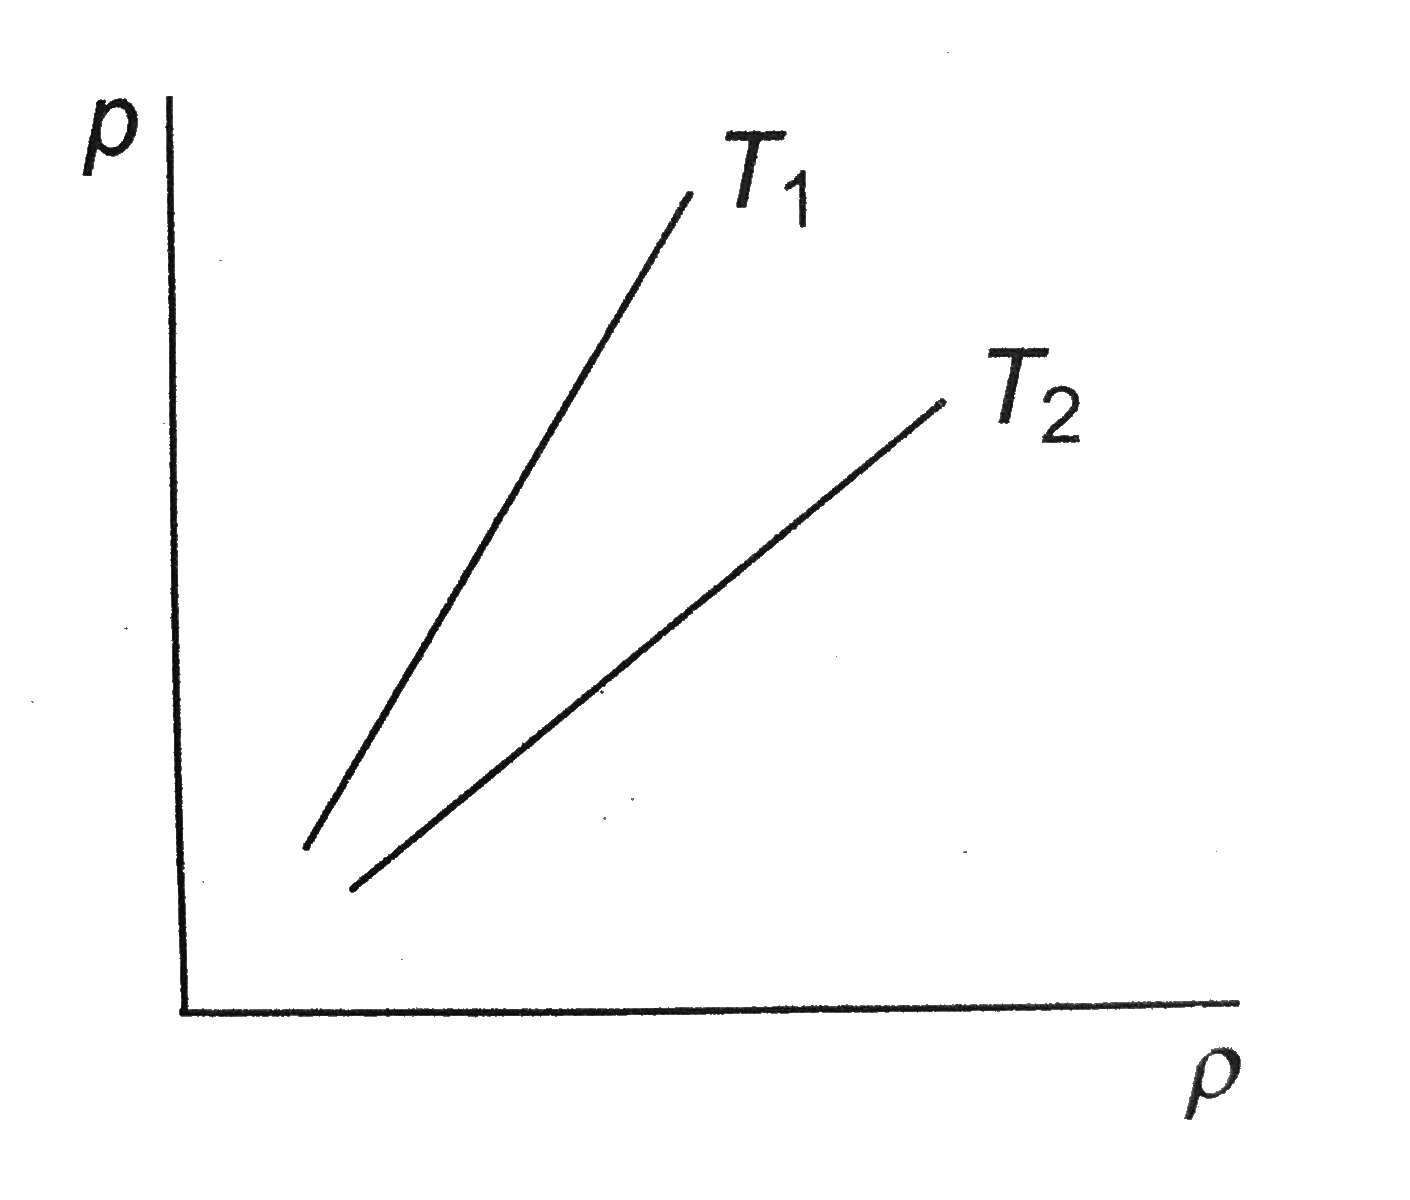
View SolutionFigure shows graphs of pressure versus density for an ideal gas at two temperatures T1 and T2 Which is correct ?
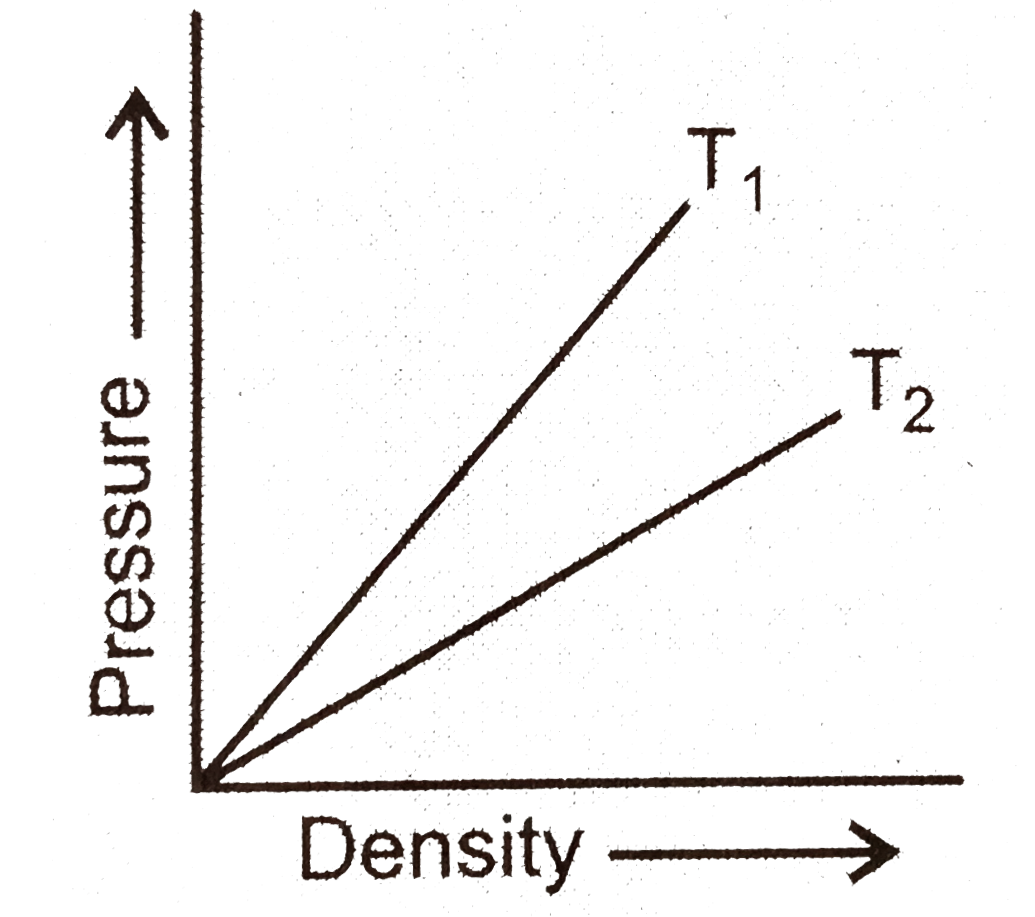 .
.
View SolutionFigure shows volume - temperature (V-T) graph for same mass of an ideal gas at two different pressures P1and P2. Hence
View SolutionAn ideal gas is heated from termperature T1 to T2 under various conditions. The correct statements(s) is/are:-
View SolutionFigure shows graphs of pressure vs density for an ideal gas at two temperature T1andT2. Which of the following is correct?
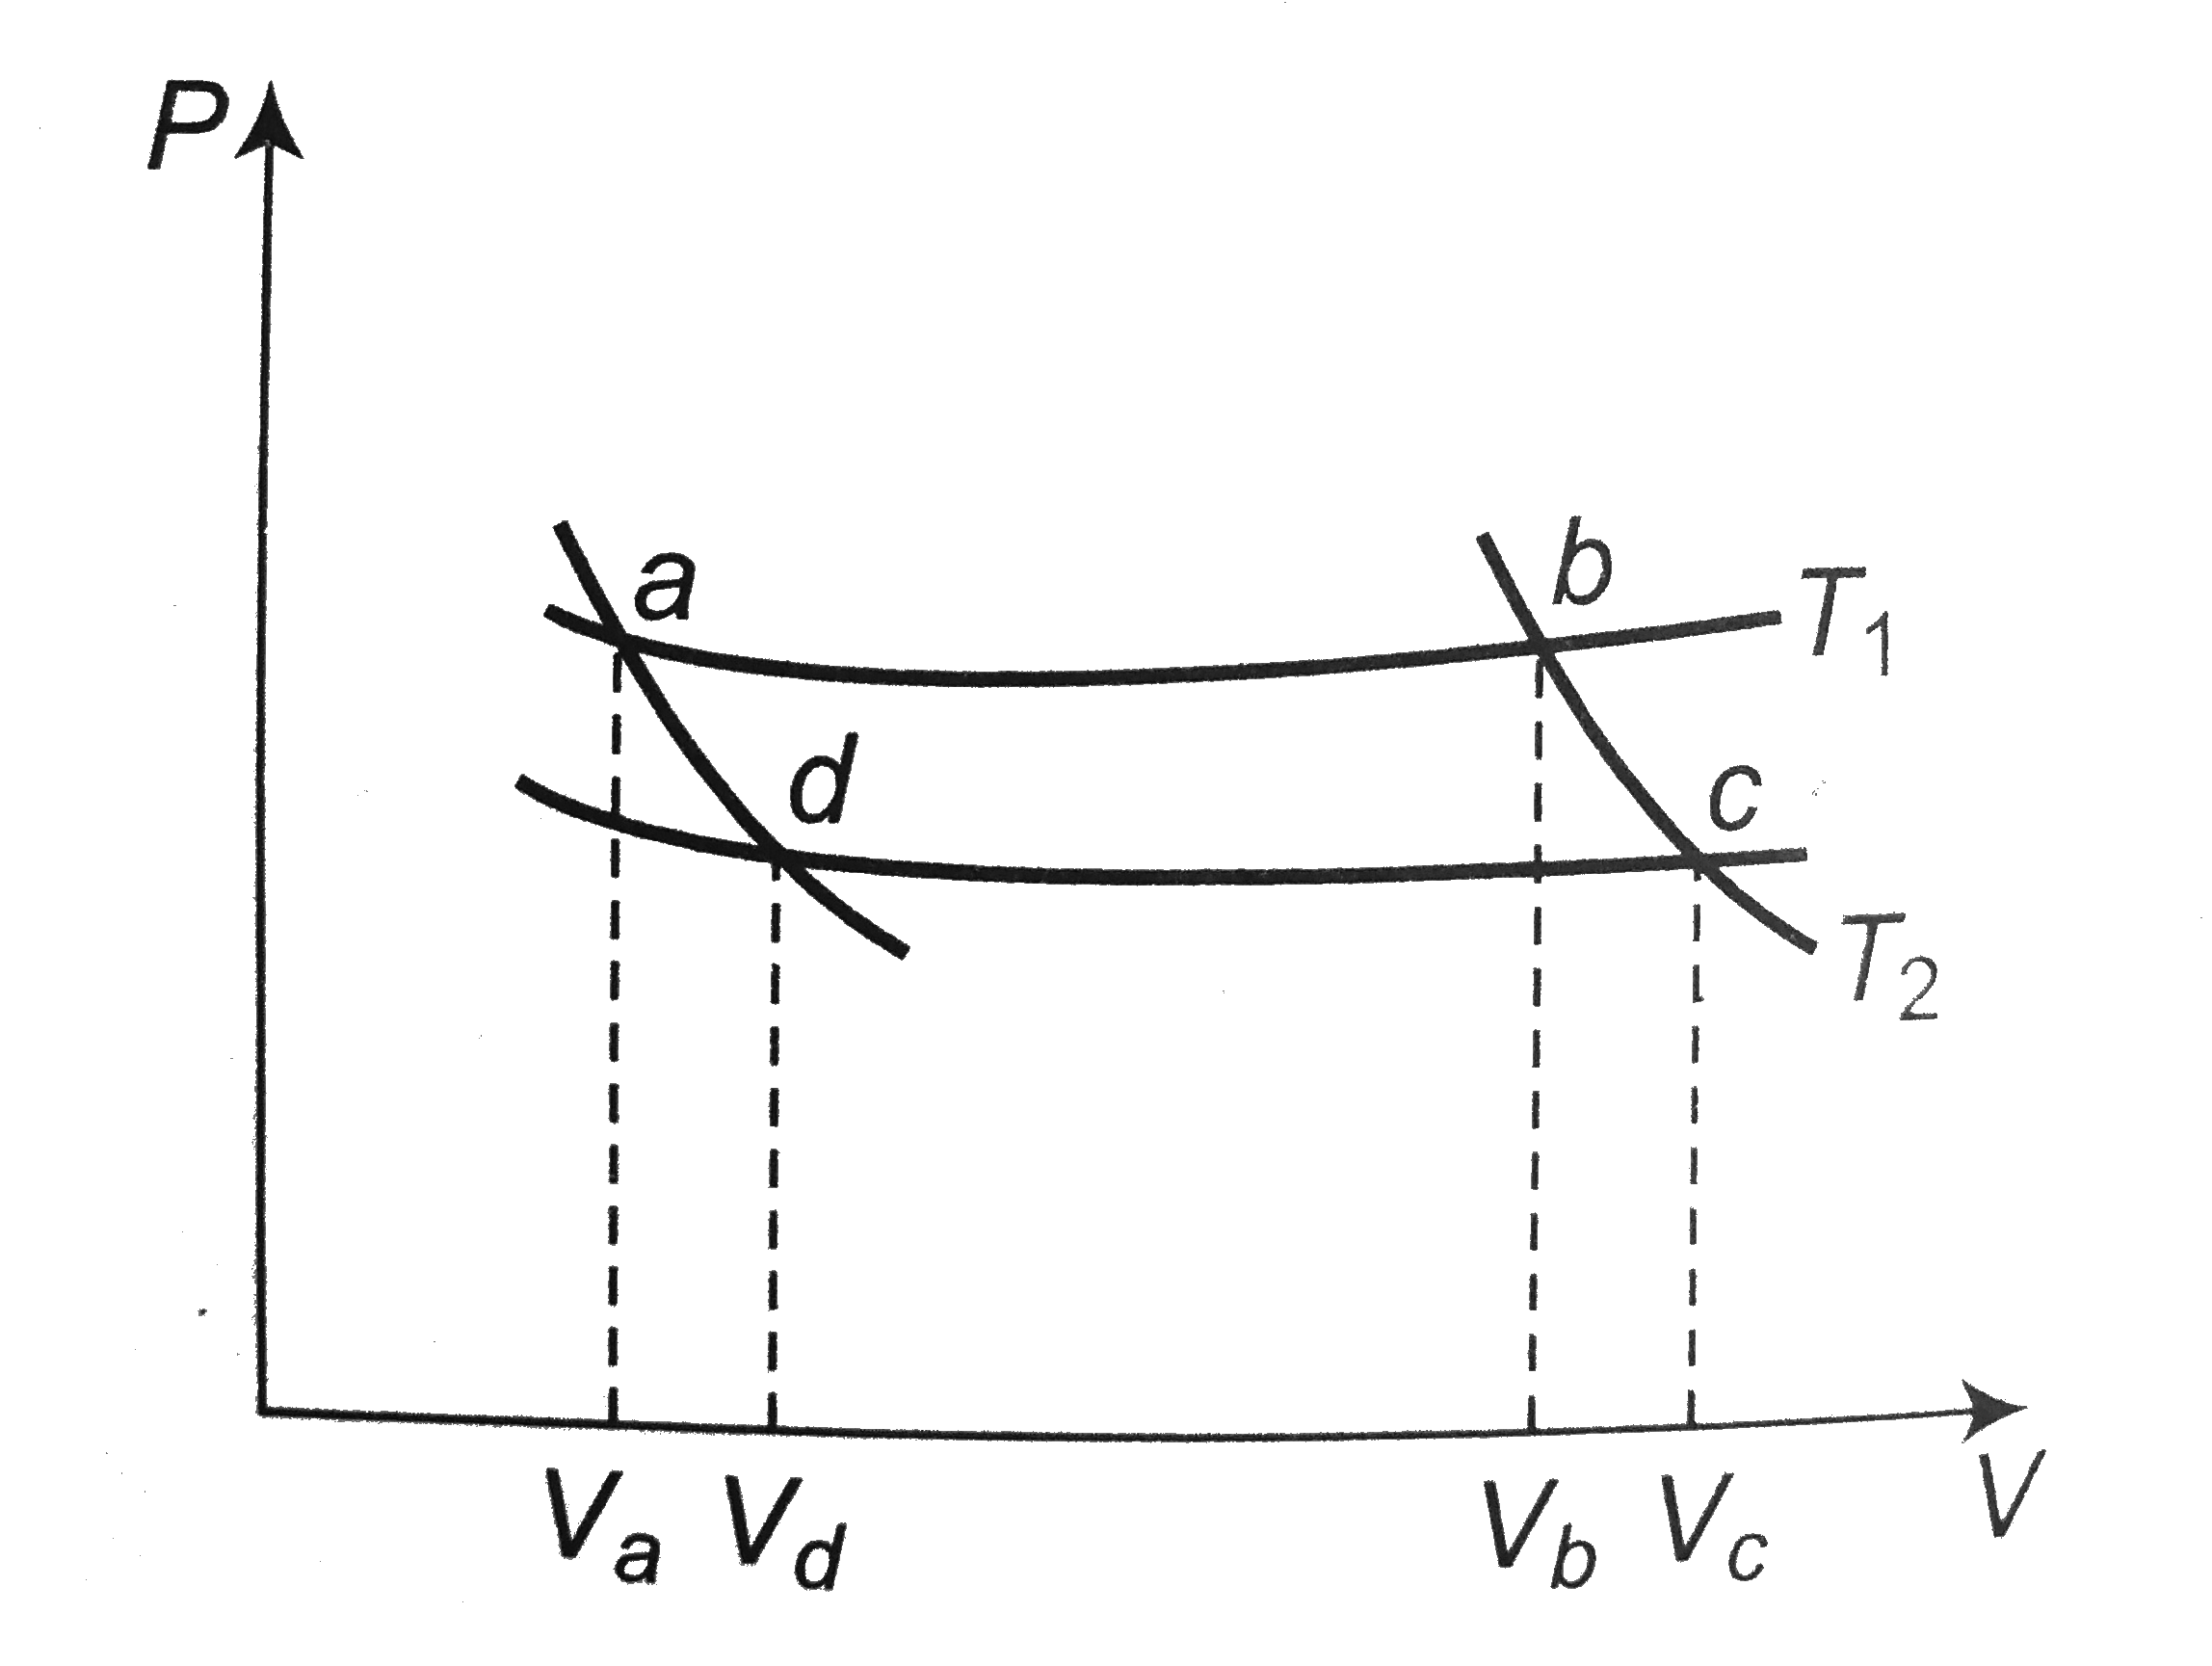
View SolutionIn the following P-V diagram two adiabatics cut two isothermals at temperature T1andT2 (fig). The value of VaVd will be
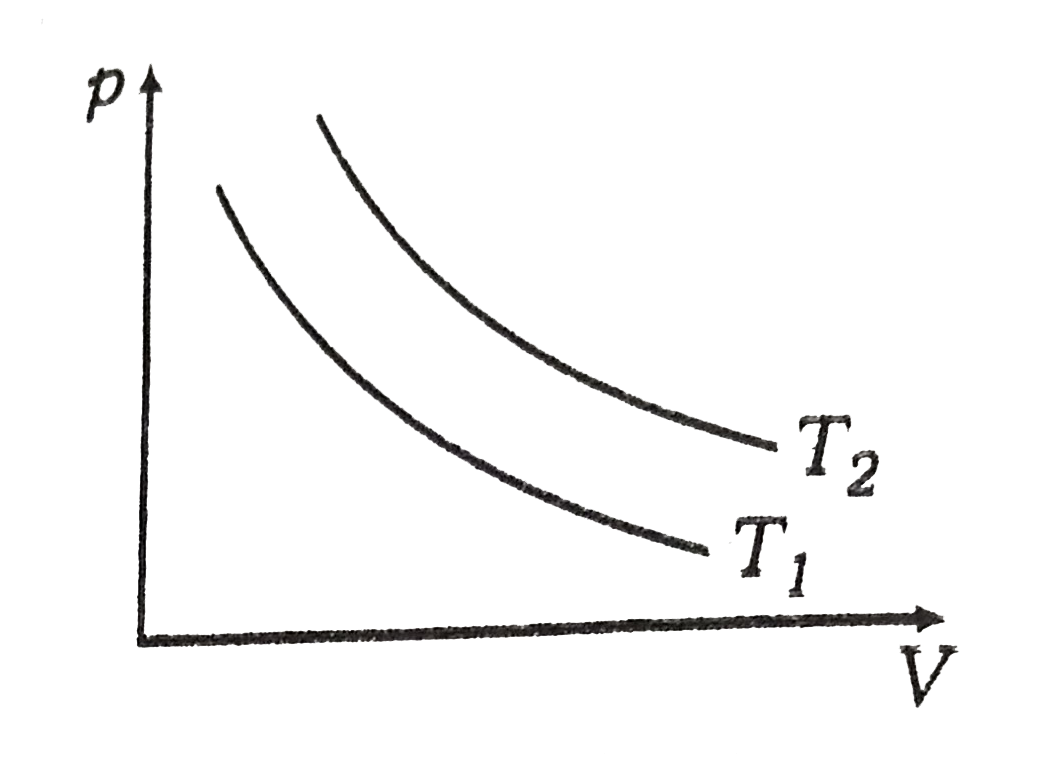
View SolutionThe adjoining fgure shows graph of pressure and volume of a gas at two temperatures T1 and T2 Which one the following is correct
View Solution
