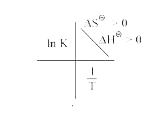
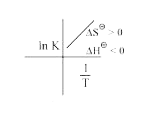
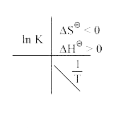
Which of the plots of ln K vs (1T) is/are correct?


The correct Answer is:A, B, C, D
To solve the question regarding the plot of ln K versus (1/T), we will follow a systematic approach based on the thermodynamic equations provided.
1. Understand the Relationship: We start with two important thermodynamic equations:
- ΔG0=−RTlnK (1)
- ΔG0=ΔH0−TΔS0 (2)
2. Equate the Two Equations: Since both equations are equal to ΔG0, we can set them equal to each other:
−RTlnK=ΔH0−TΔS0
3. Rearranging the Equation: We can rearrange this equation to isolate lnK:
−RTlnK=ΔH0−TΔS0
Dividing through by −RT:
lnK=−ΔH0RT+ΔS0R
4. Identify the Form of the Equation: The equation can be rewritten in the form of a straight line y=mx+c:
- Here, y=lnK
- m=−ΔH0R
- x=1T
- c=ΔS0R
5. Determine the Slope and Intercept:
- The slope m is negative, indicating that as 1T increases, lnK decreases.
- The intercept on the y-axis is positive if ΔS0 is positive.
6. Plotting the Graph:
- On the x-axis, we plot 1T.
- On the y-axis, we plot lnK.
- The line will slope downwards (negative slope) and intersect the y-axis at ΔS0R.
7. Conclusion: Based on the analysis, the correct plot of lnK versus 1T will show a downward slope, confirming that as temperature increases (or 1T decreases), the equilibrium constant K decreases.
- ΔG0=−RTlnK (1)
- ΔG0=ΔH0−TΔS0 (2)
−RTlnK=ΔH0−TΔS0
−RTlnK=ΔH0−TΔS0
Dividing through by −RT:
lnK=−ΔH0RT+ΔS0R
- Here, y=lnK
- m=−ΔH0R
- x=1T
- c=ΔS0R
- The slope m is negative, indicating that as 1T increases, lnK decreases.
- The intercept on the y-axis is positive if ΔS0 is positive.
- On the x-axis, we plot 1T.
- On the y-axis, we plot lnK.
- The line will slope downwards (negative slope) and intersect the y-axis at ΔS0R.
Topper's Solved these Questions
- THERMODYNAMICSBook:VMC MODULES ENGLISHChapter:THERMODYNAMICSExercise:LEVEL-2
Explore 50 Videos
- THERMODYNAMICSBook:VMC MODULES ENGLISHChapter:THERMODYNAMICSExercise:LEVEL-2 (NUMERICAL VALUE TYPE)
Explore 15 Videos
- THERMODYNAMICSBook:VMC MODULES ENGLISHChapter:THERMODYNAMICSExercise:LEVEL-0 (LONG ANSWER TYPE (5 MARKS))
Explore 6 Videos
- THERMOCHEMISTRYBook:VMC MODULES ENGLISHChapter:THERMOCHEMISTRYExercise:JEE ADVANCED (ARCHIVE)
Explore 31 Videos
- THERMODYNAMICS & THERMOCHEMISTRYBook:VMC MODULES ENGLISHChapter:THERMODYNAMICS & THERMOCHEMISTRYExercise:Impeccable
Explore 48 Videos
Similar Questions
Knowledge Check
In a plot of log k vs 1/T, the slope is
A−Ea/2.303BEa/2.303RCEa/2.303D−Ea/2.303RIn a plot of log k vs 1/T, the slope is
A−Ea/2.303BEa/2.303RCEa/2.303D−Ea/2.303RIn a plot of log k vs 1/T, the slope is
A−Ea/2.303BEa/2.303RCEa/2.303D−Ea/2.303R
Draw the plot log V vs log T.
View SolutionA graph is plotted between logV and logT for 2mol of gas at constant pressure of 0.0821atm. V and T are in litre and K. Which of the following statements are not correct?
(I) The curve is straight line with slope −1.
(II) The curve is straight line with slope +1.
(III) The intercepet on Y−axis is equal to 2.
(IV) The intercepet on Y−axis is equal to 0.3010.
View SolutionWhich of the following plots is/are correct?
View SolutionWhich of the following plots is/are correct?
View SolutionThe plot og logk vs 1/T helps to calculate
View Solution

