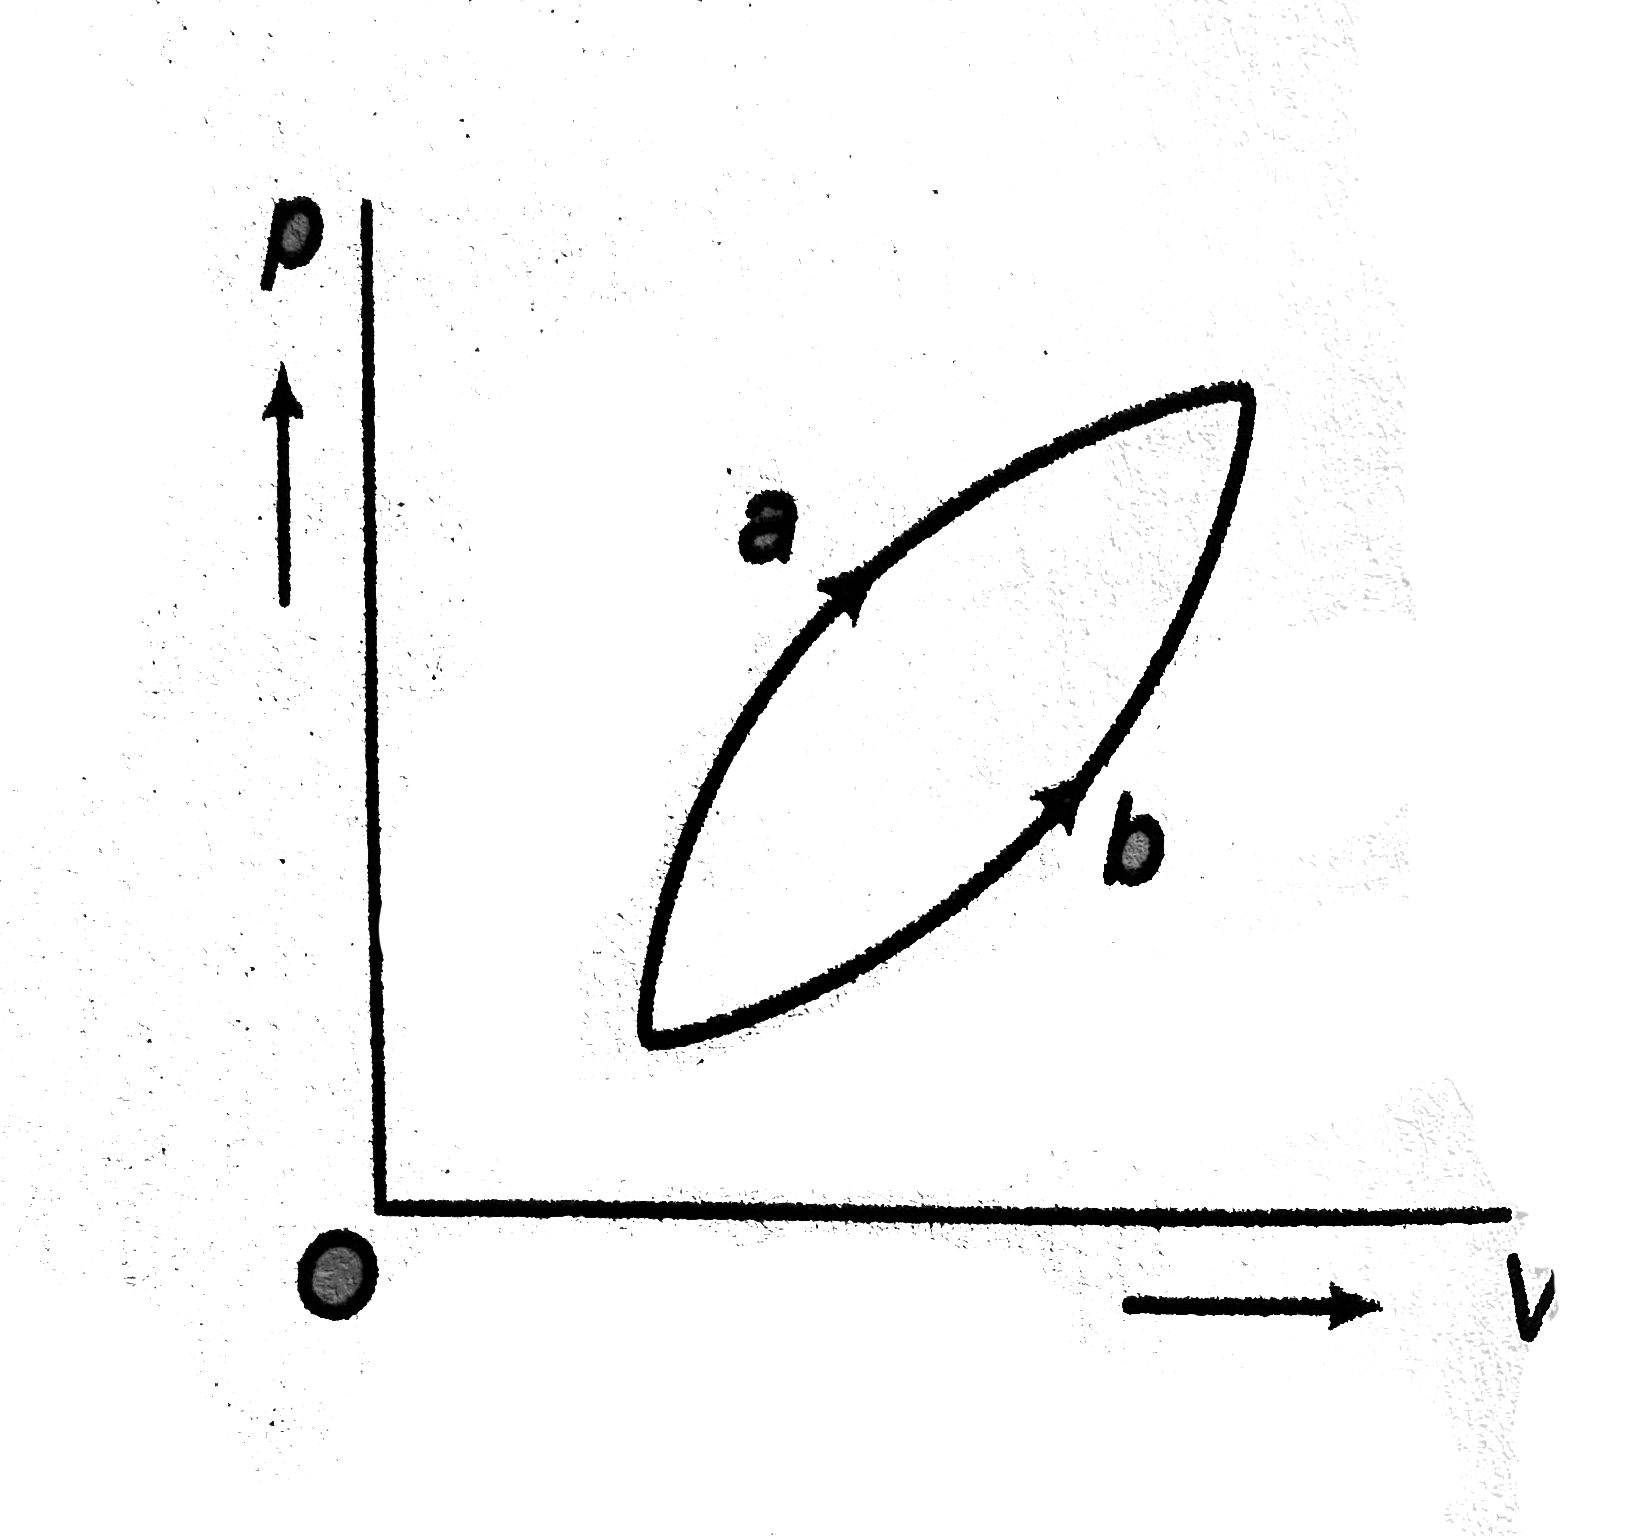
Figure shows two processes a and b for a given sample of a gas. If , are the amounts of heat absorbed by the system in the two cases and , are changes in internal energies respectively, then
The correct Answer is:A
Area under curve process 'A' on P-V diagram is more. Hence
.
Topper's Solved these Questions
- GASEOUS STATE & THERMODYNAMICSBOOK - VMC MODULES ENGLISHCHAPTER - GASEOUS STATE & THERMODYNAMICSEXERCISE - JEE ADVANCED (ARCHIVE )
111 Videos
- GASEOUS STATE & THERMODYNAMICSBOOK - VMC MODULES ENGLISHCHAPTER - GASEOUS STATE & THERMODYNAMICSEXERCISE - Level - 2
40 Videos
- ENERGY & MOMENTUMBOOK - VMC MODULES ENGLISHCHAPTER - ENERGY & MOMENTUMEXERCISE - JEE ADVANCE (ARCHIVE) - TRUE/FALSE TYPE
1 Videos
- GRAVITATIONBOOK - VMC MODULES ENGLISHCHAPTER - GRAVITATIONEXERCISE - JEE Advance (Archive) TRUE/FALSE
1 Videos
Similar Questions
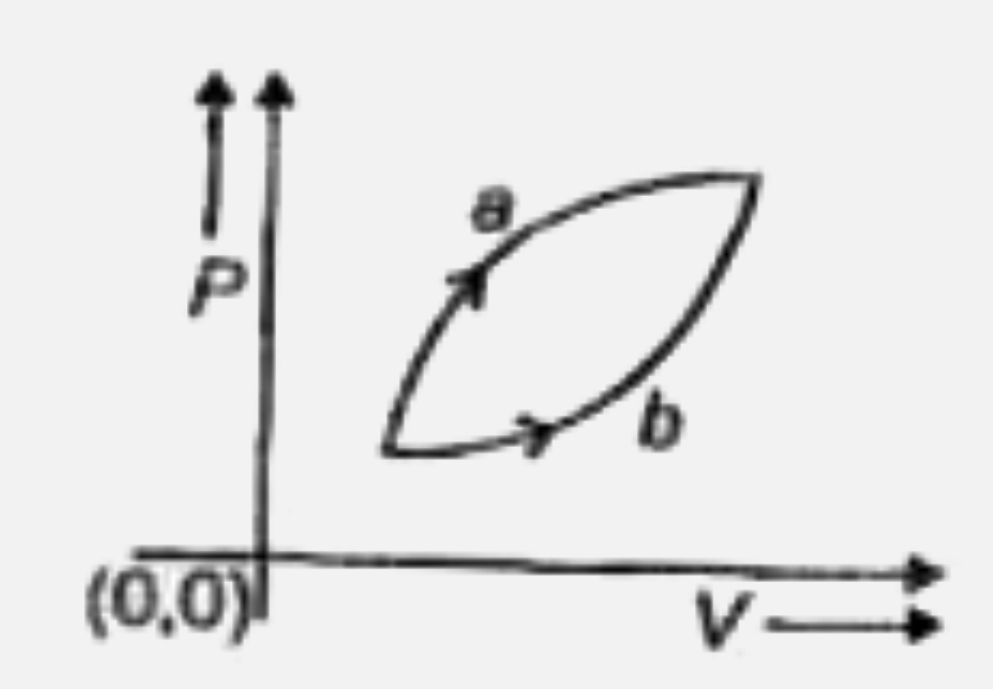
Figure shows two processes a and b for a given sample of gas. If ΔQ1,ΔQ2 are the amount of heat absorbed by the systemin the two cases , and ΔU1,ΔU2 are changes ininternal energy respeclively, then
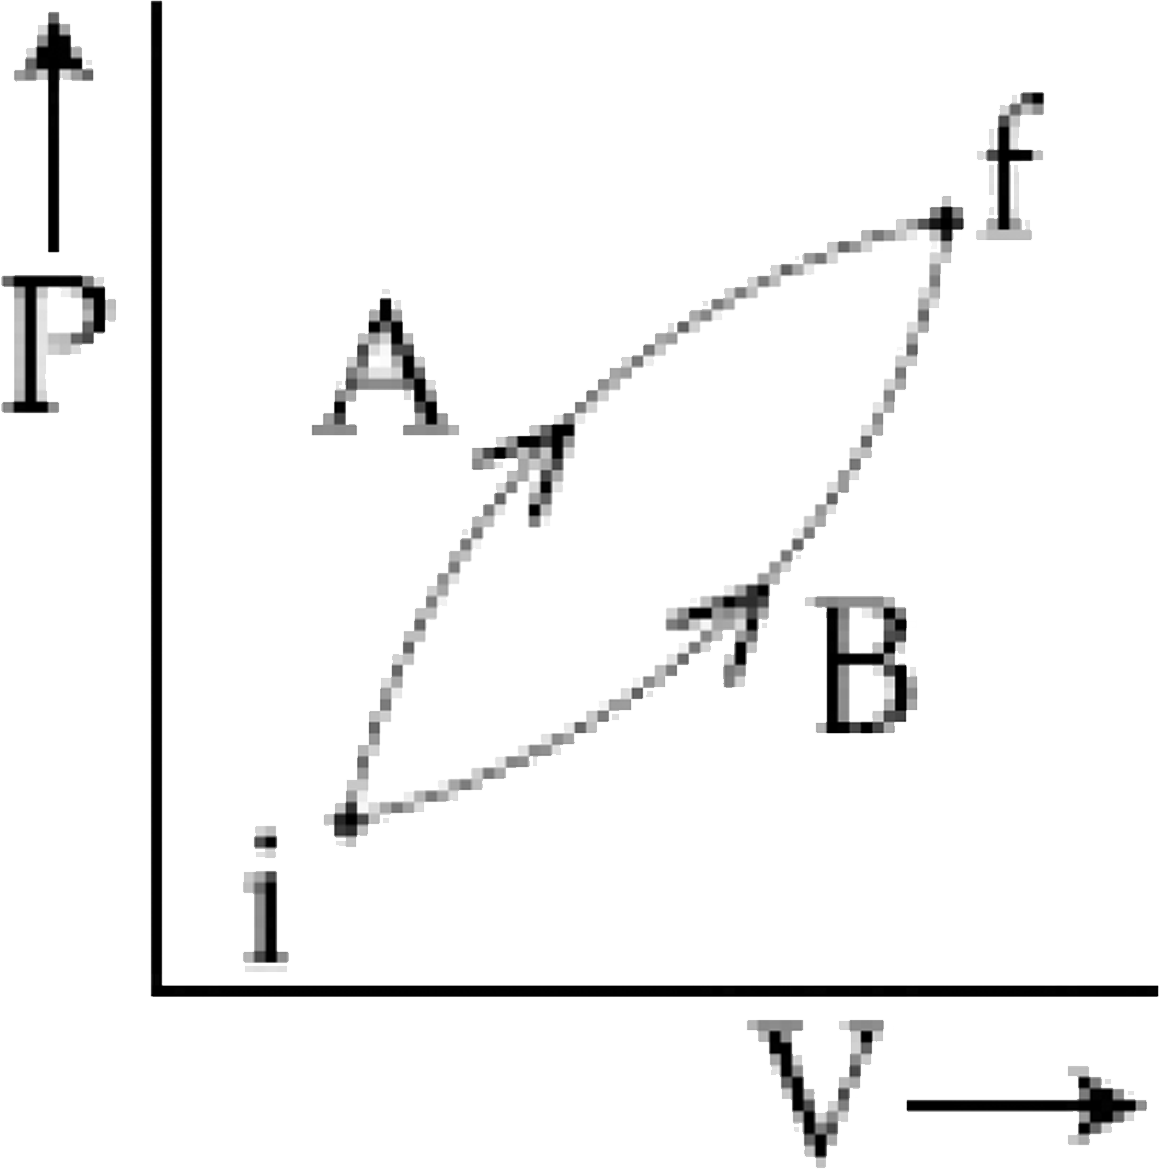
View SolutionFollowing figure shows two process A and B for a gas. If ΔQA and ΔQB are the amount of heat absorbed by the system in two case, and ΔUA and ΔUB are changes in internal energies, respectively, then :
View SolutionFollowing figure shows two process A and B for a gas. If ΔQA and ΔQB are the amount of heat absorbed by the system in two case, and ΔUA and ΔUB are changes in internal energies, respectively, then :

View SolutionAn ideal gas goes from state A to state B via three different processes as indicated in the P-V diagram -
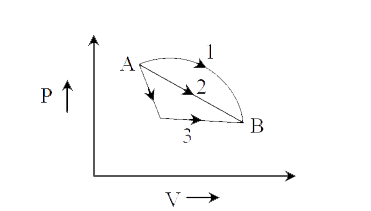
If Q1,Q2,Q3 indicate the heat absorbed by the gas along the three process and ΔU1,ΔU2,ΔU3, indicate the change in internal energy along the three processes respectively, then -
View Solution550kJcycle−1 work is done by 1 mol of an ideal gas in a cyclic process. The amount of heat absorbed by the system in one cycle is
View SolutionRefer to figure. Let ΔU1 and ΔU2 be the changes in internal energy of the system in the processes A and B. then
View SolutionA system goes from A and B via two processes. I and II as shown in figure. If ΔU1andΔU2 are the changes in internal energies in the processes I and II respectively, then
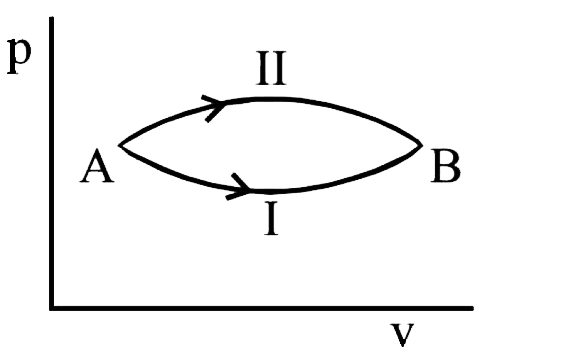
View SolutionA system goes from A and B via two processes. I and II as shown in figure. If ΔU1andΔU2 are the changes in internal energies in the processes I and II respectively, then

View SolutionA system goes from A and B via two processes. I and II as shown in figure. If ΔU1andΔU2 are the changes in internal energies in the processes I and II respectively, then

View SolutionIn a process, 701J of heat is absorbed by a system and 394J of work is done by the system. What is the change in internal energy for the process?
View Solution
