Ellingham diagram represents change of
change of △G with temperature
change of △H with temperatrue
change of △G with pressure
change of (△G−T△S) with temperature
The correct Answer is:A
Ellingham diagram represents change in value of ΔG with temperature (in K).
Topper's Solved these Questions
Similar Questions
The given diagram represents

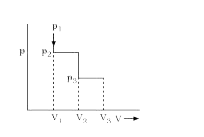
View SolutionThe following diagram represents the (p-V) changes of gas. Thus, total work done is:

View SolutionWhat does the following diagram represent ?

View SolutionWhich one of the following diagrams represents the placentation in Dianthus
View SolutionWhich of the following diagram represents axile placentation?
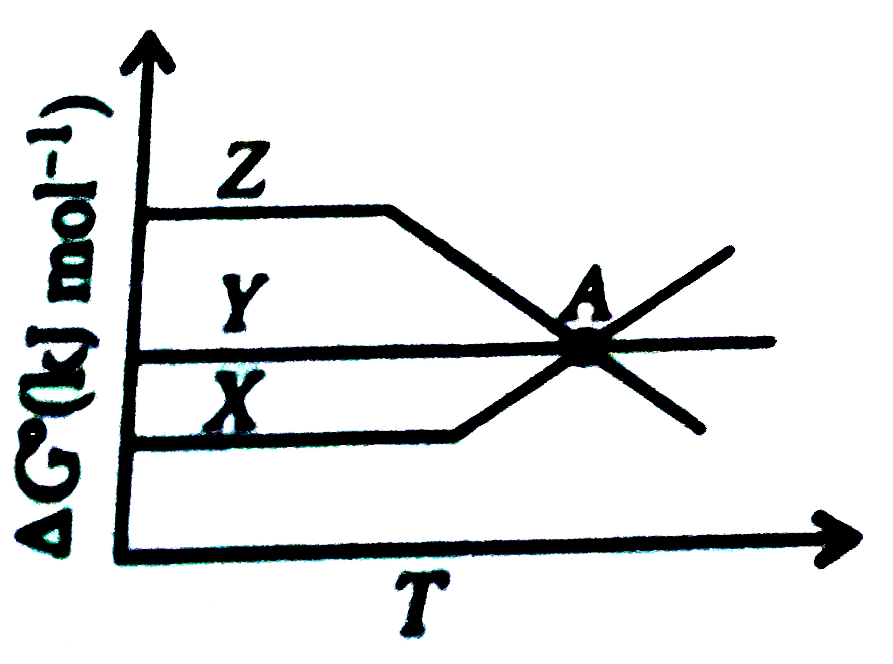
View SolutionIn the following Ellingham diagram ,X, Y and Z represent graphs for metal oxides . Select the correct option before point A.

View SolutionWith respect to an ore, Ellingham diagram helps to predict the feasiblity of its
View SolutionEllingham diagrams are plots of ΔG∘1 Vs T for the formation of
View SolutionDraw the Ellingham diagram for the formation of carbon monoxide. What happens to the stability of carbon monoxide with the increase in temperature ?
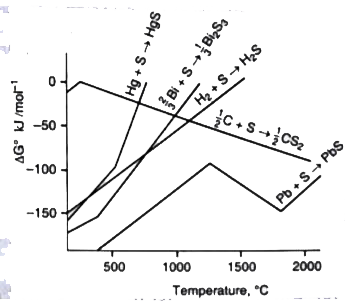
View SolutionThe Ellingham diagram for a number of metallic sulphides is shown below.

Which sulphide occurs to minimum extent in nature ?
View Solution

