Following table shows the amount of sugar production (in lac tons) for the years 1971 to 1982.

Fit a trend line by the method of least squares.
The correct Answer is:y=3.08+0.25x
Topper's Solved these Questions
- QUESTION BANK 2021Book:NAVNEET PUBLICATION - MAHARASHTRA BOARDChapter:QUESTION BANK 2021Exercise:Part II 4. TIME SERIES (V) Activity based questions)
Explore 4 Videos
- QUESTION BANK 2021Book:NAVNEET PUBLICATION - MAHARASHTRA BOARDChapter:QUESTION BANK 2021Exercise:Part II 5. INDEX NUMBERS (I) Choose the correct alternative.)
Explore 9 Videos
- QUESTION BANK 2021Book:NAVNEET PUBLICATION - MAHARASHTRA BOARDChapter:QUESTION BANK 2021Exercise:Part II 4. TIME SERIES (III) State whether each of the following is True or False.)
Explore 5 Videos
- PROBABILITY DISTRIBUTIONBook:NAVNEET PUBLICATION - MAHARASHTRA BOARDChapter:PROBABILITY DISTRIBUTIONExercise:MULTIPLE CHOICE QUESTIONS
Explore 9 Videos
- THREE DIMENSIONAL GEOMETRY Book:NAVNEET PUBLICATION - MAHARASHTRA BOARDChapter:THREE DIMENSIONAL GEOMETRY Exercise:MULTIPLE CHOICE QUESTIONS
Explore 8 Videos
Similar Questions
The following table gives the production of steel (in millions of tons) for years 1976 to 1986.

Fit a trend line by the method of least squares. Also, obtain the trend value for the year 1990.
View SolutionFollowing table shows the all India infant mortality rates (per ‘000) for years 1980 to 2000.

Fit a trend line by the method of least squares.
View Solution
Knowledge Check
The following table shows the productions of food-grains (in million tons) in a state for the period 1999 - 2000 to 2003 - 2004. Read the table and the questions.
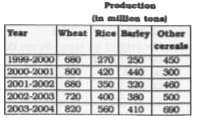
In the year 2003 - 2004, the increase in production was maximum over the previous year for :ARiceBBarleyCOther cerealsDWheatThe following table shows the productions of food-grains (in million tons) in a state for the period 1999 - 2000 to 2003 - 2004. Read the table and the questions.
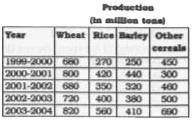
The different of average production of rice and the average production of barley over the years is (in million tonnes) :A50B60C80D40The following table shows the productions of food-grains (in million tons) in a state for the period 1999 - 2000 to 2003 - 2004. Read the table and the questions.
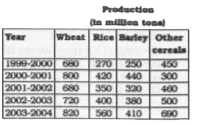
In 2002 - 2003, the percentage increase in the production of barley as compared to the previous was :A14.20%B17.85%C18.75%D7.90%
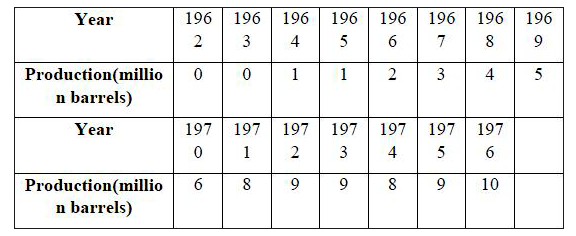
The following table shows the production of gasoline in U.S.A. for the years 1962 to 1976. Obtain trend values for the above data using 5-yearly moving averages.
View SolutionDirection :- The following table shows the production of food grains (in million tonnes) in a state for the period 1988 to 1992. Read the table and answer the following questions.
During 1990, the percentage of decrease in production of maize as against the previous year was
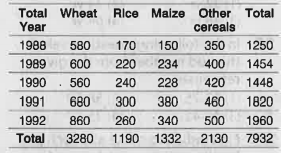
View SolutionThe following table shows the productions of food-grains (in million tons) in a state for the period 1999-2000 to 2003-2004. Read the table and answer the questions
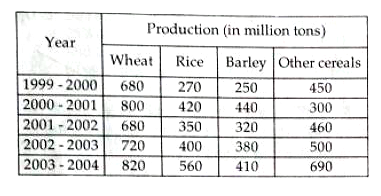
In the year 2003-2004, the increase in production was maximum over the previous year for
View SolutionThe following table shows the productions of food-grains (in million tons) in a state for the period 1999-2000 to 2003-2004. Read the table and answer the questions
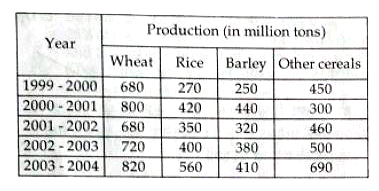
The difference of average production of rice and the average production of barley over the years is
View SolutionThe following table shows the productions of food-grains (in million tons) in a state for the period 1999 - 2000 to 2003 - 2004. Read the table and the questions.
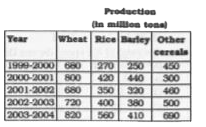
During the period 1999 - 2000 to 2003 - 2004, x per cent of the total production is production of wheat. The value of x is about :
View Solution

