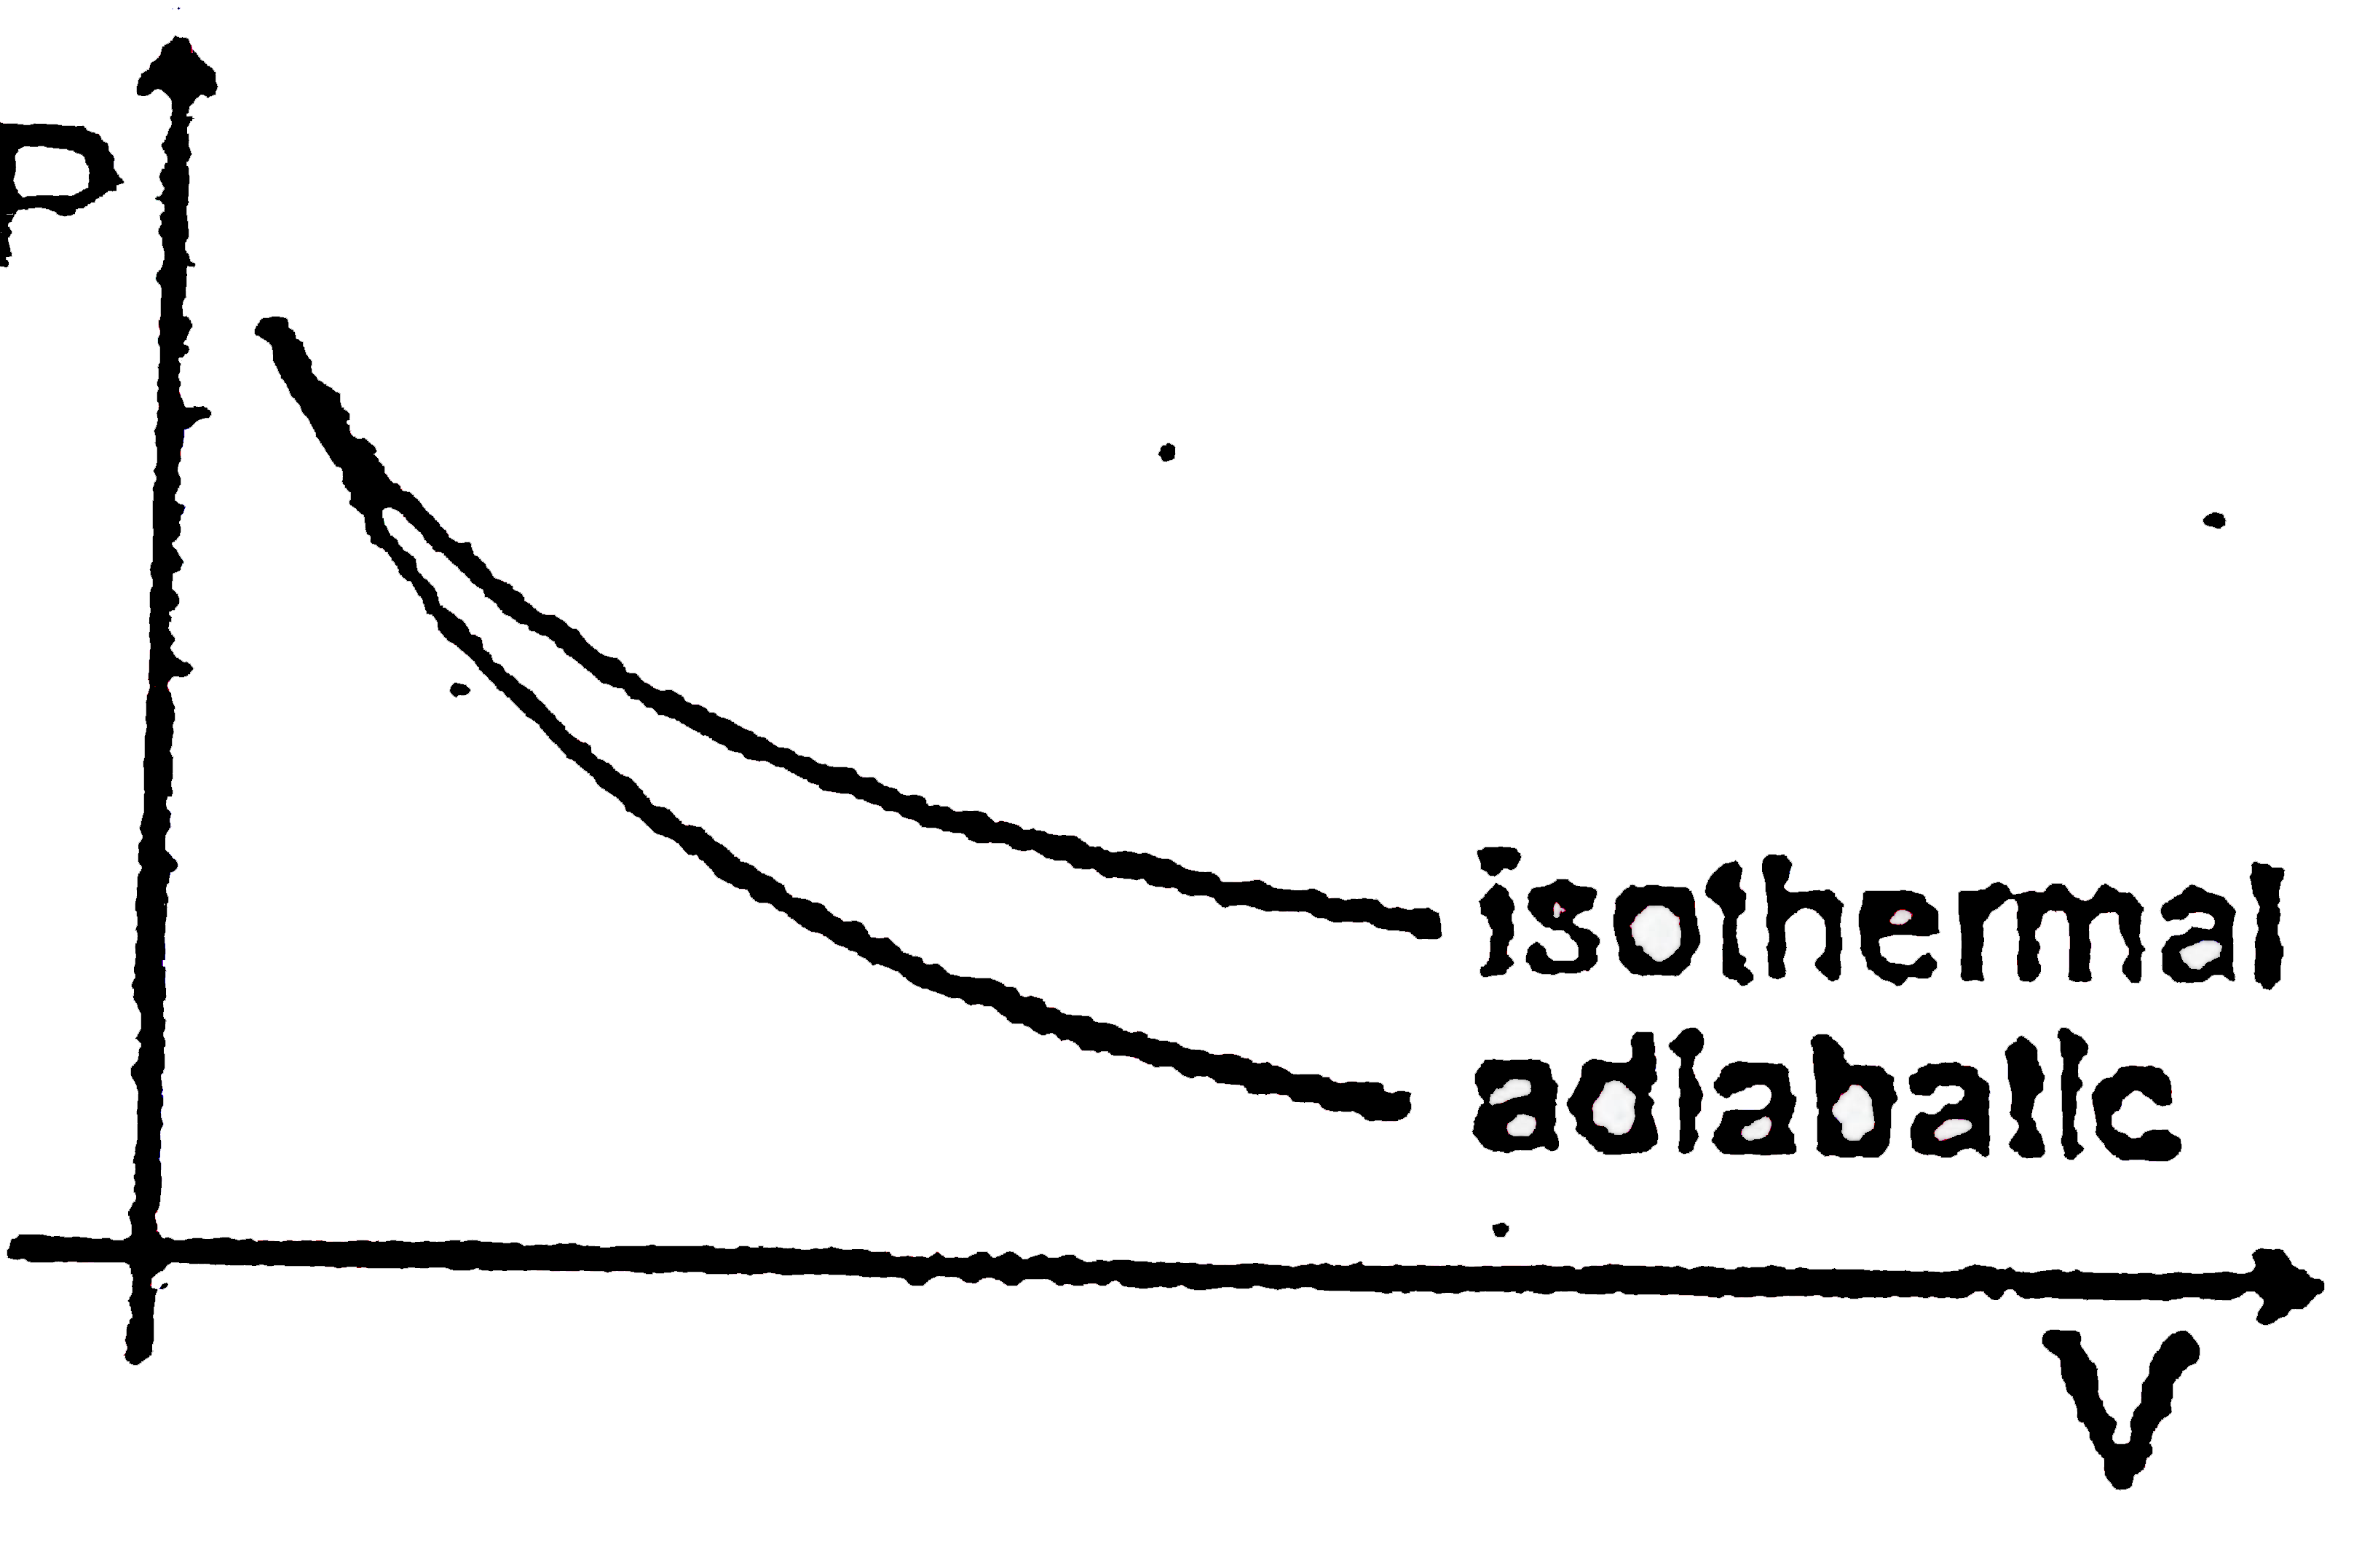
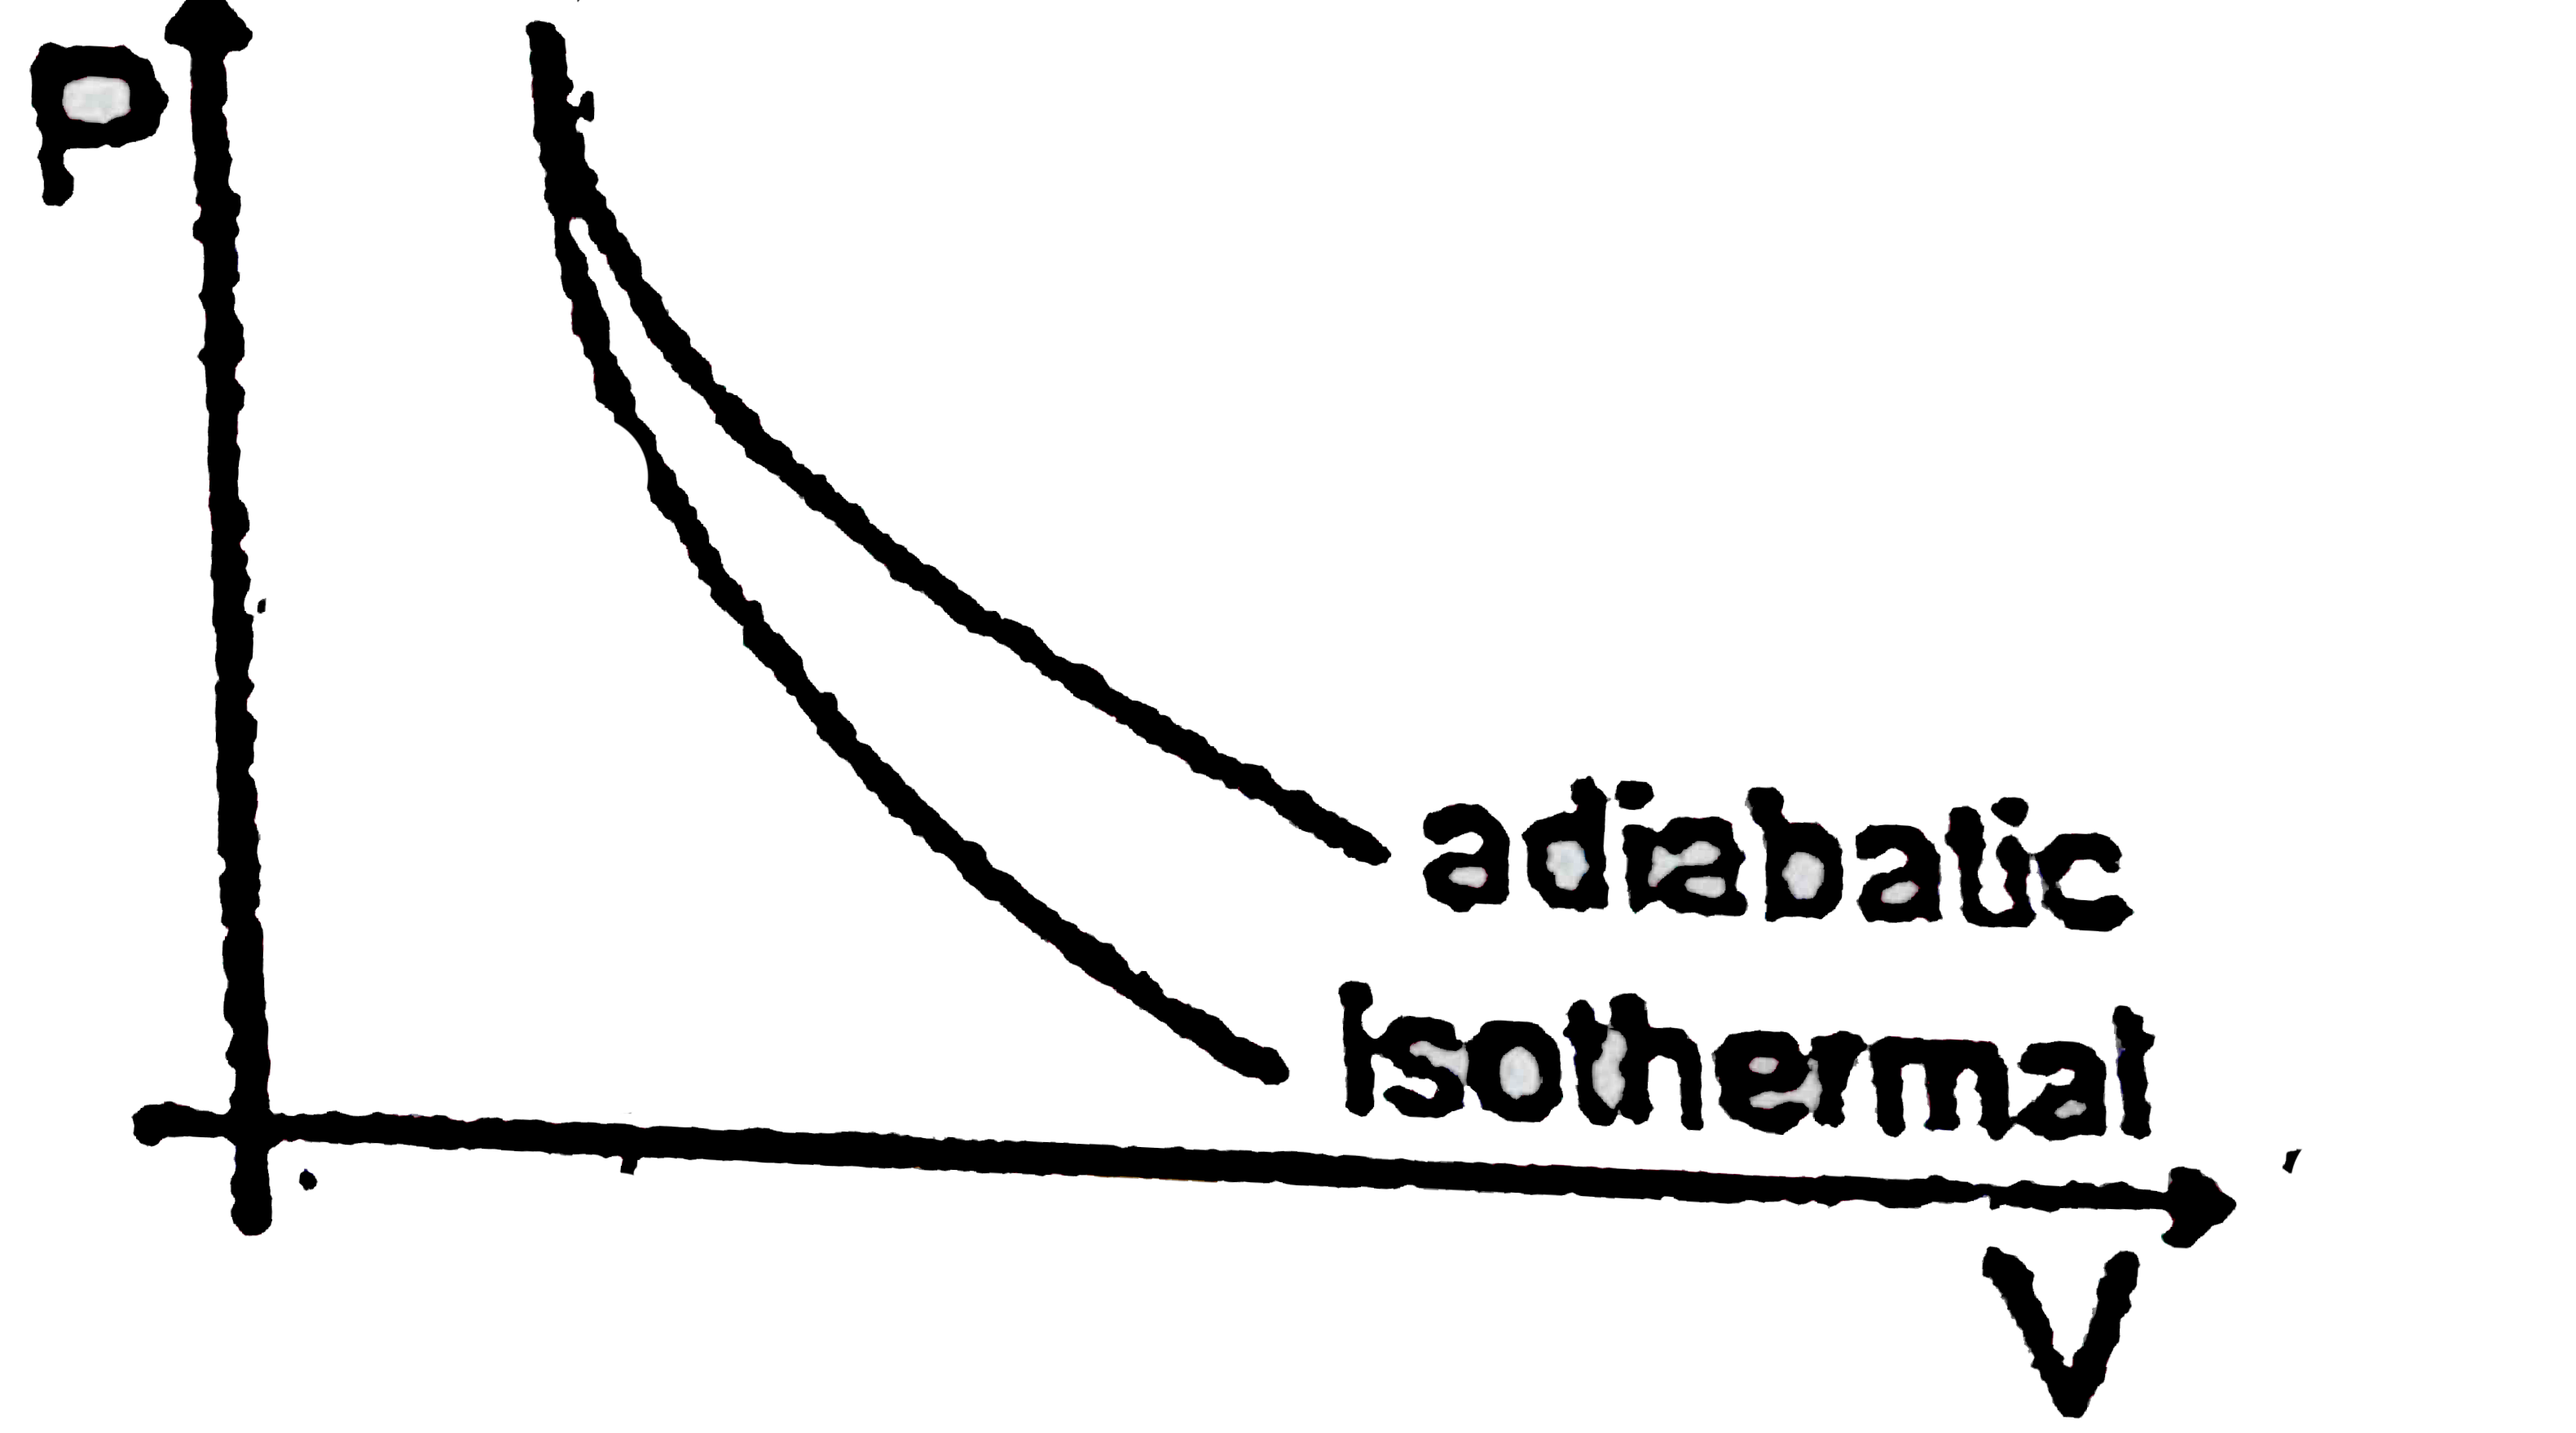
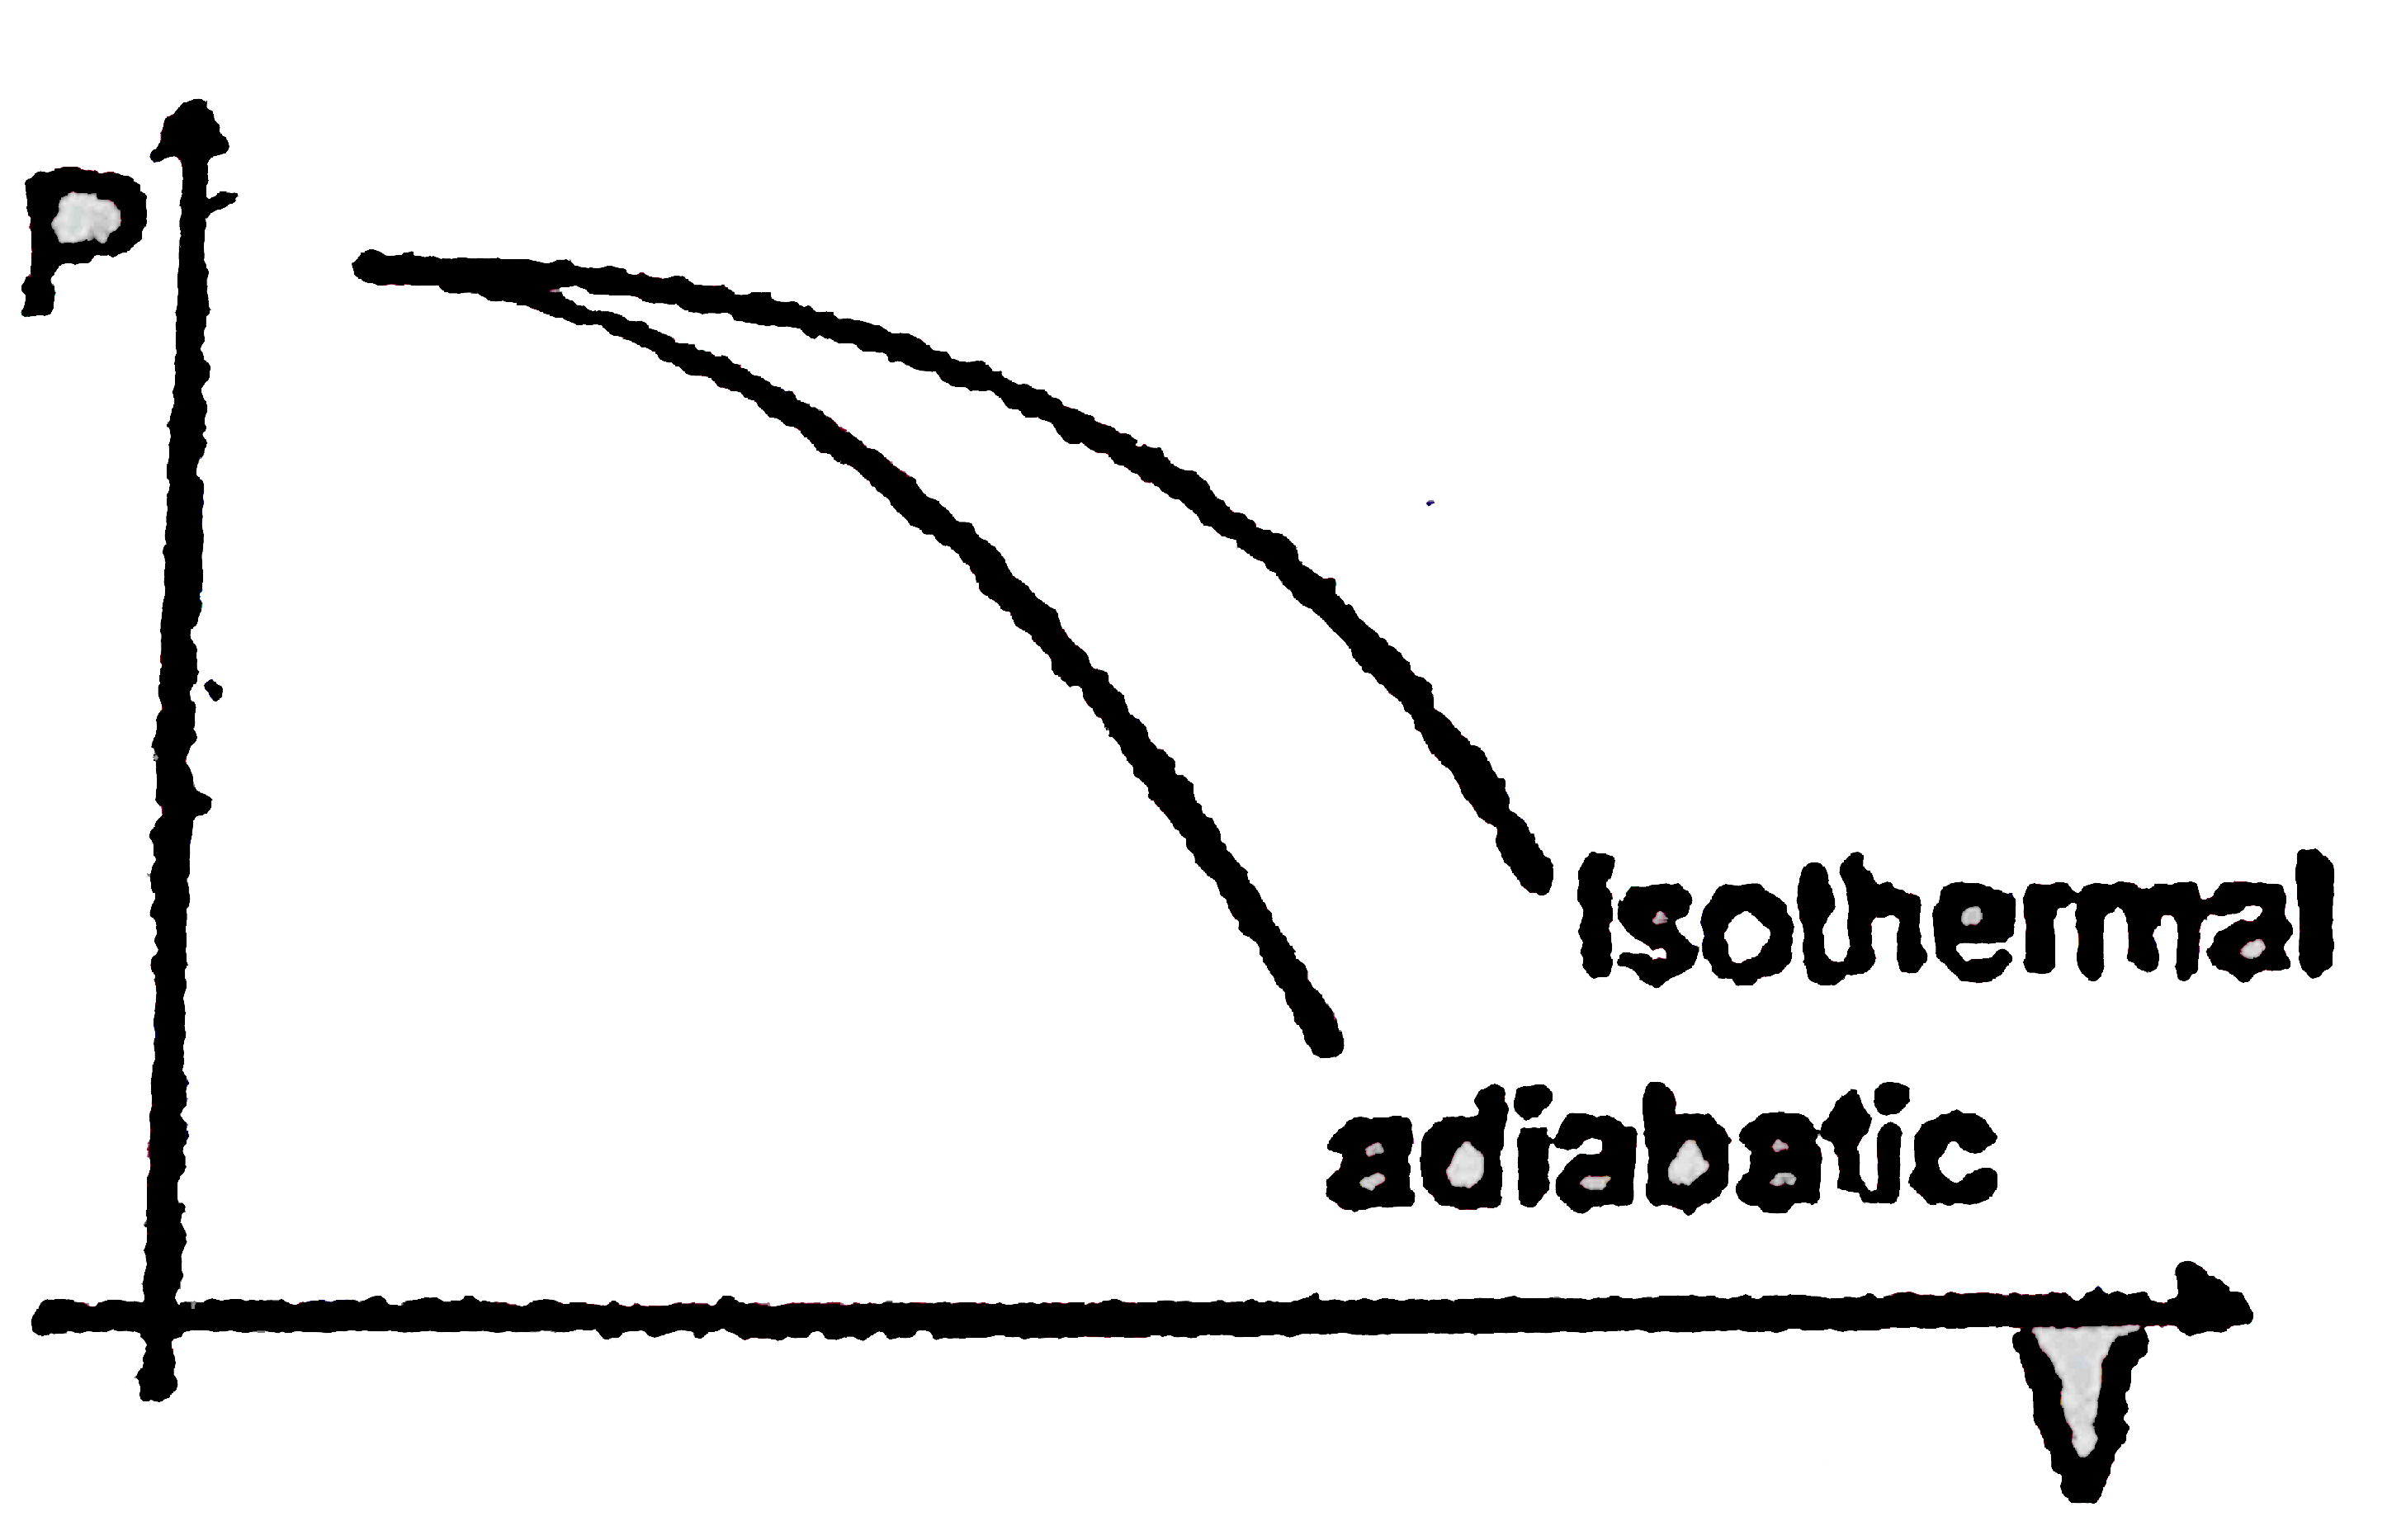
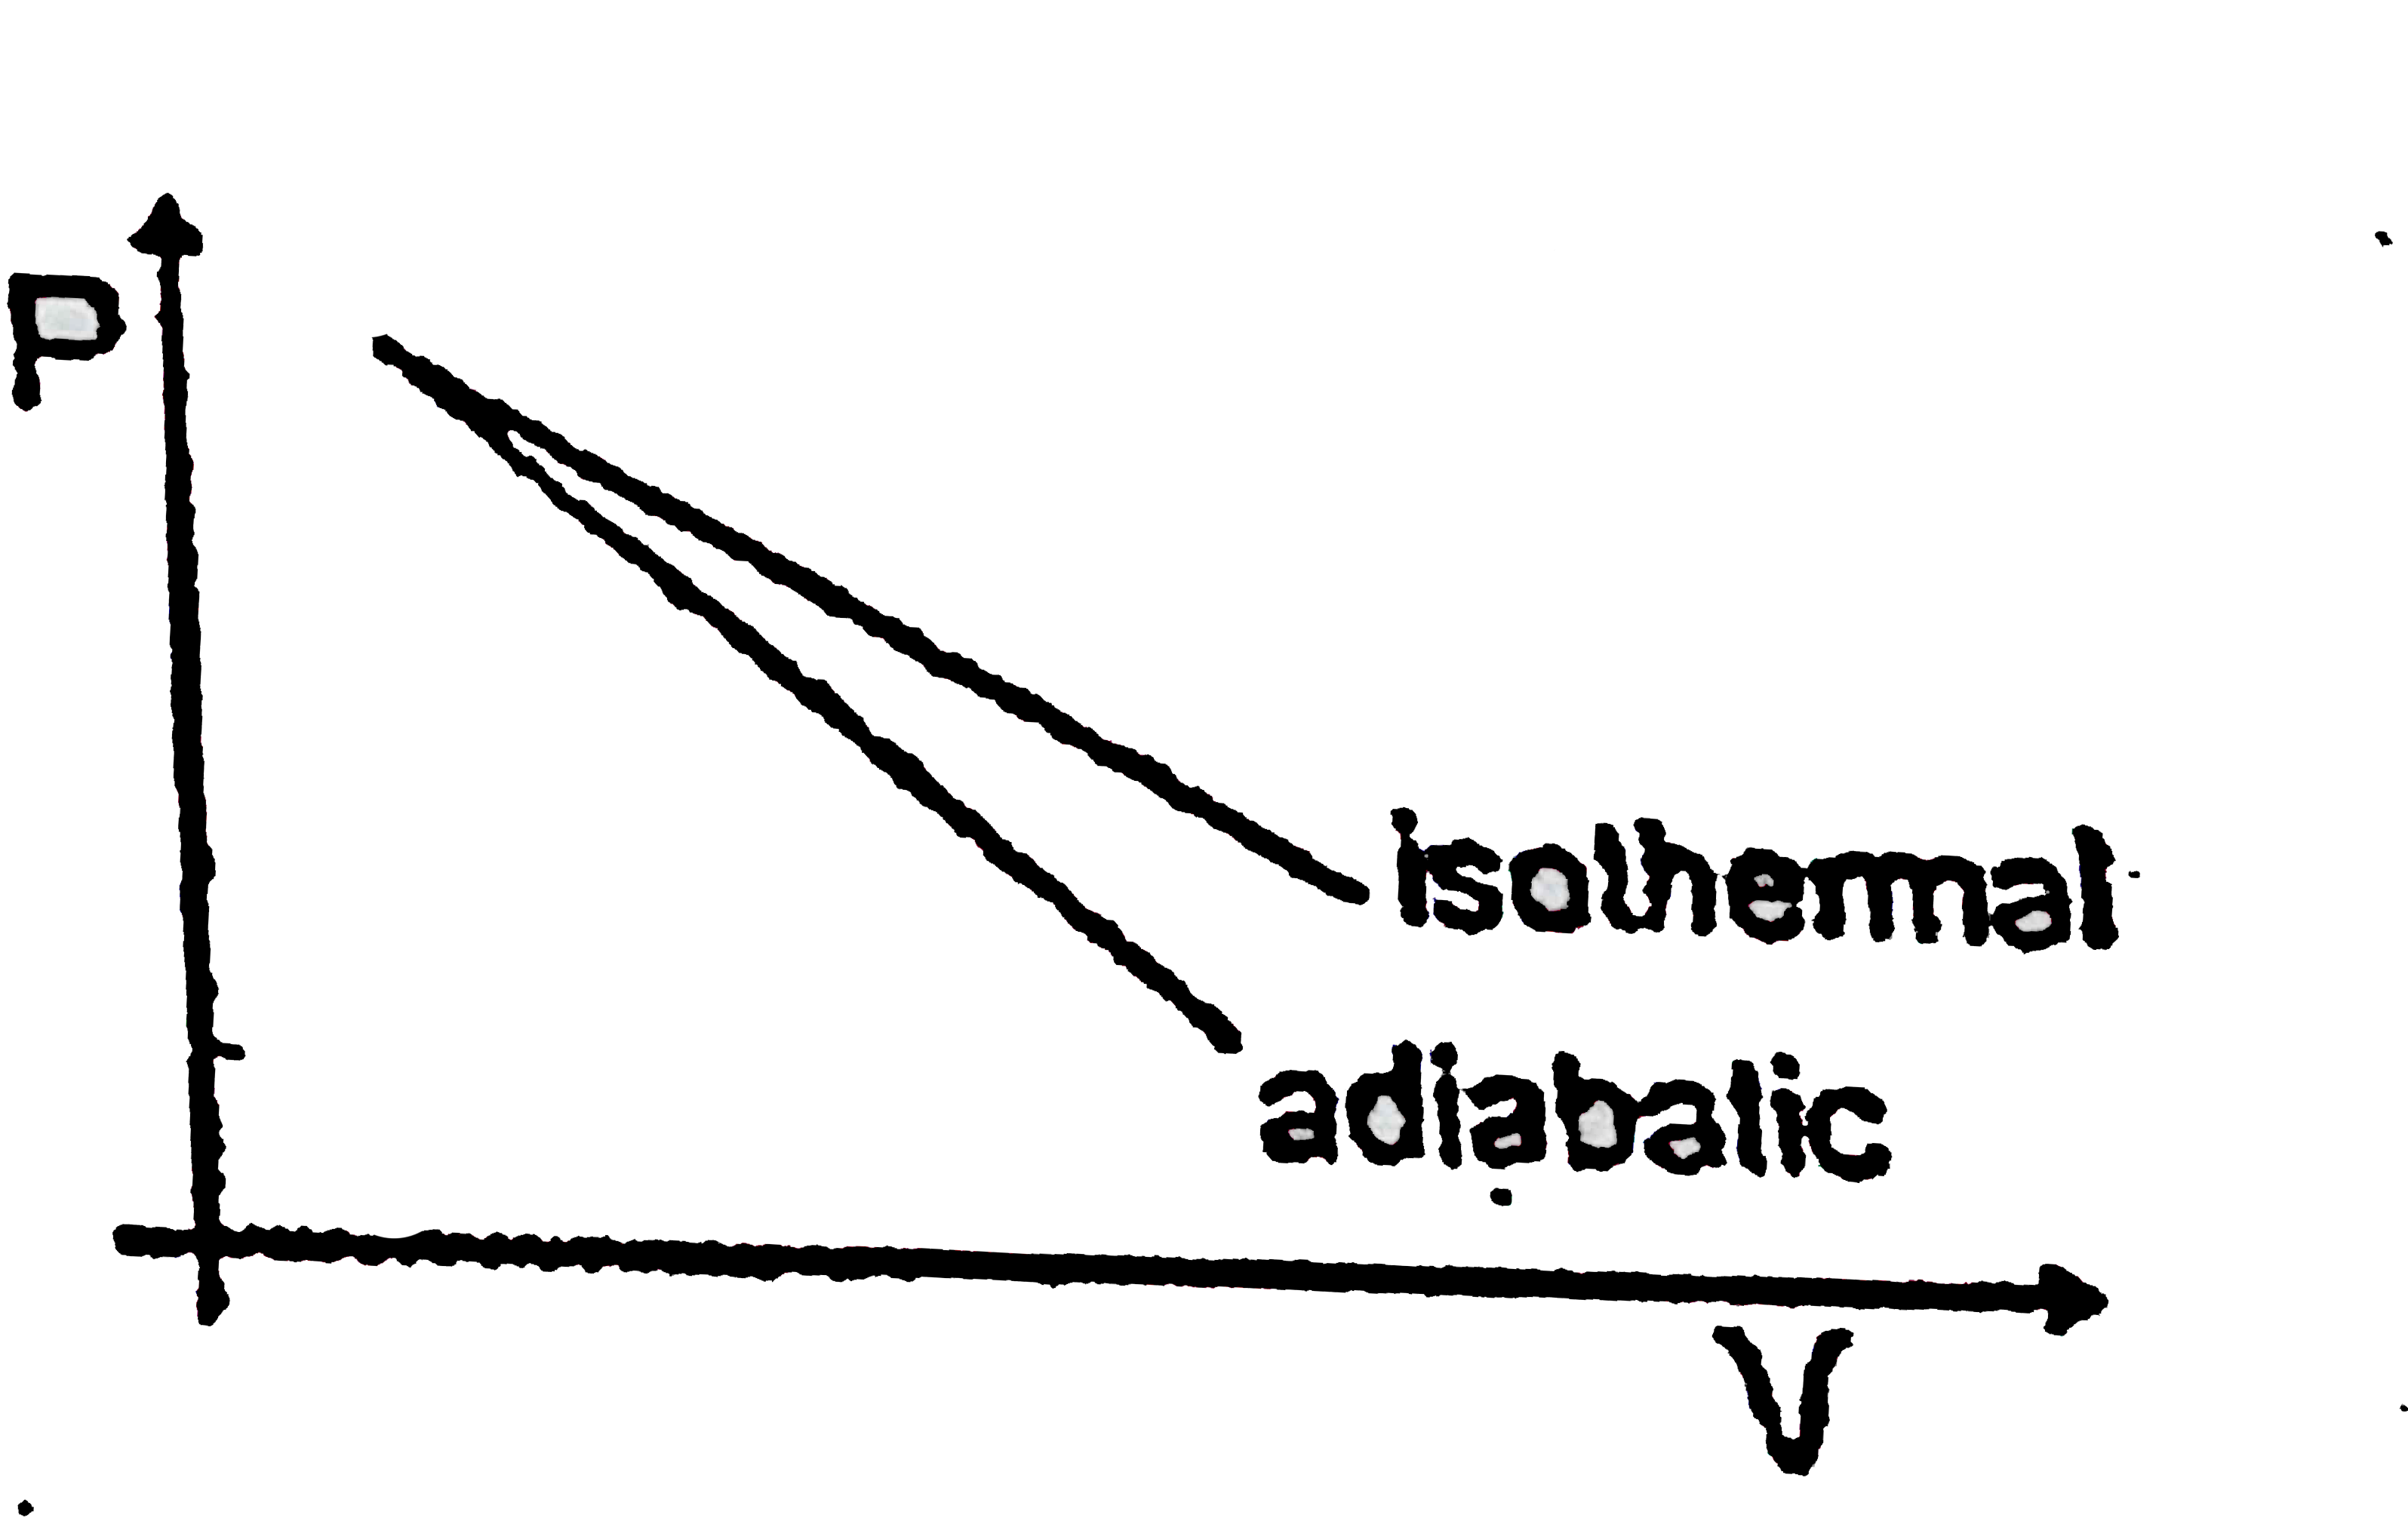
The correct figure representing isothermal and adiabatic expansions of an ideal gas from a particular initial state is :
A

B

C

D

Video Solution
Text Solution
The correct Answer is:1
Stops of adiabatic curve is greater than isothermal curve.
|
Topper's Solved these Questions
- TEST PAPERSBOOK - RESONANCE ENGLISHCHAPTER - TEST PAPERSEXERCISE - Pt-02
30 Videos
- TEST PAPERSBOOK - RESONANCE ENGLISHCHAPTER - TEST PAPERSEXERCISE - PT-03
28 Videos
- TEST PAPERSBOOK - RESONANCE ENGLISHCHAPTER - TEST PAPERSEXERCISE - Chemistry
701 Videos
- SURFACE CHEMISTRYBOOK - RESONANCE ENGLISHCHAPTER - SURFACE CHEMISTRYEXERCISE - Section - 5
1 Videos
- TEST SERIESBOOK - RESONANCE ENGLISHCHAPTER - TEST SERIESEXERCISE - CHEMISTRY
50 Videos
Similar Questions
Knowledge Check
In an adiabatic expansion of an ideal gas -
A(a) W=−ΔUB(b) W=ΔUC(c) ΔU=0D(d) W=0
Adiabatic expansion of an ideal gas is accompanied by
View SolutionDuring an adiabatic reversibly expansion of an ideal gas
View SolutionFor an isothermal expansion of an ideal gas
View SolutionIn reversible isothermal expansion of an ideal gas :
View SolutionIn the isothermal expansion of an ideal gas
View SolutionFor an adiabatic expansion of an ideal gas the fractional change in its pressure is equal to
View SolutionDuring adiabatic expansion of ideal gas, which is correct ?
View Solution
