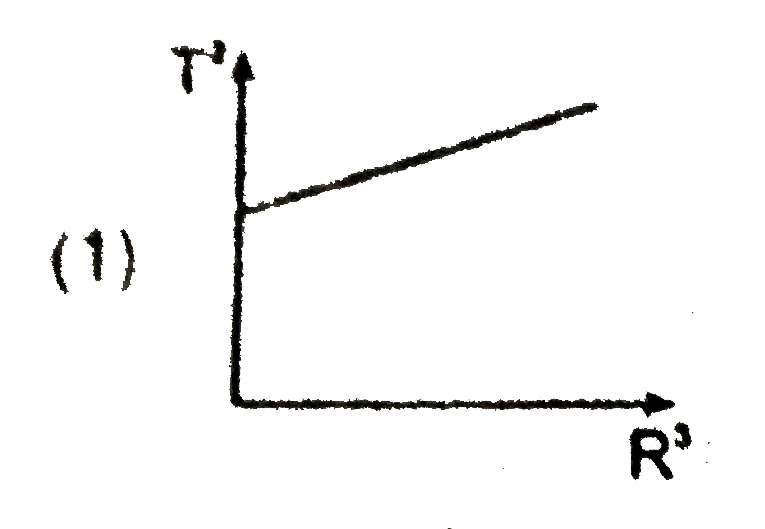
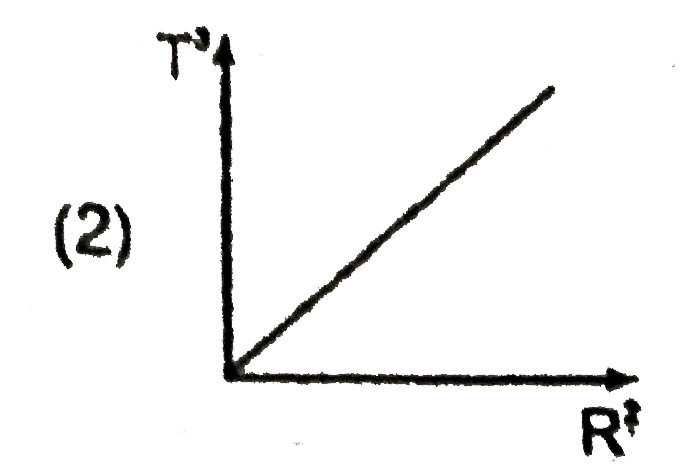
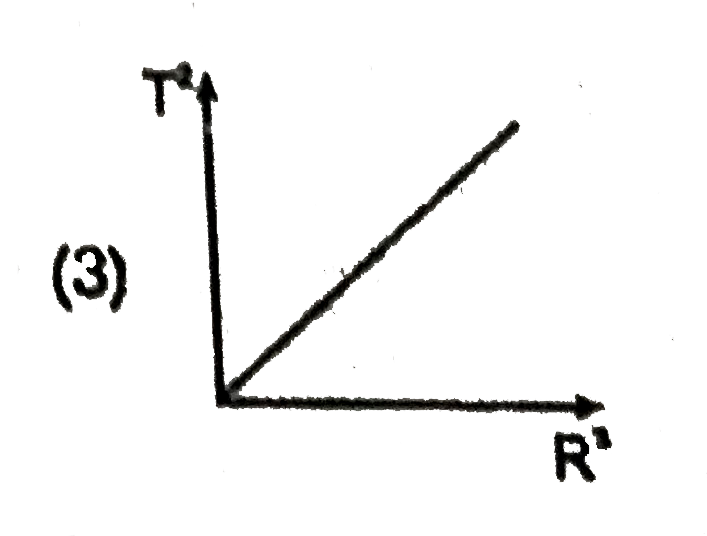
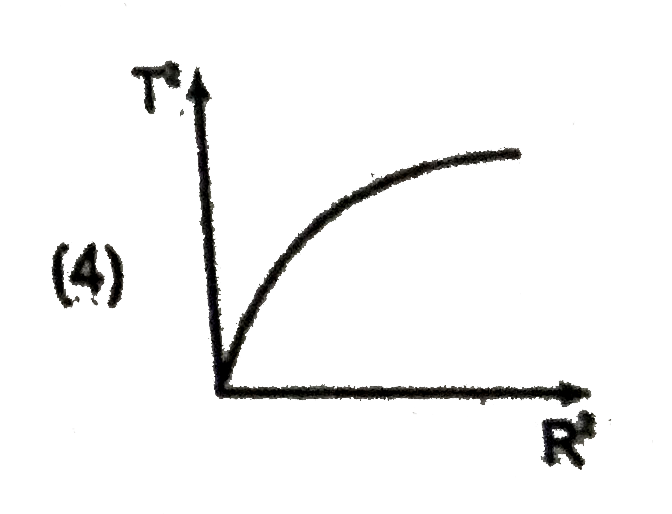
Which of the following graphs represents the motion of the planet moving about the Sun. T is the periode of revolution and r is the average distance (from centre to centre) between the sun and the planet
The correct Answer is:C
To solve the question regarding which graph represents the motion of a planet moving around the Sun, we can follow these steps:
1. Understanding Kepler's Third Law:
According to Kepler's Third Law of planetary motion, the square of the period of revolution (T) of a planet is directly proportional to the cube of the average distance (r) from the Sun. This can be mathematically expressed as:
T2∝r3
2. Formulating the Equation:
From the proportionality, we can write:
T2=k⋅r3
where k is a constant.
3. Identifying the Variables for Graphing:
In this equation, if we want to graph T2 against r3, we can rearrange the equation to:
T2=k⋅(r3)
This indicates that if we plot T2 on the y-axis and r3 on the x-axis, we should expect a straight line.
4. Characteristics of the Graph:
- The graph will have a positive slope since k is a positive constant.
- The y-intercept will be zero because when r=0, T2 must also be zero.
5. Conclusion:
Therefore, the correct graph representing the relationship between the period of revolution T and the average distance r will be a straight line passing through the origin (0,0) with a positive slope.
Final Answer:
The correct option is the graph that shows a straight line with a positive slope and passes through the origin.
---
According to Kepler's Third Law of planetary motion, the square of the period of revolution (T) of a planet is directly proportional to the cube of the average distance (r) from the Sun. This can be mathematically expressed as:
T2∝r3
From the proportionality, we can write:
T2=k⋅r3
where k is a constant.
In this equation, if we want to graph T2 against r3, we can rearrange the equation to:
T2=k⋅(r3)
This indicates that if we plot T2 on the y-axis and r3 on the x-axis, we should expect a straight line.
- The graph will have a positive slope since k is a positive constant.
- The y-intercept will be zero because when r=0, T2 must also be zero.
Therefore, the correct graph representing the relationship between the period of revolution T and the average distance r will be a straight line passing through the origin (0,0) with a positive slope.
The correct option is the graph that shows a straight line with a positive slope and passes through the origin.
Topper's Solved these Questions
Similar Questions
Knowledge Check
Which of the following x-t graphs does not represent periodic motion?
A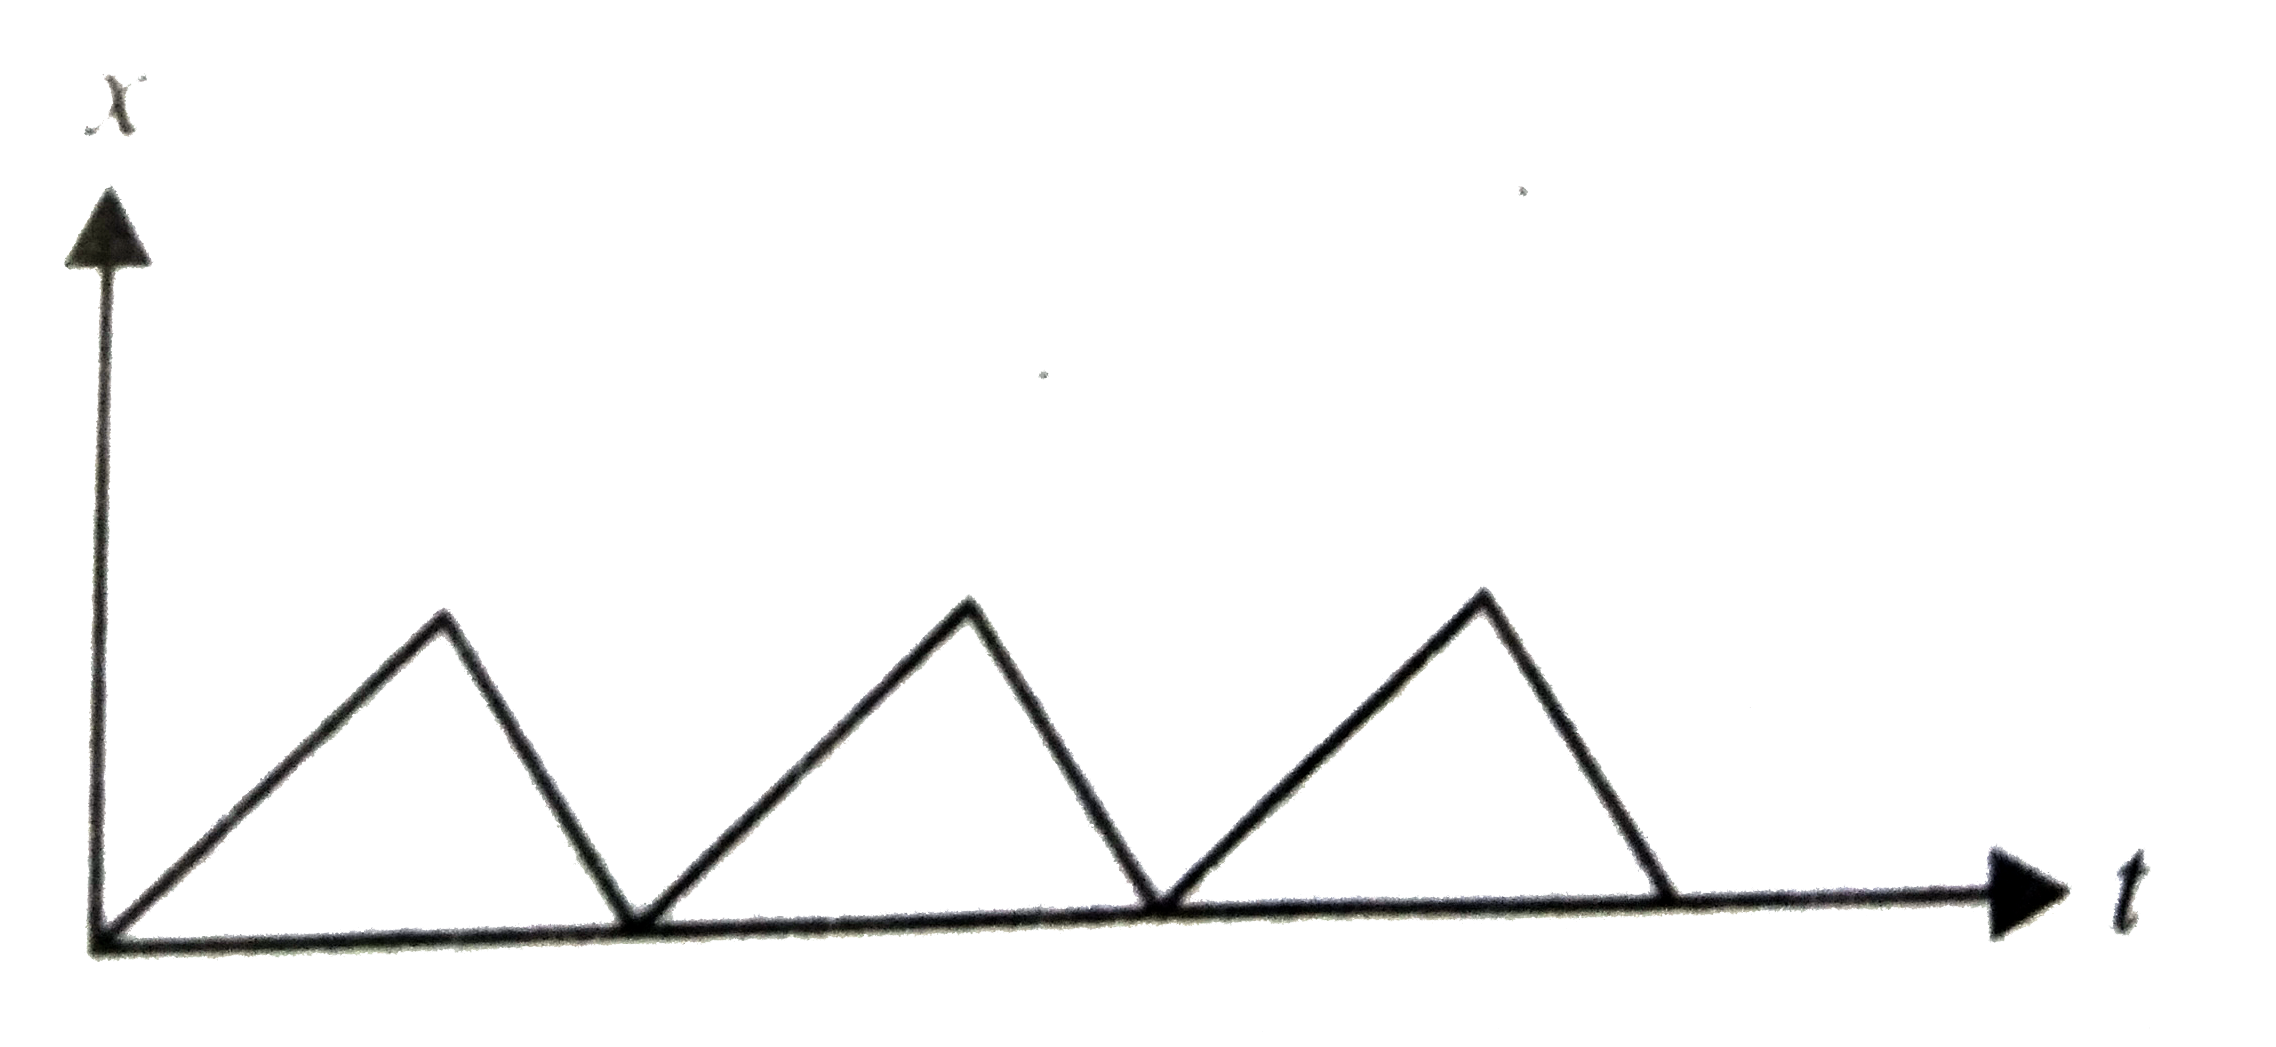 B
B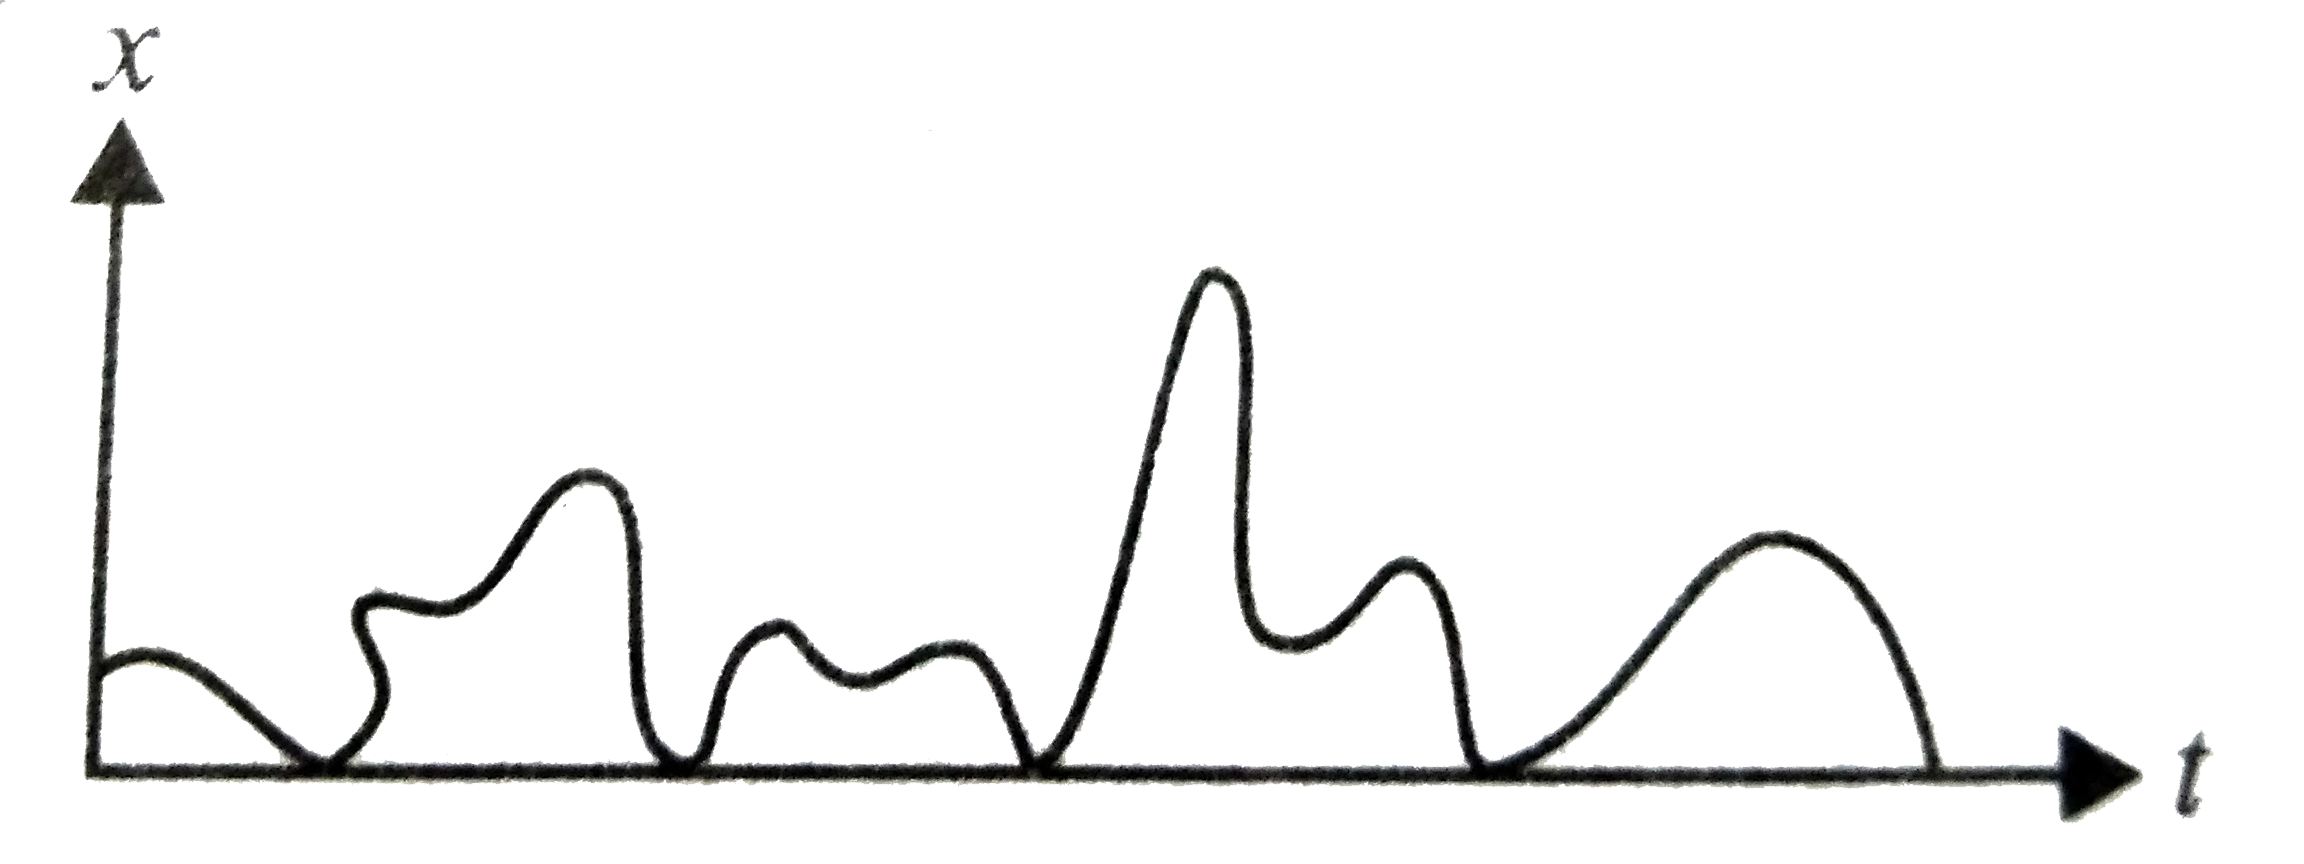 C
C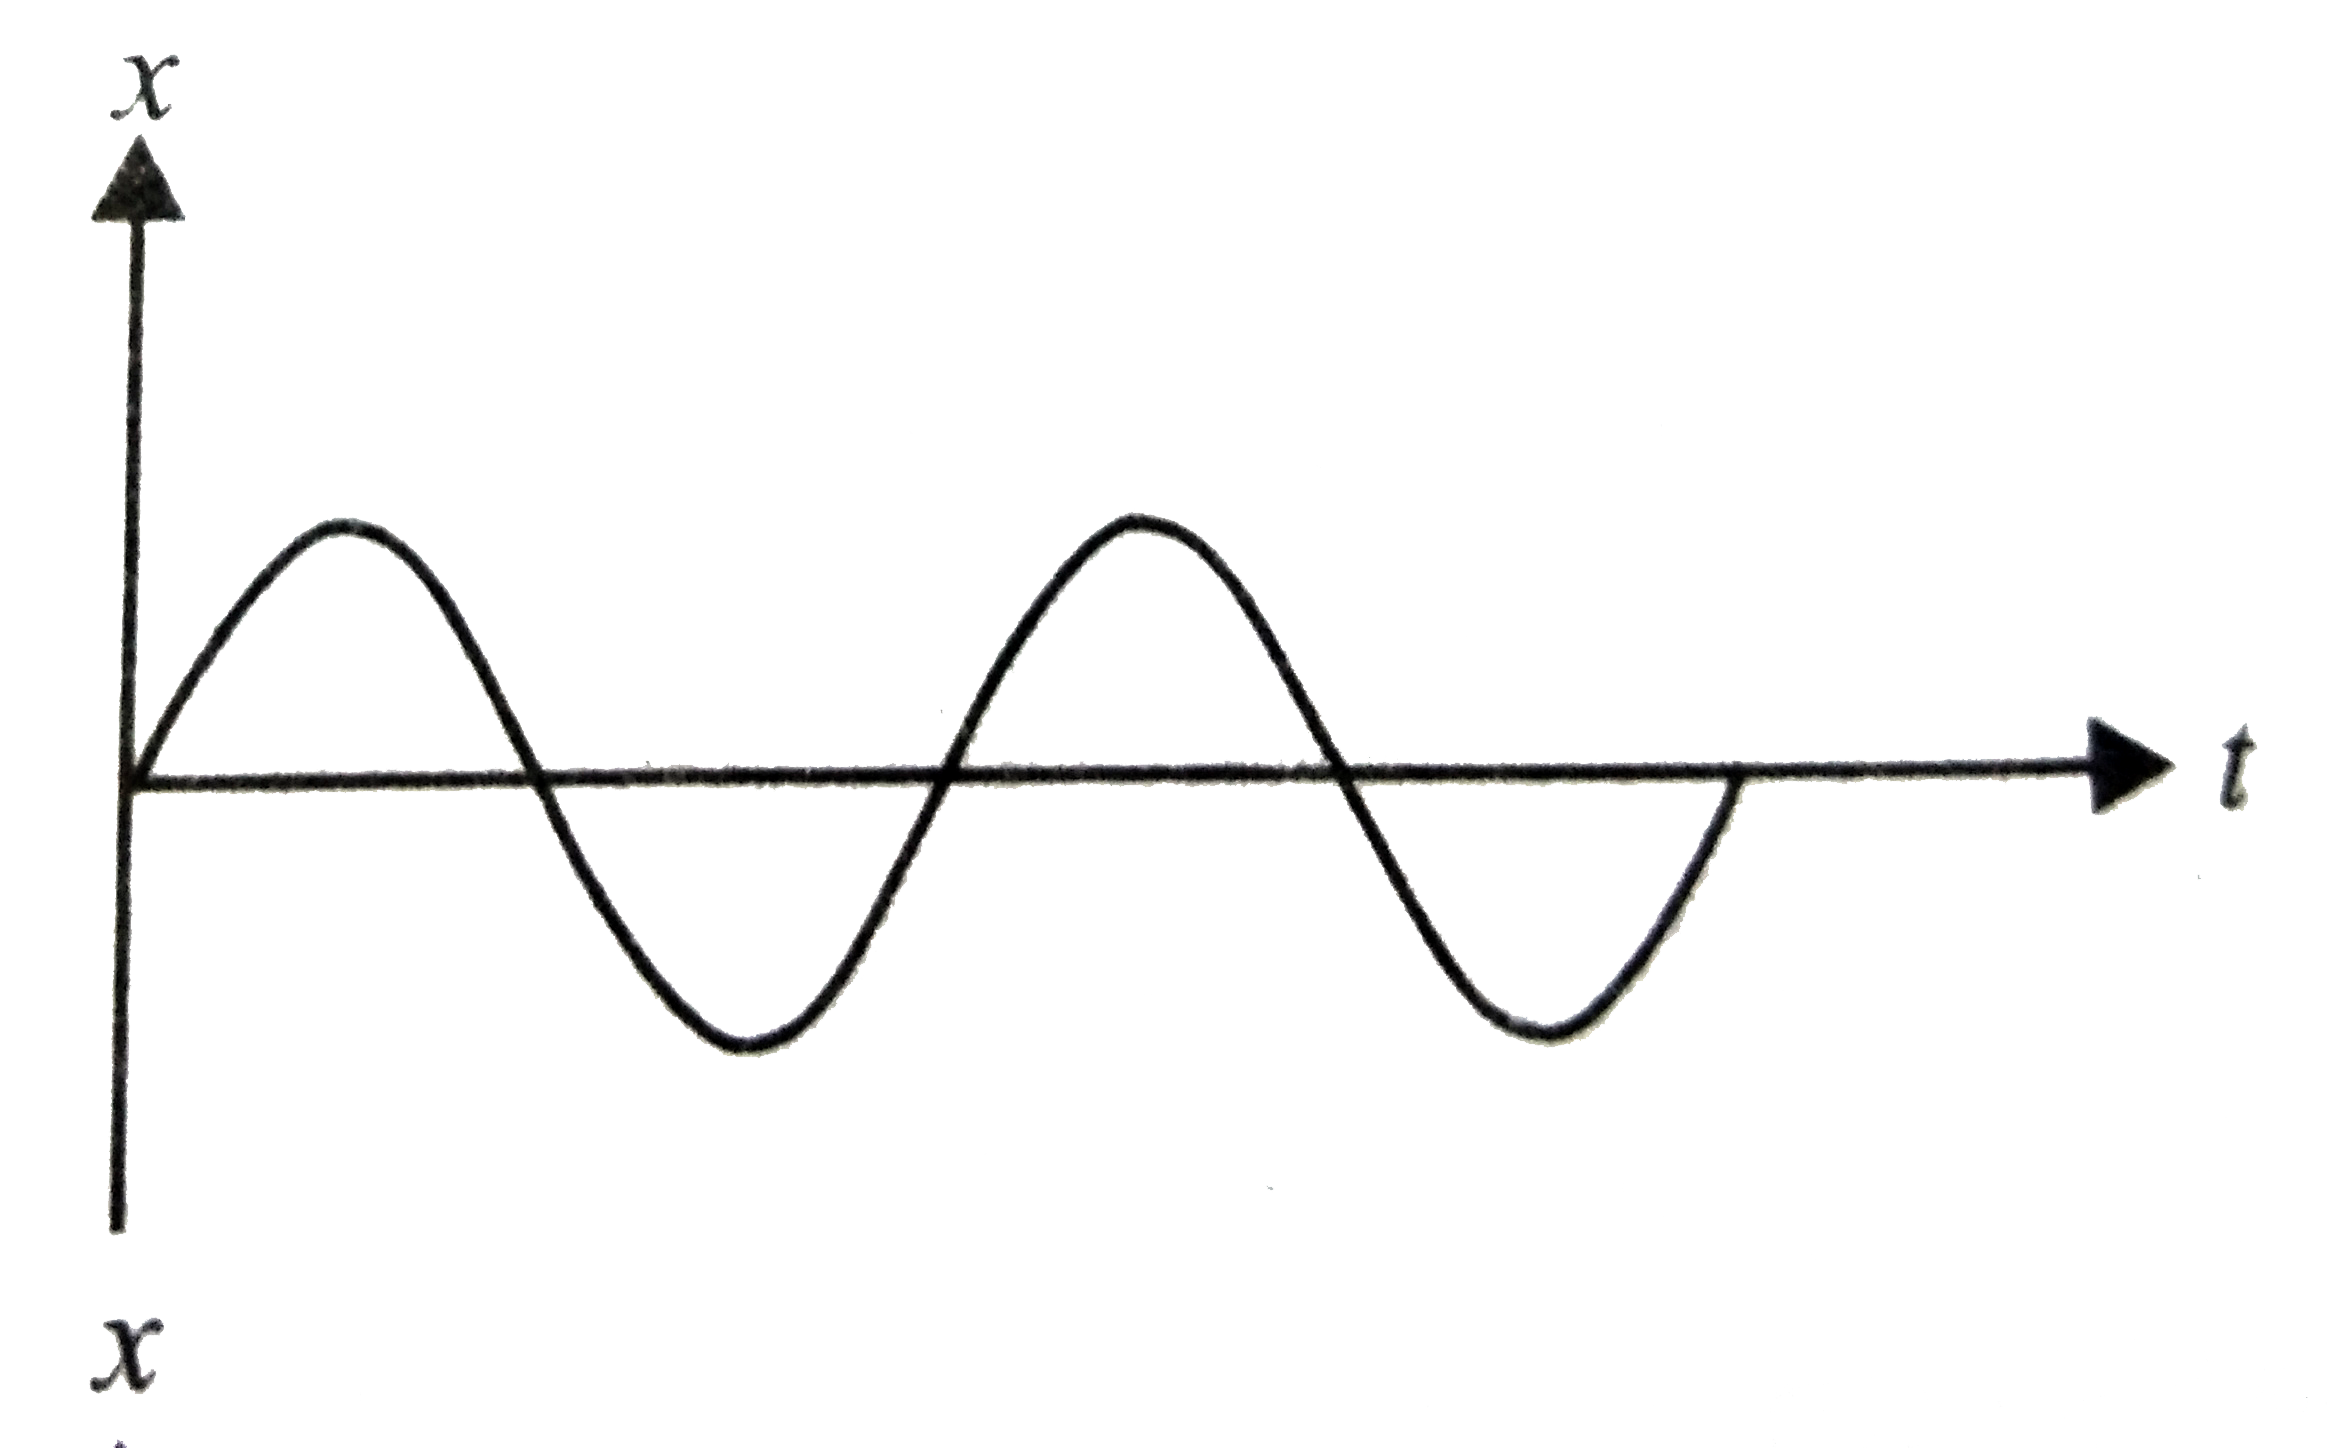 D
D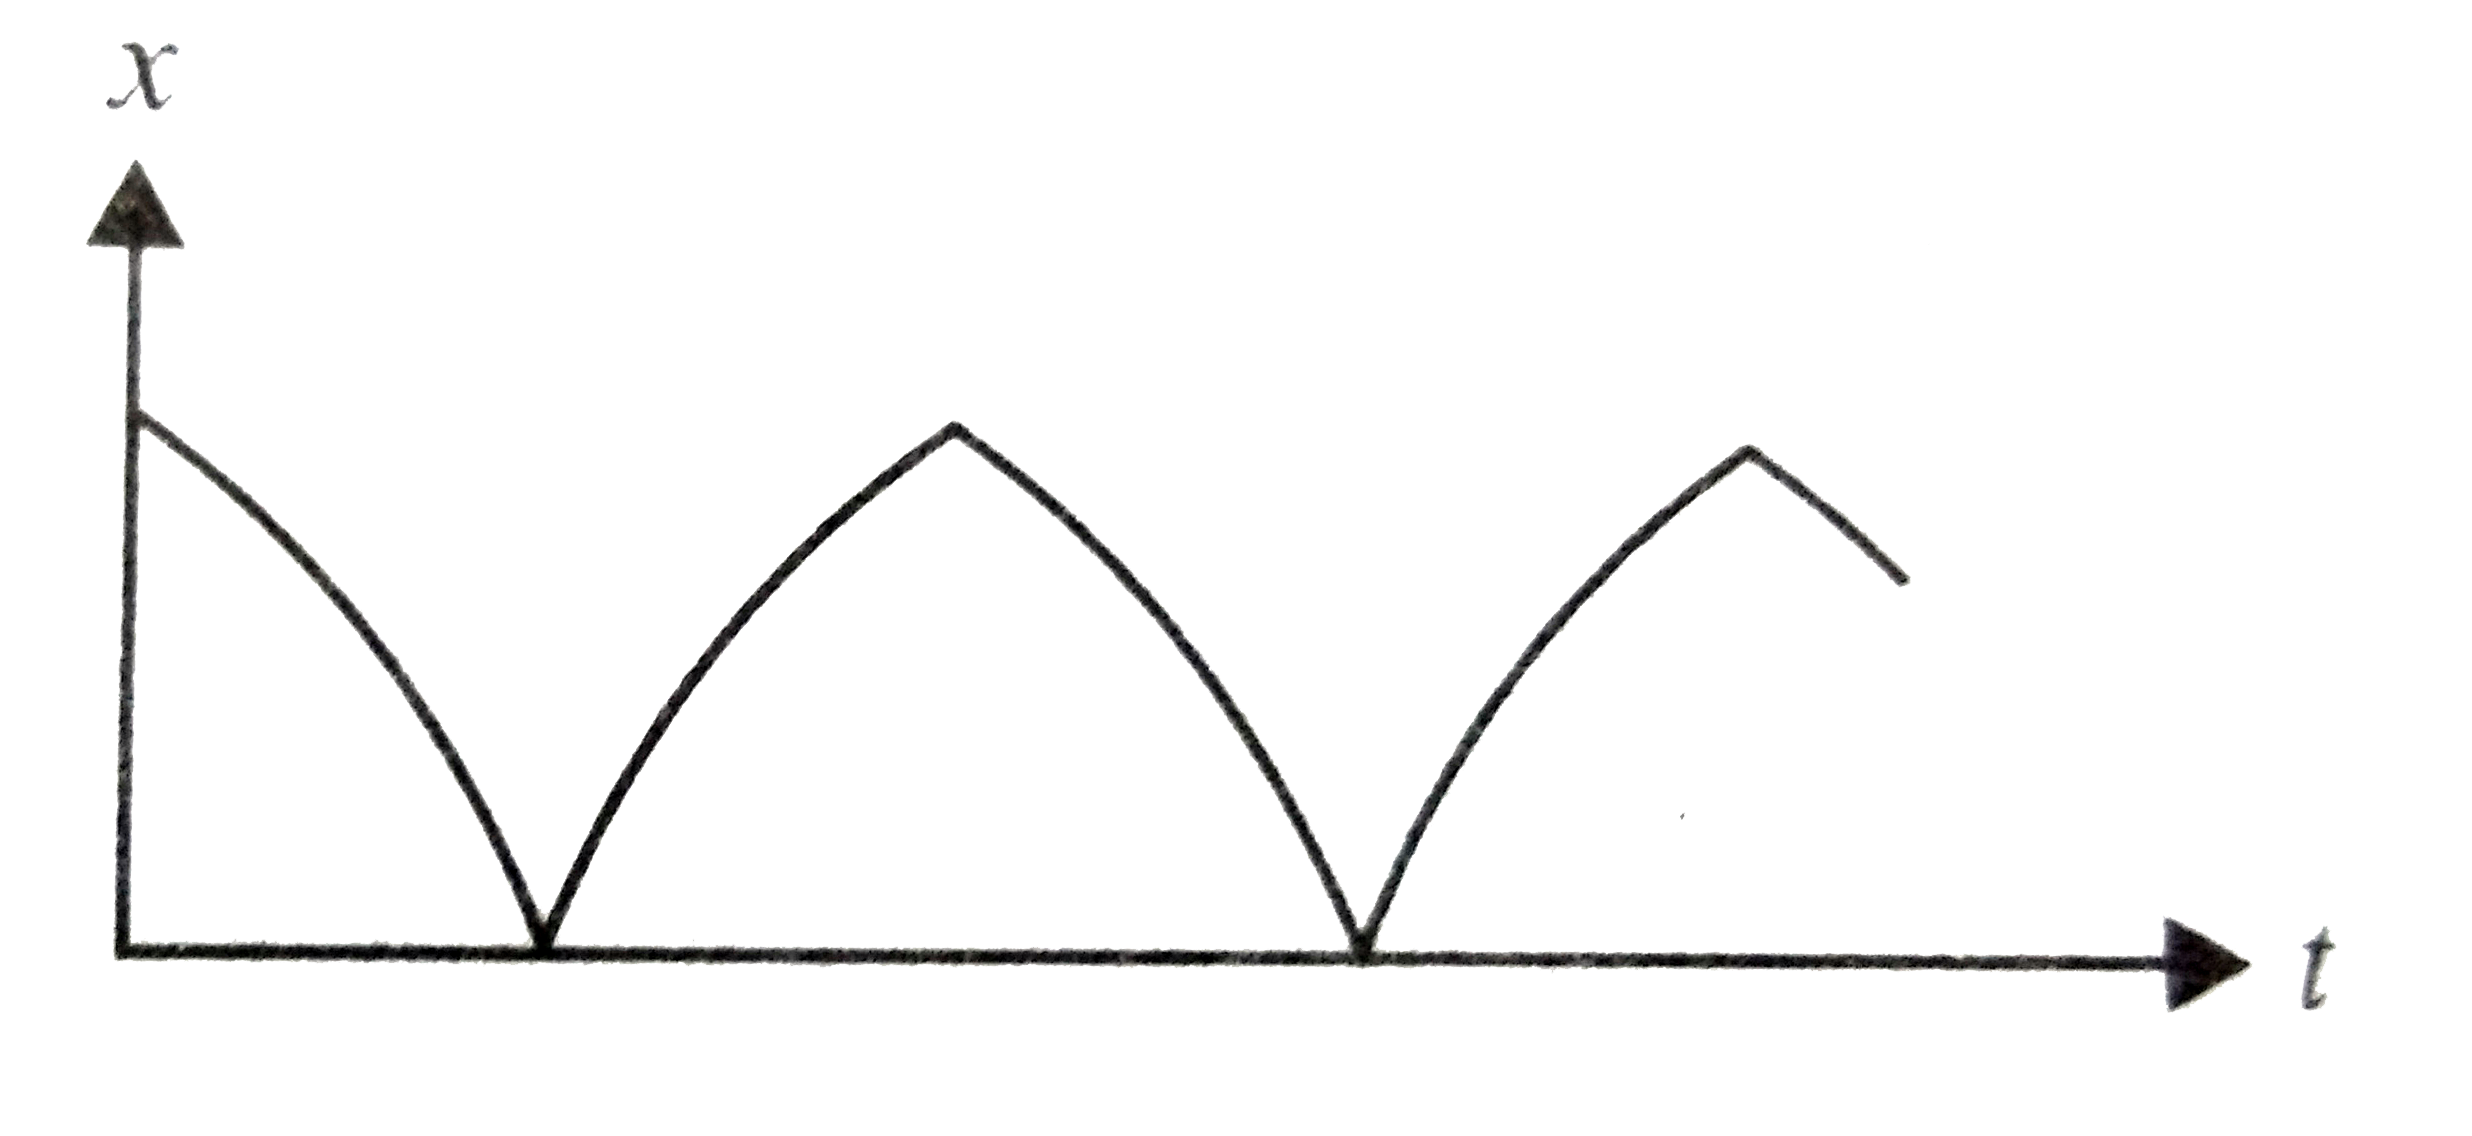
Two stars of masses m1 and m2 distance r apart, revolve about their centre of mass. The period of revolution is :
A2π√r32G(m1+m2)B2π√r3(m1+m2)2G(m1m2)C2π√2r3G(m1+m2)D2π√r3G(m1+m2)
The torque on a planet about the centre of sun is
View SolutionWhich of the following graphs between the square of the time period and cube of the distance of the planet from the sun is correct ?
View SolutionWhich of the following graphs between the square of the time period and cube of the distance of the planet from the sun is correct ?
View SolutionA planet is moving round the sun in an elliptical orbit as shows. As the planet moves from A to B
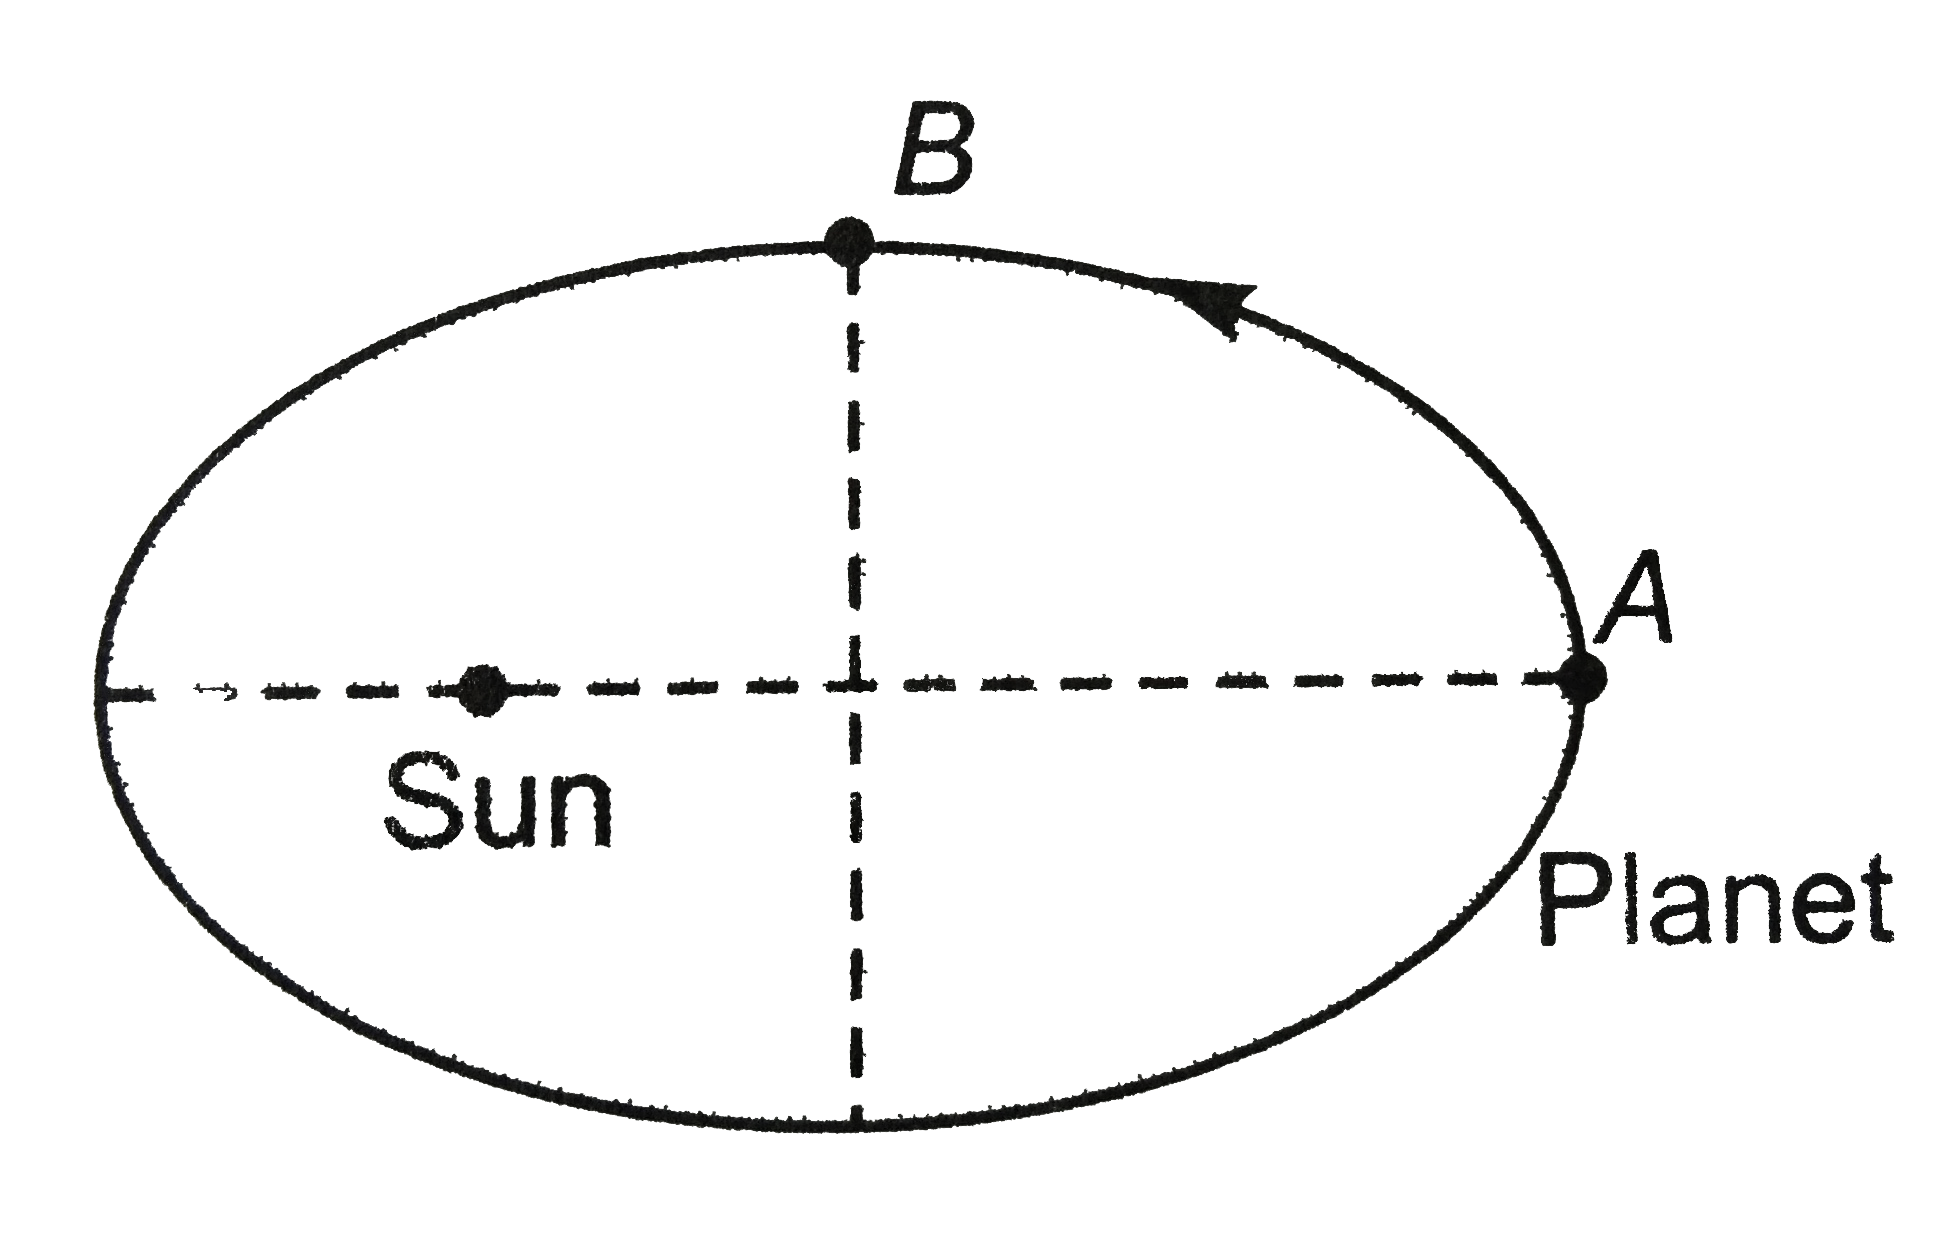
View SolutionIf the angular velocity of a planet about its own axis is halved, the distance of geostationary satellite of this planet from the centre of the centre of the planet will become
View SolutionTwo stars of masses m1 and m2 distance r apart, revolve about their centre of mass. The period of revolution is :
View Solution