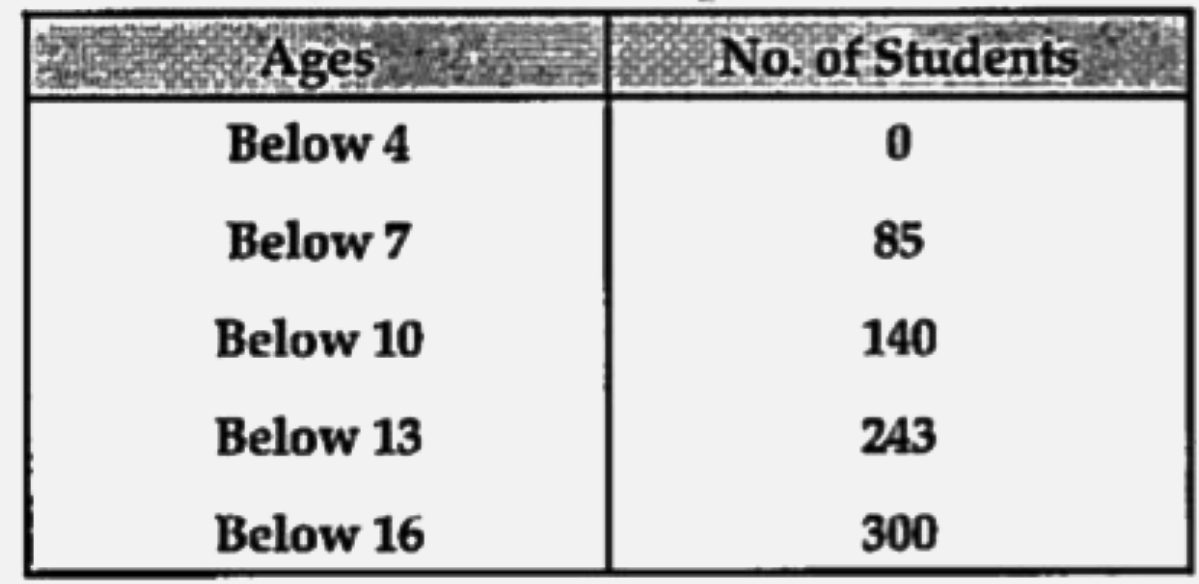
Construct the frequency distribution table from the following cumulative frequency table:
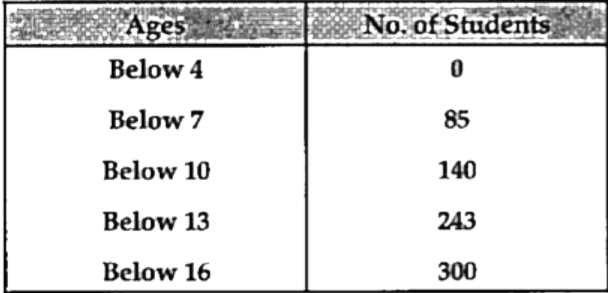
AgesNo of StudentsBelow40Below785Below10140Below13243Below16300
State the number of students in the age group 10-13
The correct Answer is:C.IFreq4−7857−105510−1310313−1657
103
To construct the frequency distribution table from the given cumulative frequency table, we will follow these steps:
Step 1: Identify Class Intervals
From the cumulative frequency table, we can identify the class intervals based on the "Below" values:
- Below 4
- Below 7
- Below 10
- Below 13
- Below 16
Step 2: Determine Frequency for Each Class Interval
We will calculate the frequency for each class interval by subtracting the cumulative frequency of the previous interval from the cumulative frequency of the current interval.
1. For the interval 0 to 4:
- Cumulative frequency below 4 = 0
- Frequency = 0 (as there are no students in this age group)
2. For the interval 4 to 7:
- Cumulative frequency below 7 = 85
- Cumulative frequency below 4 = 0
- Frequency = 85 - 0 = 85
3. For the interval 7 to 10:
- Cumulative frequency below 10 = 140
- Cumulative frequency below 7 = 85
- Frequency = 140 - 85 = 55
4. For the interval 10 to 13:
- Cumulative frequency below 13 = 243
- Cumulative frequency below 10 = 140
- Frequency = 243 - 140 = 103
5. For the interval 13 to 16:
- Cumulative frequency below 16 = 300
- Cumulative frequency below 13 = 243
- Frequency = 300 - 243 = 57
Step 3: Construct the Frequency Distribution Table
Now we can compile the frequencies into a table format:
| Age Group | Frequency |
|-------------|-----------|
| 0 - 4 | 0 |
| 4 - 7 | 85 |
| 7 - 10 | 55 |
| 10 - 13 | 103 |
| 13 - 16 | 57 |
Step 4: State the Number of Students in the Age Group 10-13
From the frequency distribution table, we can see that the number of students in the age group 10 to 13 is 103.
Final Answer
The number of students in the age group 10-13 is 103.
---
From the cumulative frequency table, we can identify the class intervals based on the "Below" values:
- Below 4
- Below 7
- Below 10
- Below 13
- Below 16
We will calculate the frequency for each class interval by subtracting the cumulative frequency of the previous interval from the cumulative frequency of the current interval.
- Cumulative frequency below 4 = 0
- Frequency = 0 (as there are no students in this age group)
- Cumulative frequency below 7 = 85
- Cumulative frequency below 4 = 0
- Frequency = 85 - 0 = 85
- Cumulative frequency below 10 = 140
- Cumulative frequency below 7 = 85
- Frequency = 140 - 85 = 55
- Cumulative frequency below 13 = 243
- Cumulative frequency below 10 = 140
- Frequency = 243 - 140 = 103
- Cumulative frequency below 16 = 300
- Cumulative frequency below 13 = 243
- Frequency = 300 - 243 = 57
Now we can compile the frequencies into a table format:
|-------------|-----------|
| 0 - 4 | 0 |
| 4 - 7 | 85 |
| 7 - 10 | 55 |
| 10 - 13 | 103 |
| 13 - 16 | 57 |
From the frequency distribution table, we can see that the number of students in the age group 10 to 13 is 103.
The number of students in the age group 10-13 is 103.
Topper's Solved these Questions
- STATISTICSBOOK - ICSECHAPTER - STATISTICSEXERCISE - EXERCISE 18 (B)
6 Videos
- STATISTICSBOOK - ICSECHAPTER - STATISTICSEXERCISE - EXERCISE 18 (B)
6 Videos
- SOLUTION OF RIGHT TRIANGLESBOOK - ICSECHAPTER - SOLUTION OF RIGHT TRIANGLESEXERCISE - EXERCISE 24
35 Videos
- STATISTICS AND GRAPH WORK BOOK - ICSECHAPTER - STATISTICS AND GRAPH WORK EXERCISE - TOPIC - 2 (4 Marks Questions)
14 Videos
Similar Questions
Construct the frequency distribution table from the following cumulative frequency table:
AgesNo of studentsBelow40Below785Below10140Below13243Below16300
State the age group which has the least number of students
View SolutionConstruct the frequency distribution table from the following cumulative frequency table :

State the number of students in the age group 10 - 13.
View SolutionConstruct the frequency distribution table from the following cumulative frequency table :

State the age - group which has the least number of students .
View SolutionConstruct a frequency distribution table from the following cumulative frequency distribution :
Calss IntervalFrequency5−101810−153015−204620−257325−3090
View SolutionConstruct a frequency distribution table from the following cumulative frequency distribution :
Calss IntervalCumulative Frequency10−19820−291930−392340−4930
View SolutionConstruct a cumulative frequency distribution table from the following frequency table :
C.IFrequency 11−201521−302131−402641−501851−601361−7015
View SolutionConstruct a frequency distributions table from the following cumulatvive frequency table.
Class interval Cumulative Frequency 0−91510−192320−293830−395640−496850−5990
View SolutionConstruct a cumulative frequency distribution table from the frequency table given below :
Calss IntervalFrequency1−101211−201821−302331−401541−5010
View SolutionConstruct a cumulative, frequency distribution table from the frequency table given below :
Calss IntervalFrequency0−898−161316−241224−32732−4015
View SolutionFind the mean marks of the students from the following cumulative frequency distribution: Marks: Below Below Below Below Below Below Below Below Below Below 10 20 30 40 50 60 70 80 90 100 No. of Students 5 9 17 29 45 60 70 78 83 85
View Solution
