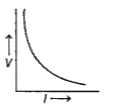
Fig. shows V-I graphs experimentally obtained in different cases. Select the graphs for ohmic and non-ohmic resistors.

Text Solution
The V-I graphs shown in Fig. (a) and (b) are for ohmic resistors, while in Fig.(c) and (d) are for non-ohmic resistors.
|
Updated on:21/07/2023
Related Playlists
- BOOK - ICSECHAPTER - CURRENT ELECTRICITYEXERCISE - EXERCISE-8(A)43videos
CURRENT ELECTRICITY
- BOOK - ICSECHAPTER - CURRENT ELECTRICITYEXERCISE - EXERCISE-8(A) ( MULTIPLE CHOICE TYPE)2videos
CURRENT ELECTRICITY
- BOOK - ICSECHAPTER - CALORIMETRYEXERCISE - EXERCISE-11(B) (NUMERICALS)15videos
CALORIMETRY
- BOOK - ICSECHAPTER - ELECTRO-MAGNETISM EXERCISE - EXERCISE-10 (C) NUMERICALS1videos
ELECTRO-MAGNETISM
Knowledge Check
- Question 1 - Select One
Which of the following graphs represents ohmic resistance?
A B
B C
C D
D
Similar Questions
What is a non-ohmic resistor ?
View SolutionGive two differences between an ohmic and non ohmic resistor.
View SolutionHow do you differentiate between an ohmic and a non-ohmic resistor ?
View SolutionWrite two differences between ohmic circuit and non-ohmic circuit.
View SolutionDraw V-I graph for ohmic and non-ohmic materials. Give one example for each.
View SolutionDraw V - I graph for ohmic and non-ohmic materials. Give one example for each.
View SolutionDraw a graph of Potential difference (V) versus Current (I) for an ohmic resistor.
View SolutionDraw a graph of potential difference (V) versus current (I) for an ohmic resistor.
View SolutionFig. shows I-V curves for two resistors. Identify the ohmic and non-ohmic resistors. Give a reason for your answer
 View Solution

