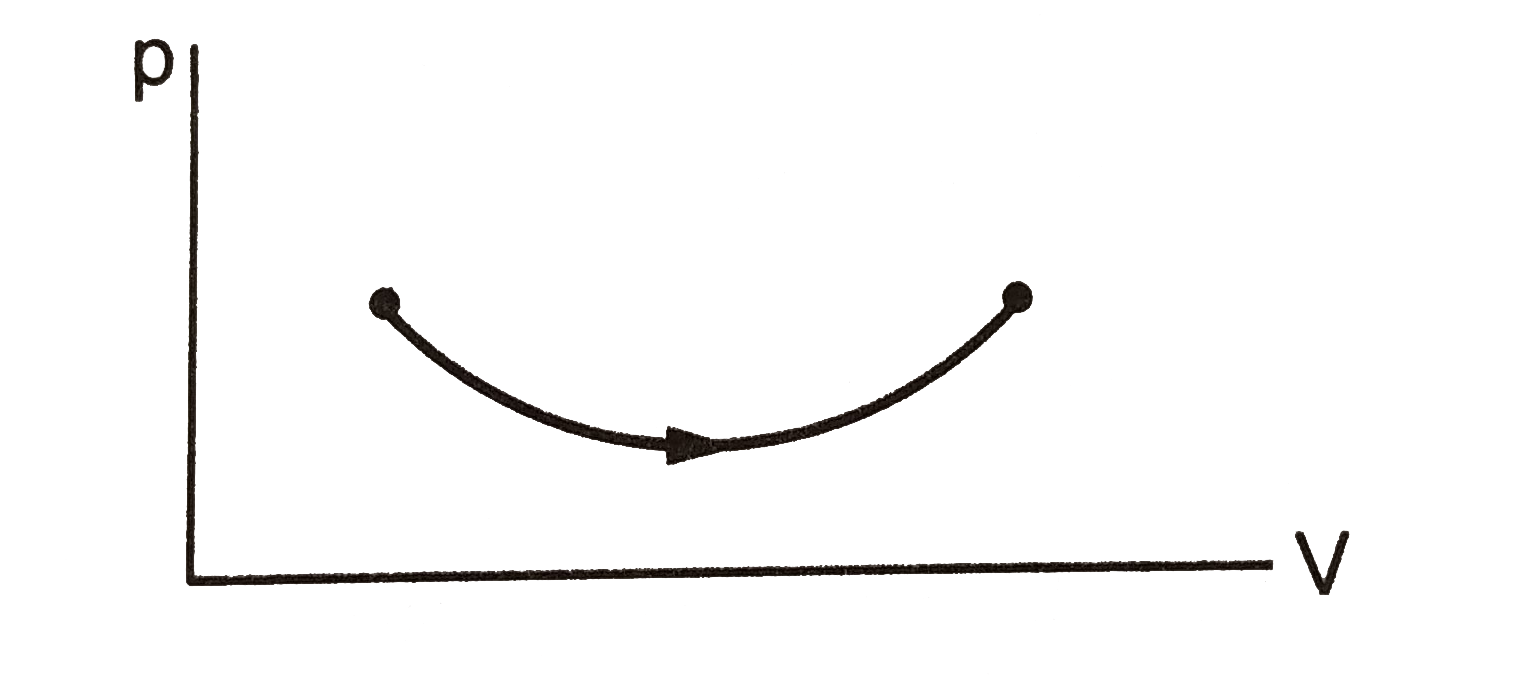
Consider the process on a system as shown in the figure. During the process, the work done by the system
Continuously increases
Continuously decreases
First increases then decreases
First decreases then increases
Don.t get tempted to mark the answer (3). We said that the area under the p-V diagram is equal to the work done.So,it we move form 1 to 2 the area under the graph is continuosly uncreasing so the correct response will be (1)
Note : In this question the rate with which the work is being done by the system is first decreasing then increasing.
Similar Questions
In a cyclic process, work done by the system is
View SolutionConsider two processes on a system as shown in figure.
The volumes in the initial states are the same in the two processes and the volume in the final states are also the same.Let ΔW1 and ΔW2 be the work done by the system in the processes A and B respectively.
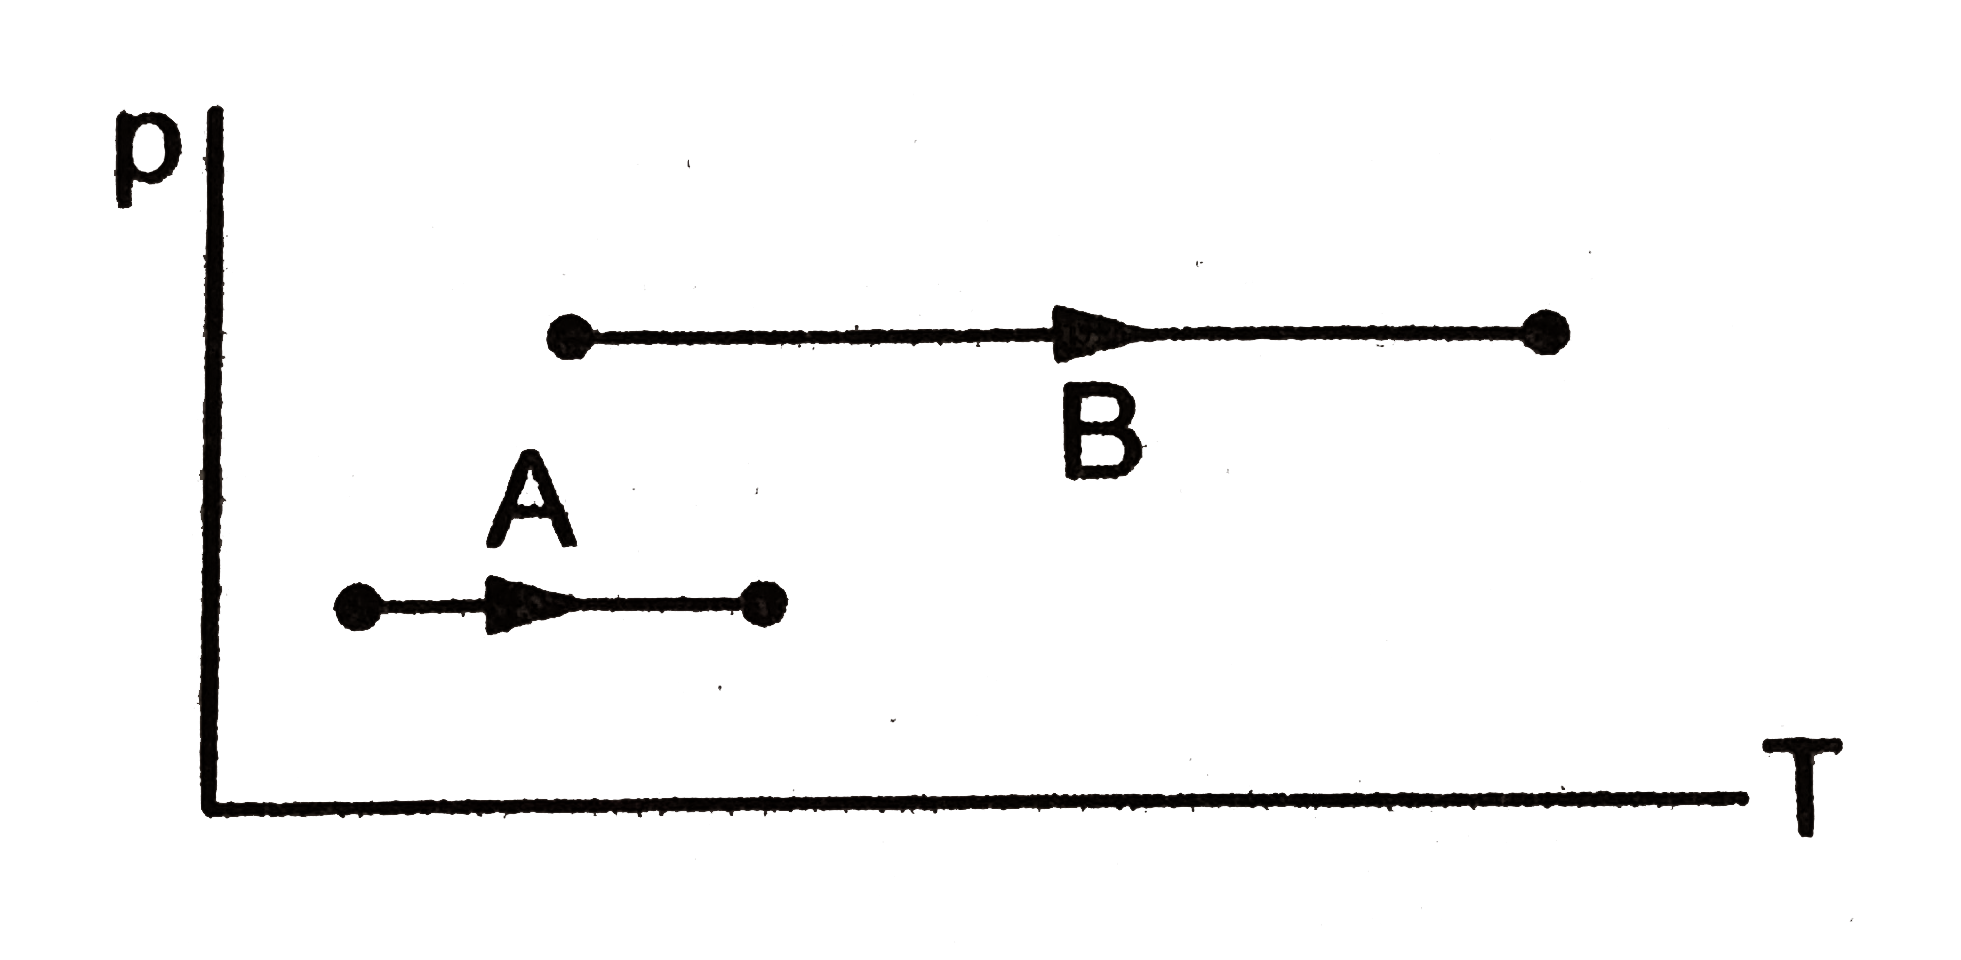
View SolutionConsider two processes on a system as shown in figure.
The volumes in the initial states are the same in the two processes and the volume in the final states are also the same.Let ΔW1 and ΔW2 be the work done by the system in the processes A and B respectively.

View Solutionif work is done by the system then W is
View Solutionconsider two processes on a system as shown in fig
the volumes in the initial stage are the same in the two processes and the volume in the final stage are also the same.Let ΔW1andΔW2 be the work done by the system in the processes A and B respectively.

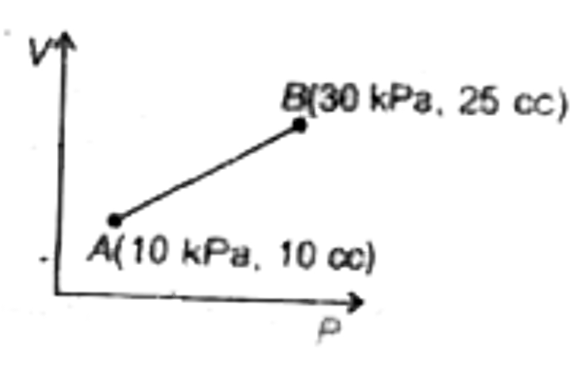
View SolutionAn ideal monoatomic gas undergoes the process AB as shown in the figure. If the heat supplied and the work done in the process are ΔQ and Delta Wrespectively.TheratioDeltaQ : DeltaW is
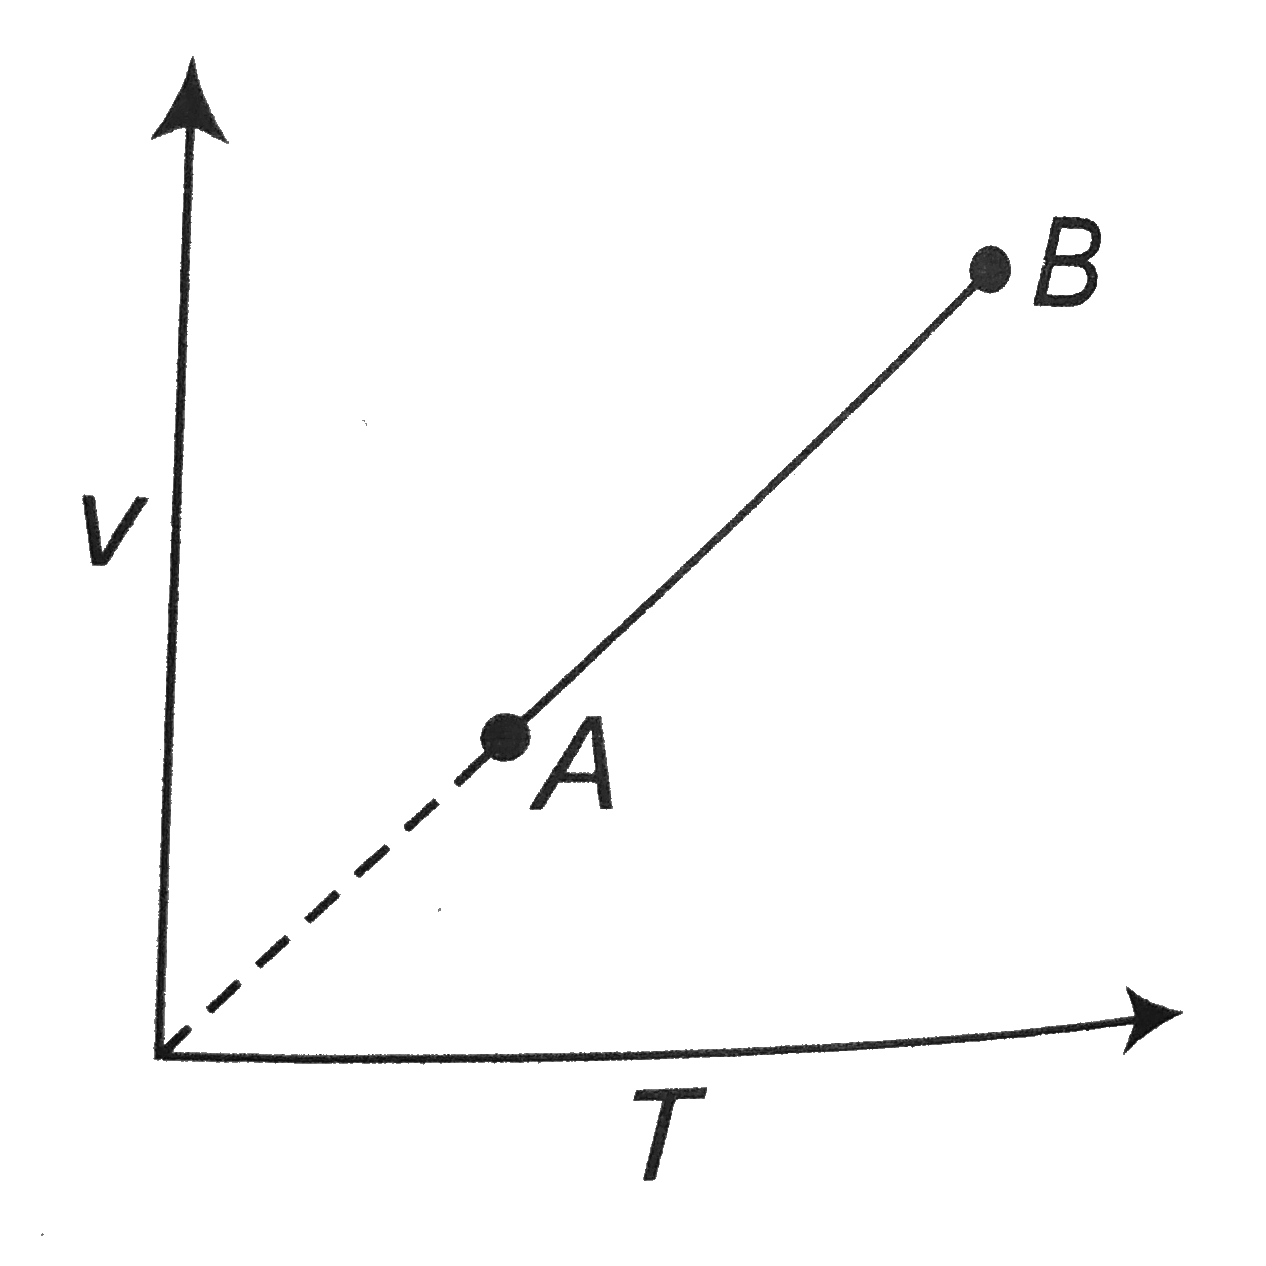
View SolutionWork done for the process shownin the figure is
View SolutionA thermodynamic system is taken through the cyclic PQRSP process. The net work done by the system is
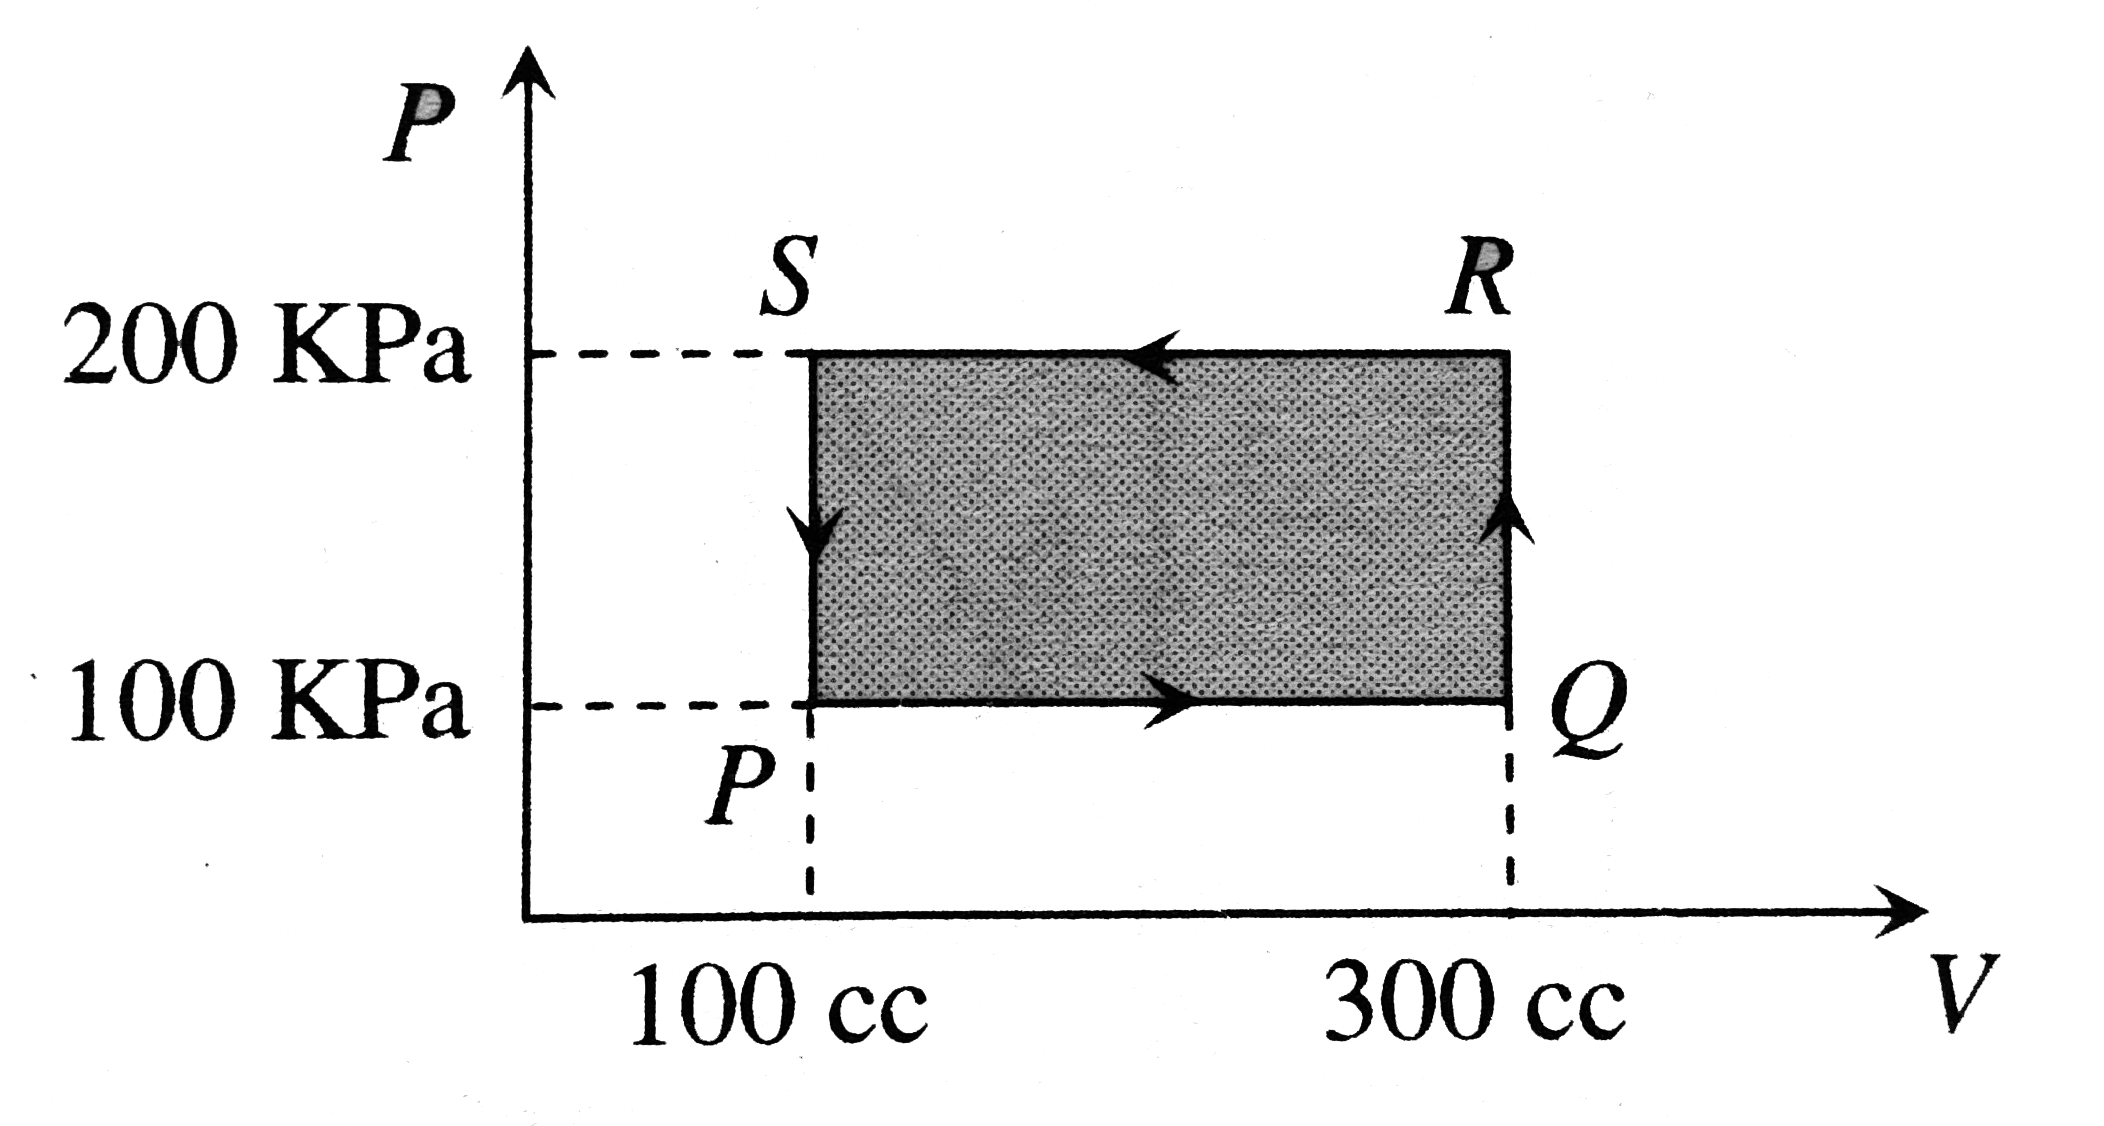
View SolutionA thermodynamic system is taken through the cyclic PQRSP process. The net work done by the system is

View SolutionThe final volume of a system is equal to the initial volume in a certain process. Is the work done by the system necessarily zero? Is it necessarily nonzero?
View Solution
