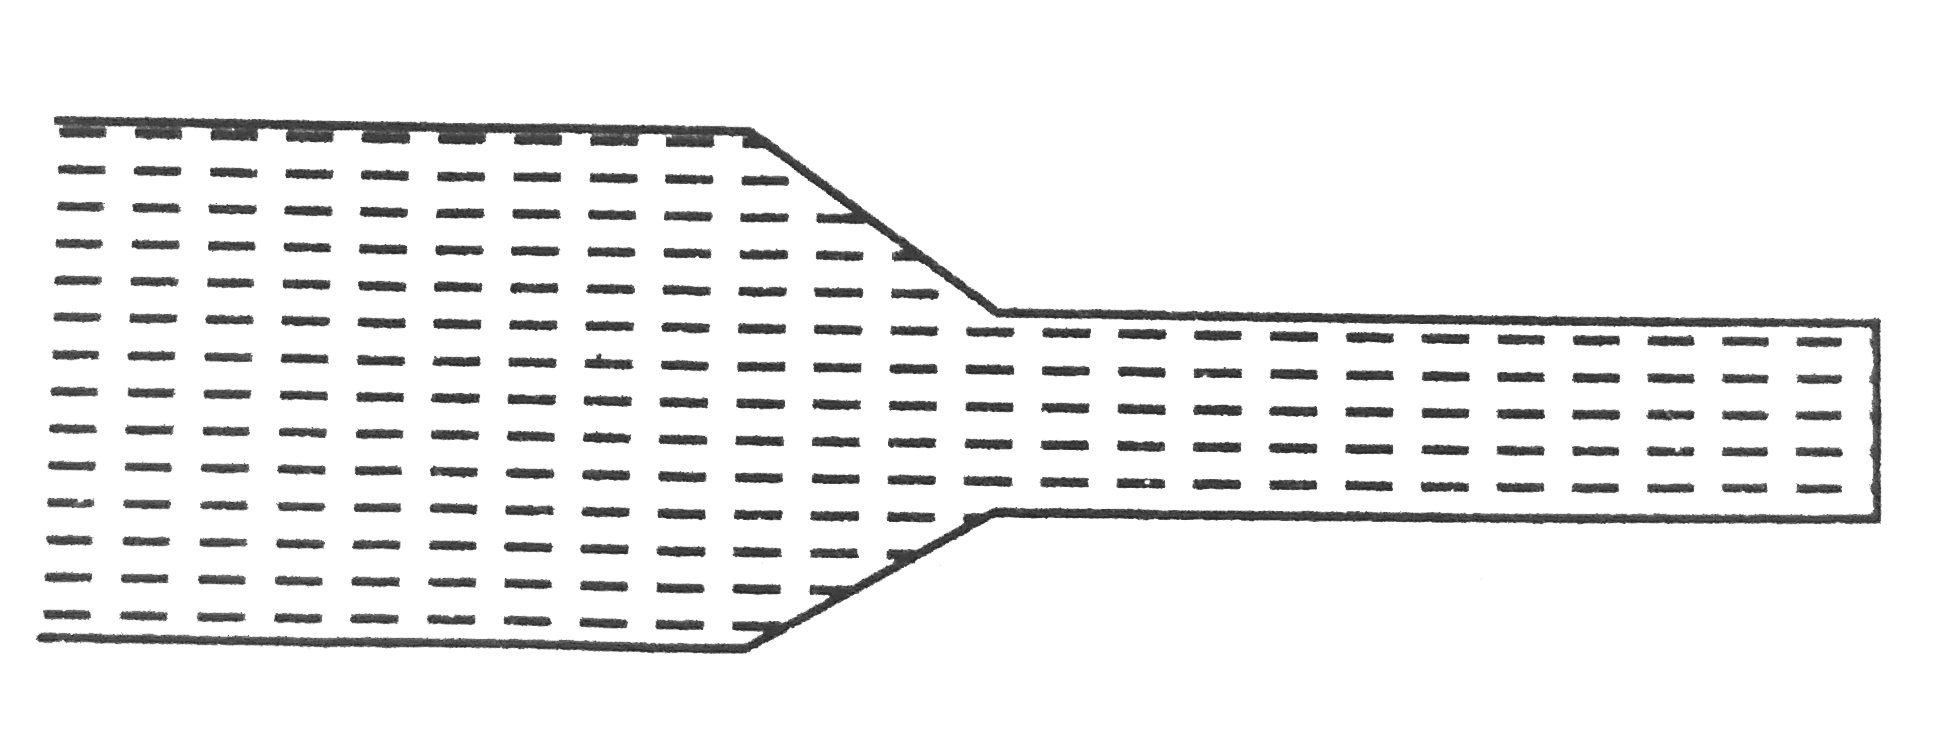
A non viscous liquid is flowing through a frictionless duct, cross-section varying as shown in figure.

Which of the following graph represents the variation of pressure p along the axis of tube ?
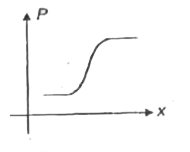
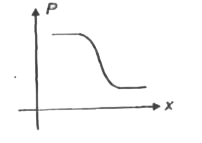
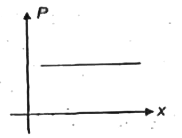

As we know according ,to equation of continuity, when cross-section-of duct decreases, the velocity of flow of liquid increases and in accordance with Bemoulits theorem, in a horizontal pipe, the place where speed of liquid is maximum, the value of pressure is minimum. Hence the 2nd graph correctly represents the variation of pressure.
Similar Questions
Water flows through a frictionless duct with a cross-section varying as shown in fig. Pressure p at points along the axis is represented by
View SolutionA viscous liquid flows through a horizontal pipe of varying cross-sectional area. Identify the option which correctly represents the variation of height of rise of liquid in each vertical tube
View Solution
Knowledge Check
The velocity -displacement graph of a particle is as shown in the figure. Which of the following graphs correctly represents the variation of acceleration with displacement?
 A
A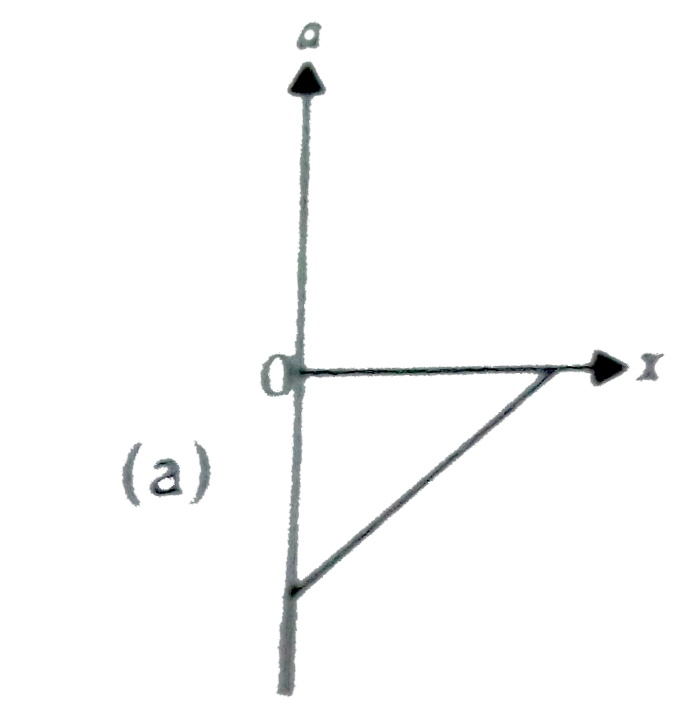 B
B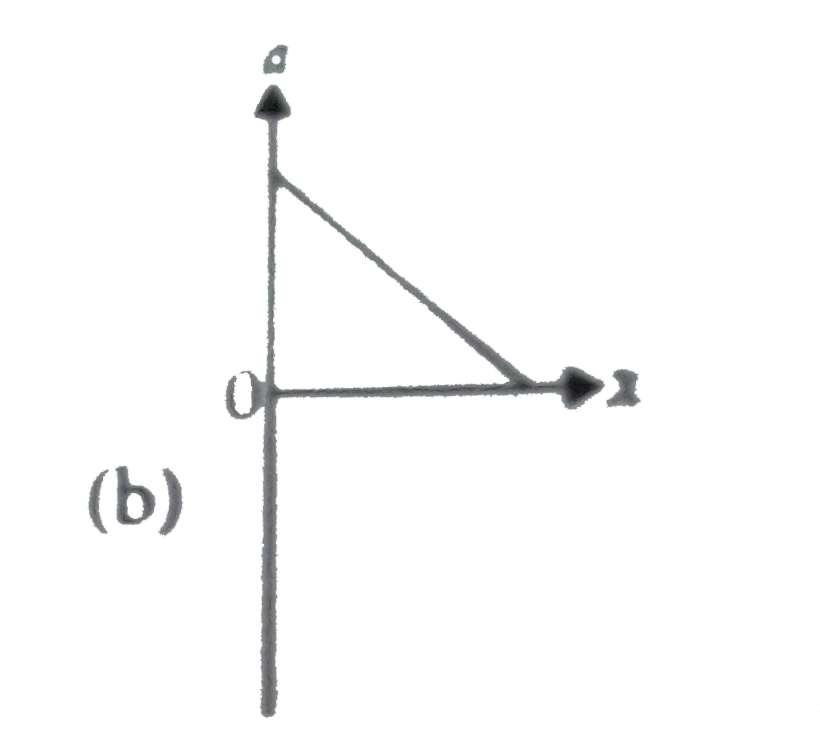 C
C D
D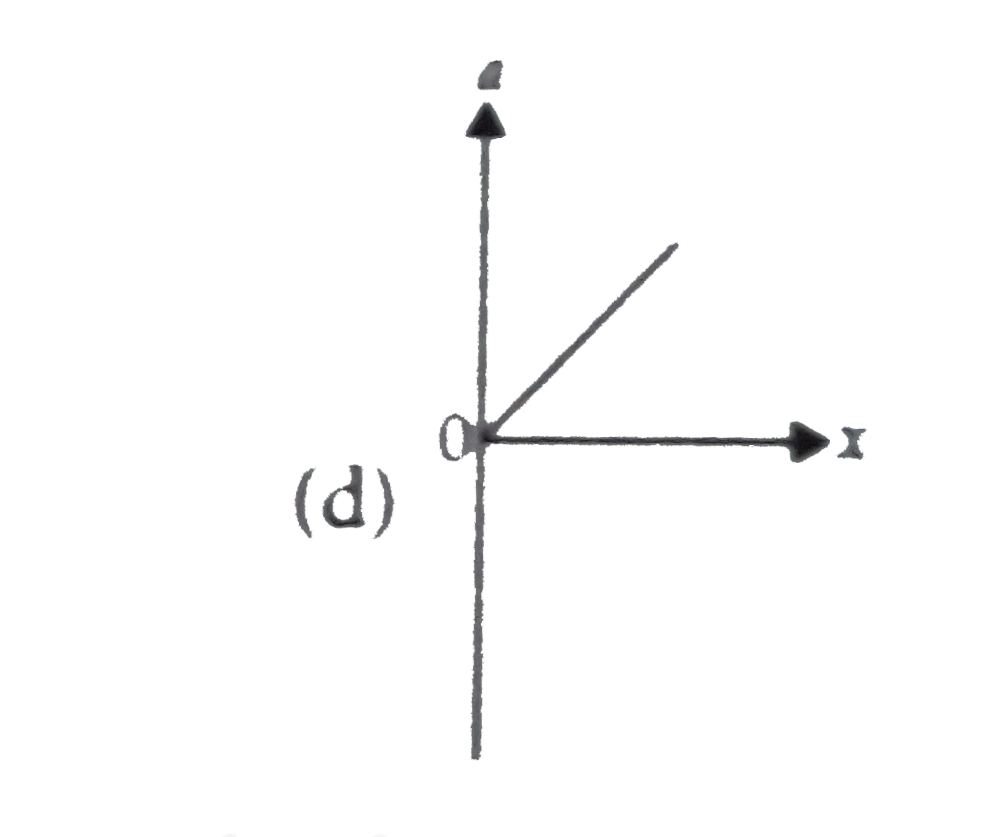
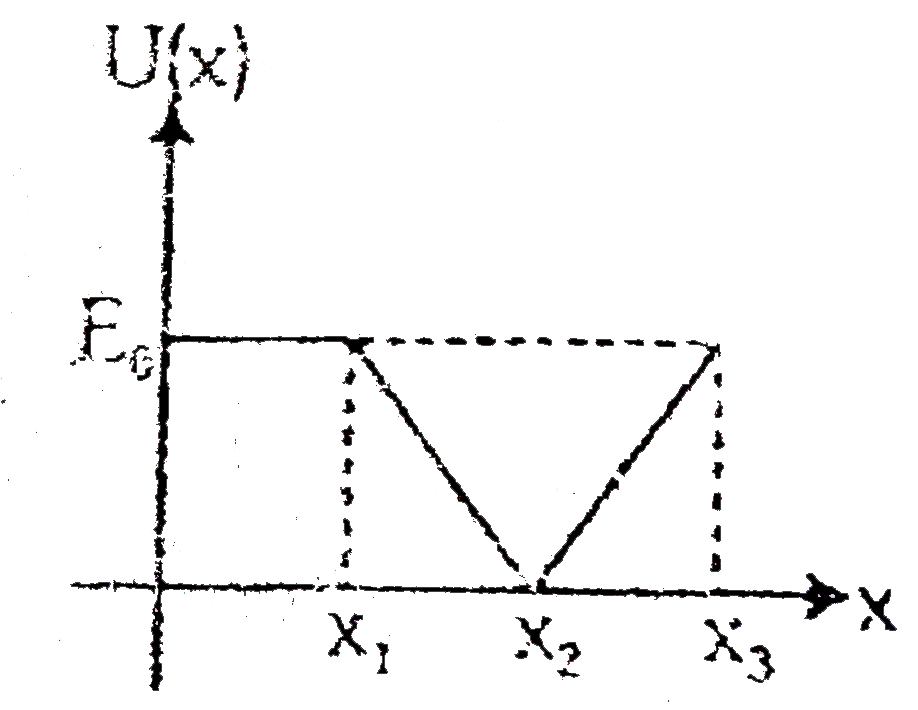
The potential energy U(x) of a particle moving along x−axis is shown in figure. Which one of the following graphs represents the variation of kinetic energy of this particel if its total mechanical enery is E0
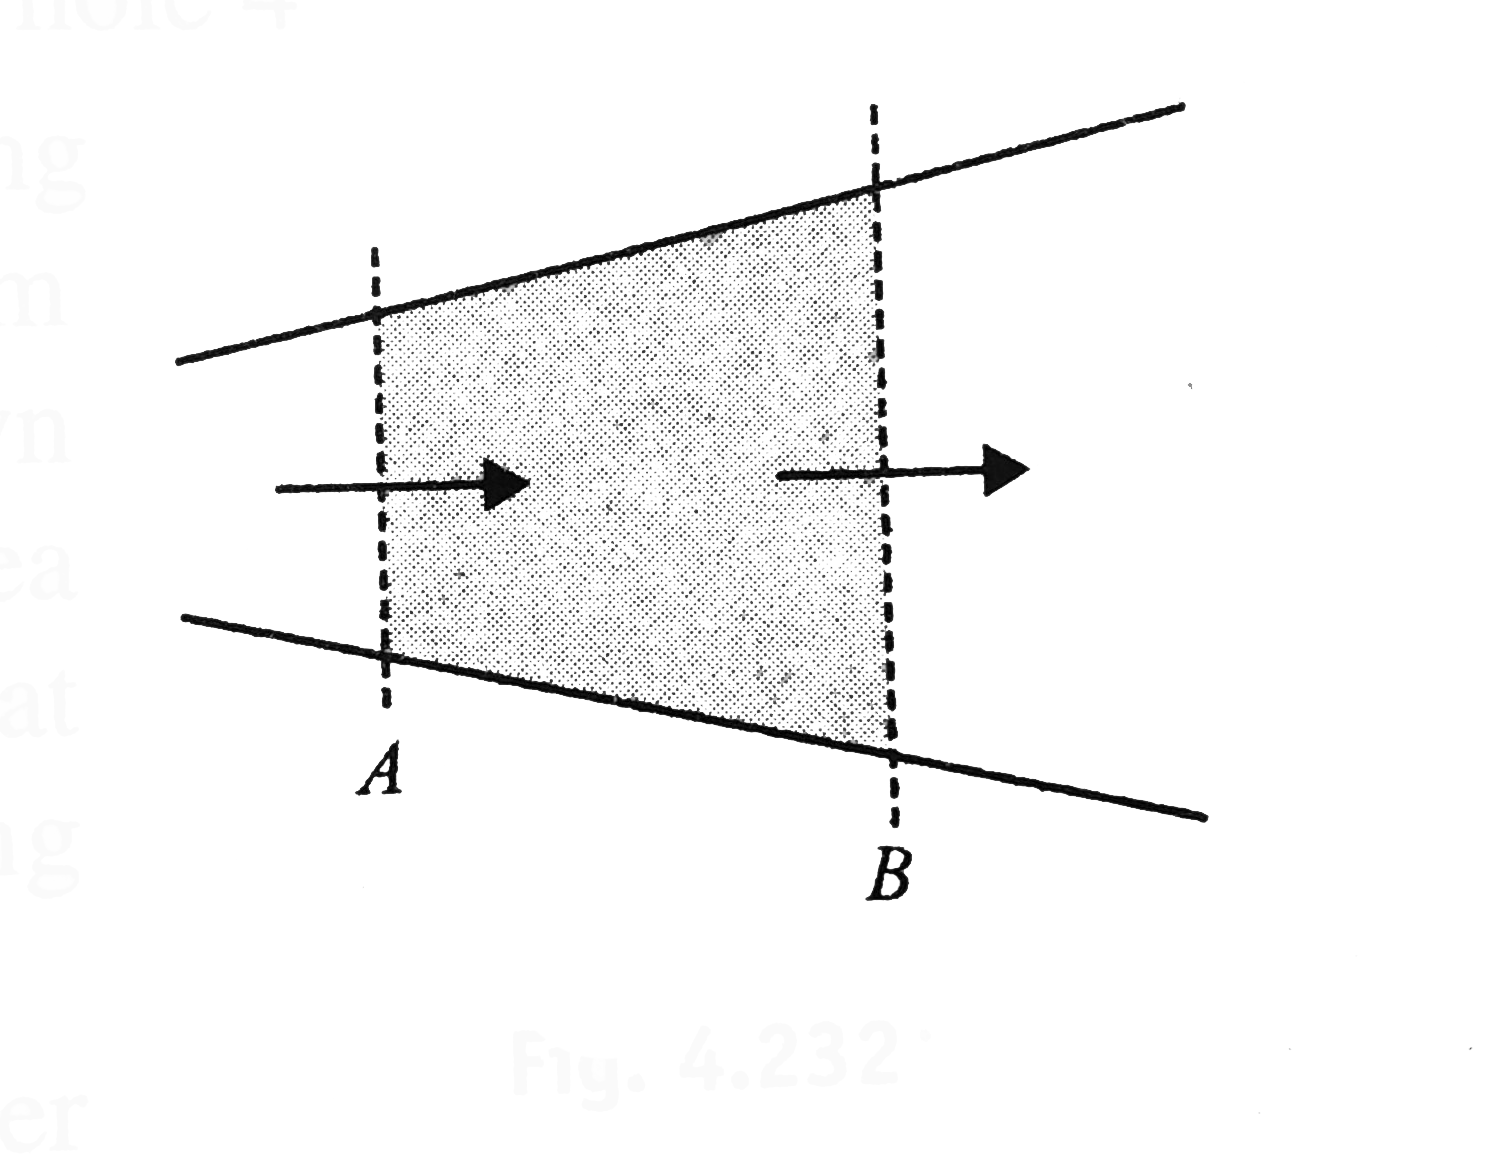
View SolutionA non-viscous liquid is flowing through a non-uniform pipe from section A to section B as shown in the figure. Cross sectional area of the pipe at A is less than that at B. Which of the following statements are correct?
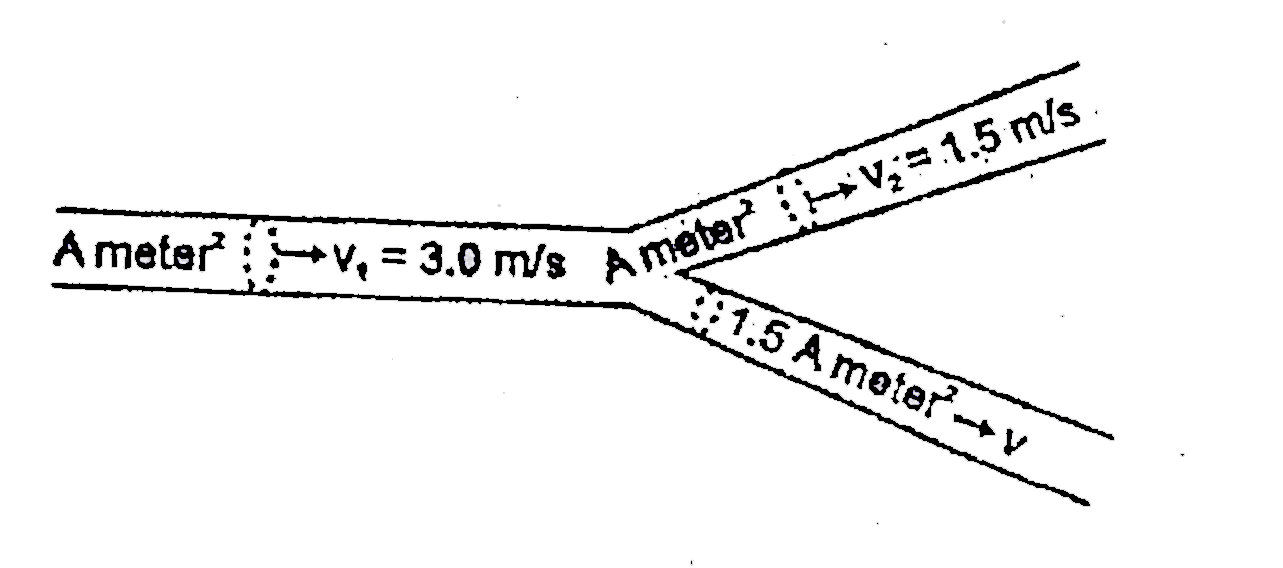
View SolutionAn incompressible liquid flows through a horizontal tube as shown in the figure. Then the velocity 'v' of the fluid is:
View SolutionWhich of the followings represent the variation of frequency (f) with radius of cross section of a stretched string?
View SolutionThe graph shown the variation with times t of the velocity v of an object . Which one of the following graphs best represents the variation of acceleration a of the object with time t?

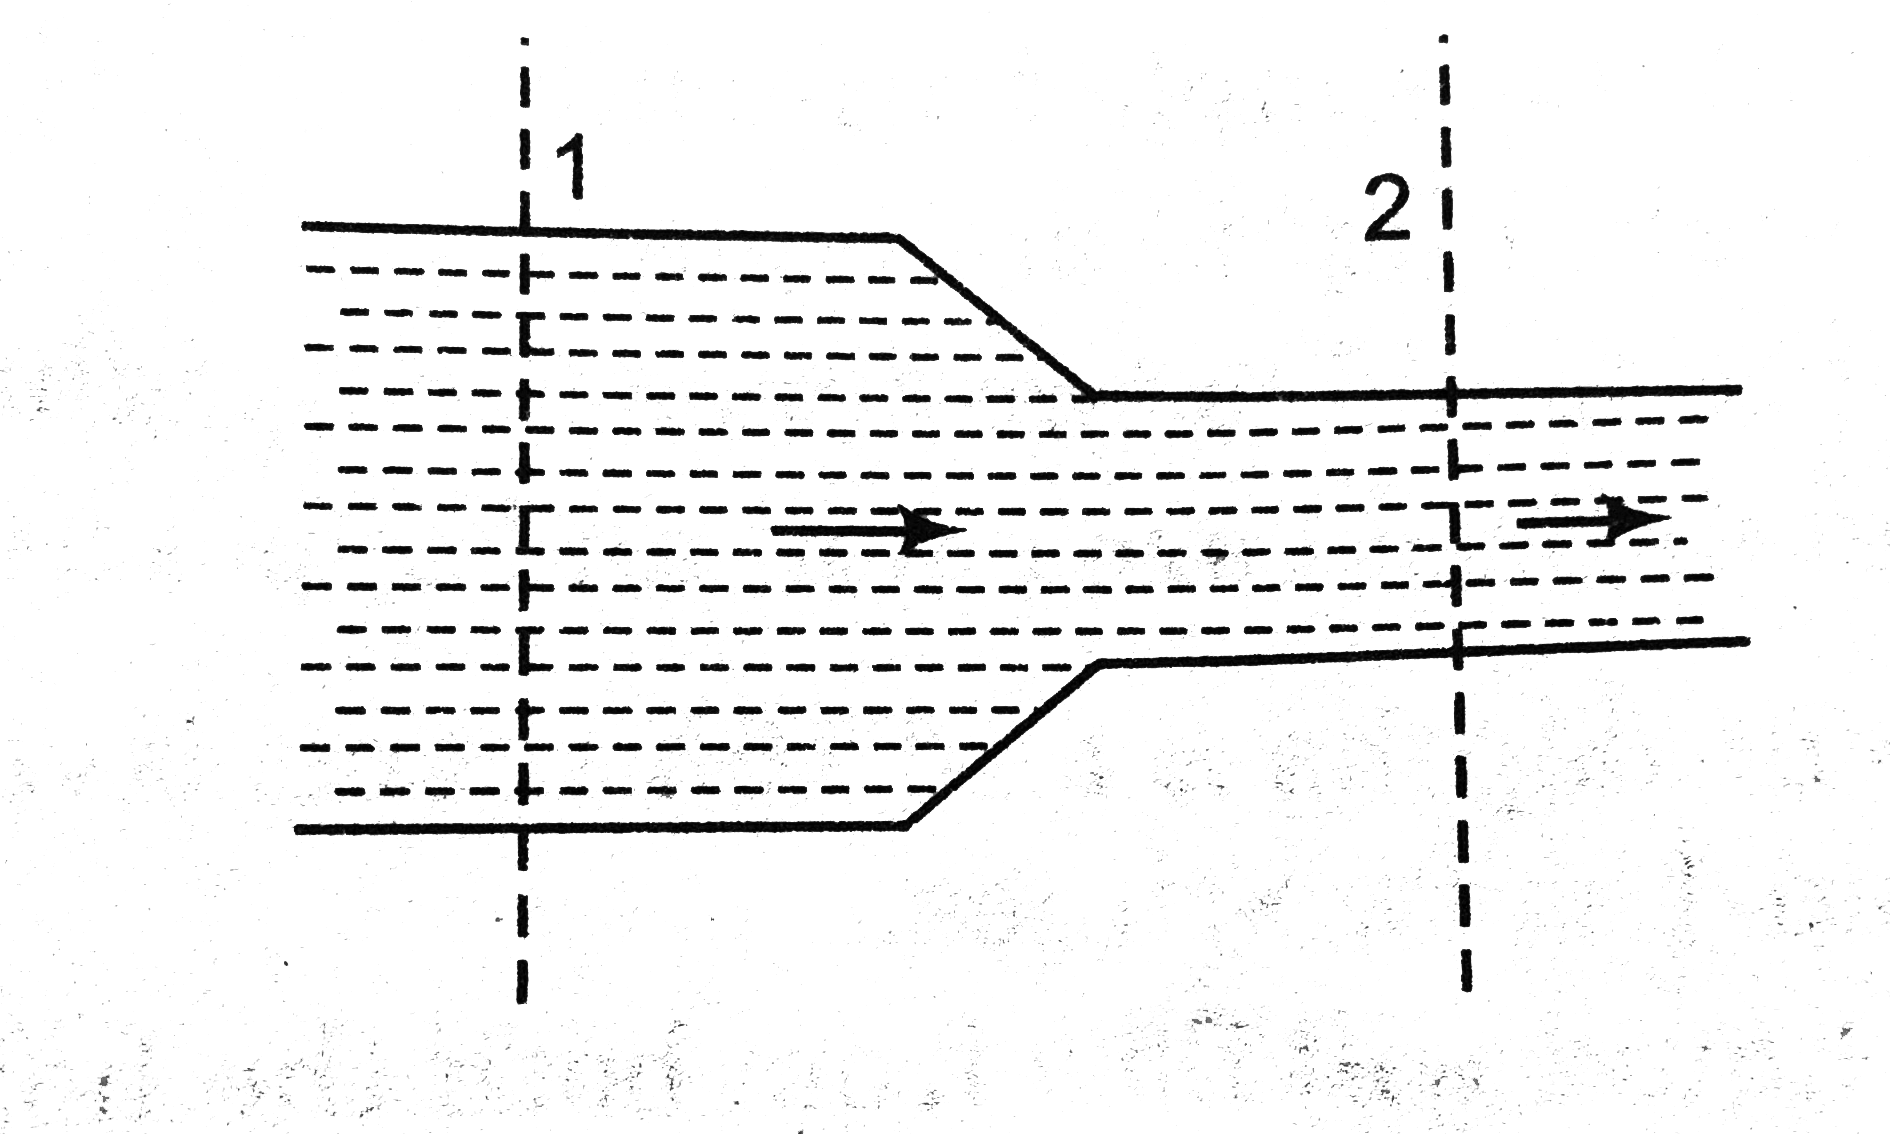
View SolutionA non viscous inconpressible liquid is flowing from a horizontal pipe of non-uniform cross section as shown, Choose the correct option
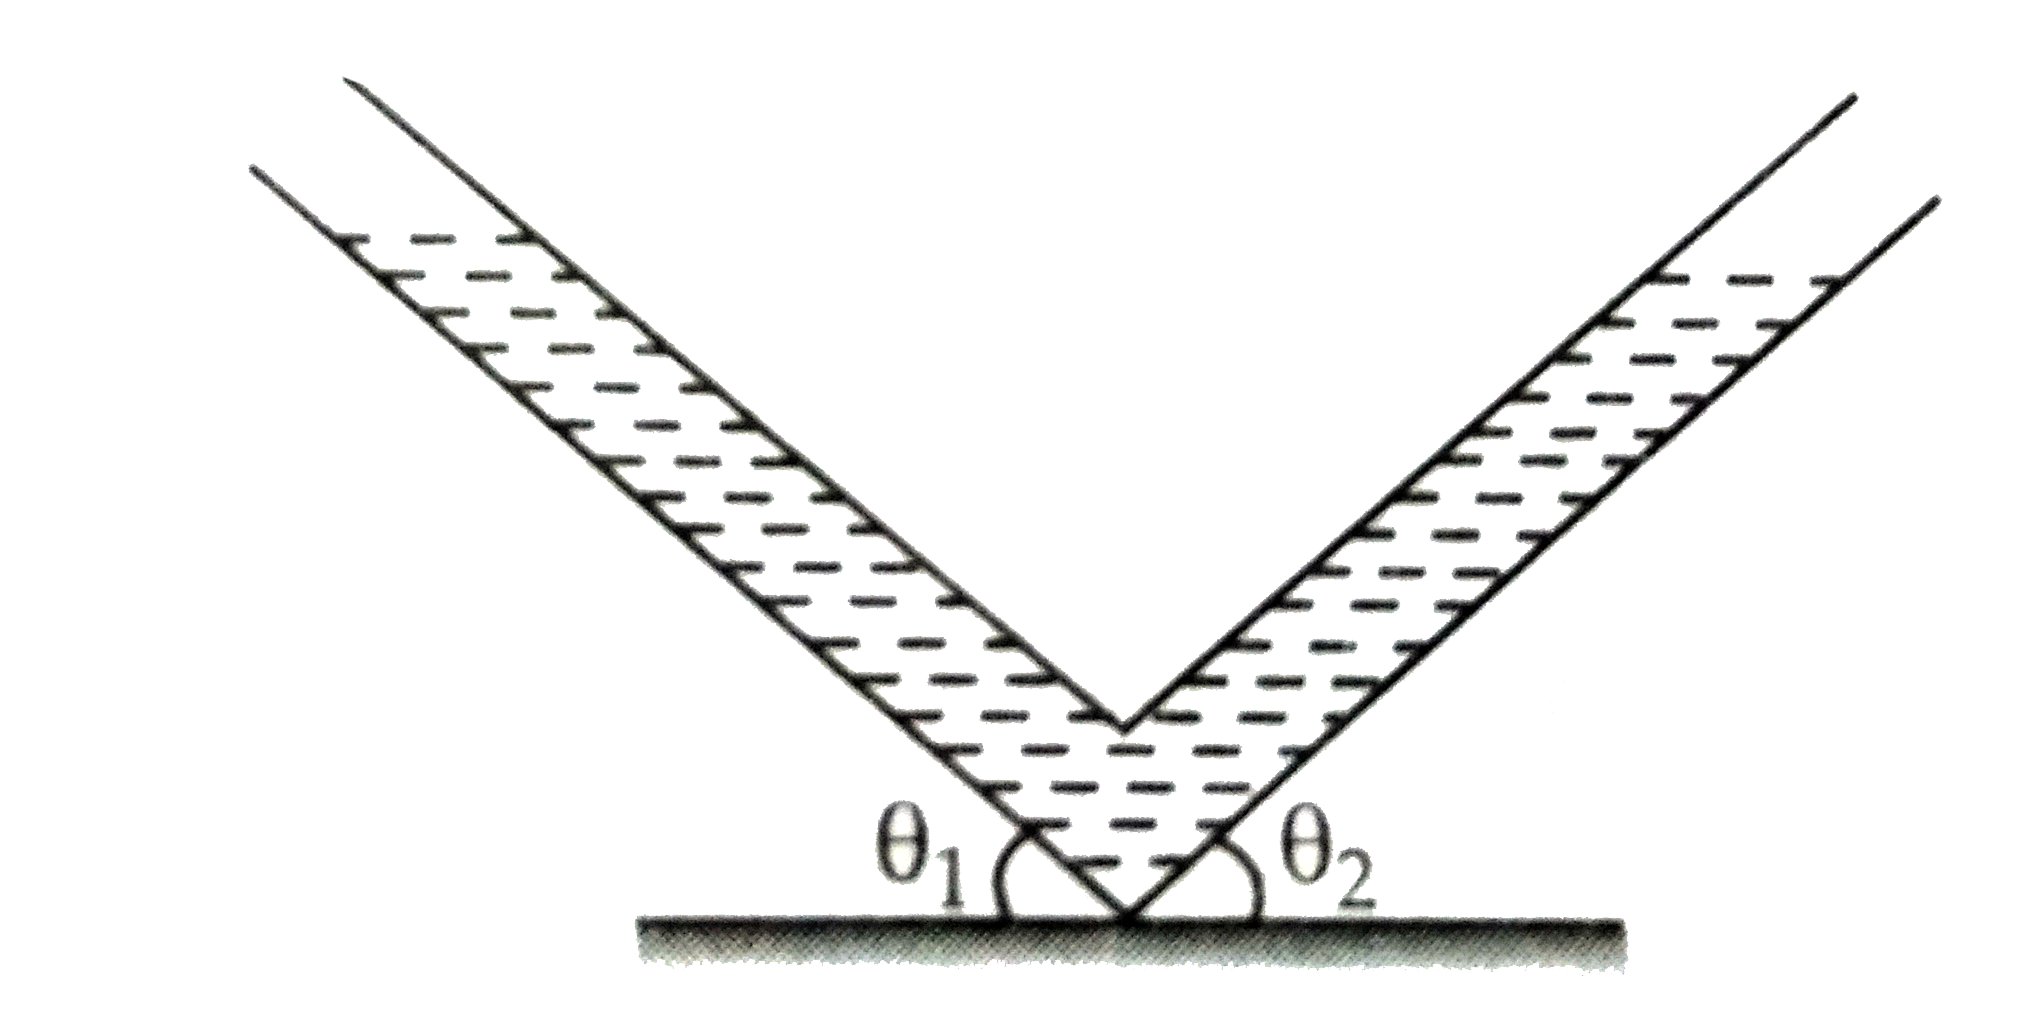
View SolutionA non viscous liquid of density ρ is filled in a tube with A as the area of cross section, as shown in the figure. If the liquid is slightly depressed in one of the arms, the liquid column oscillates with a frequency
View Solution
