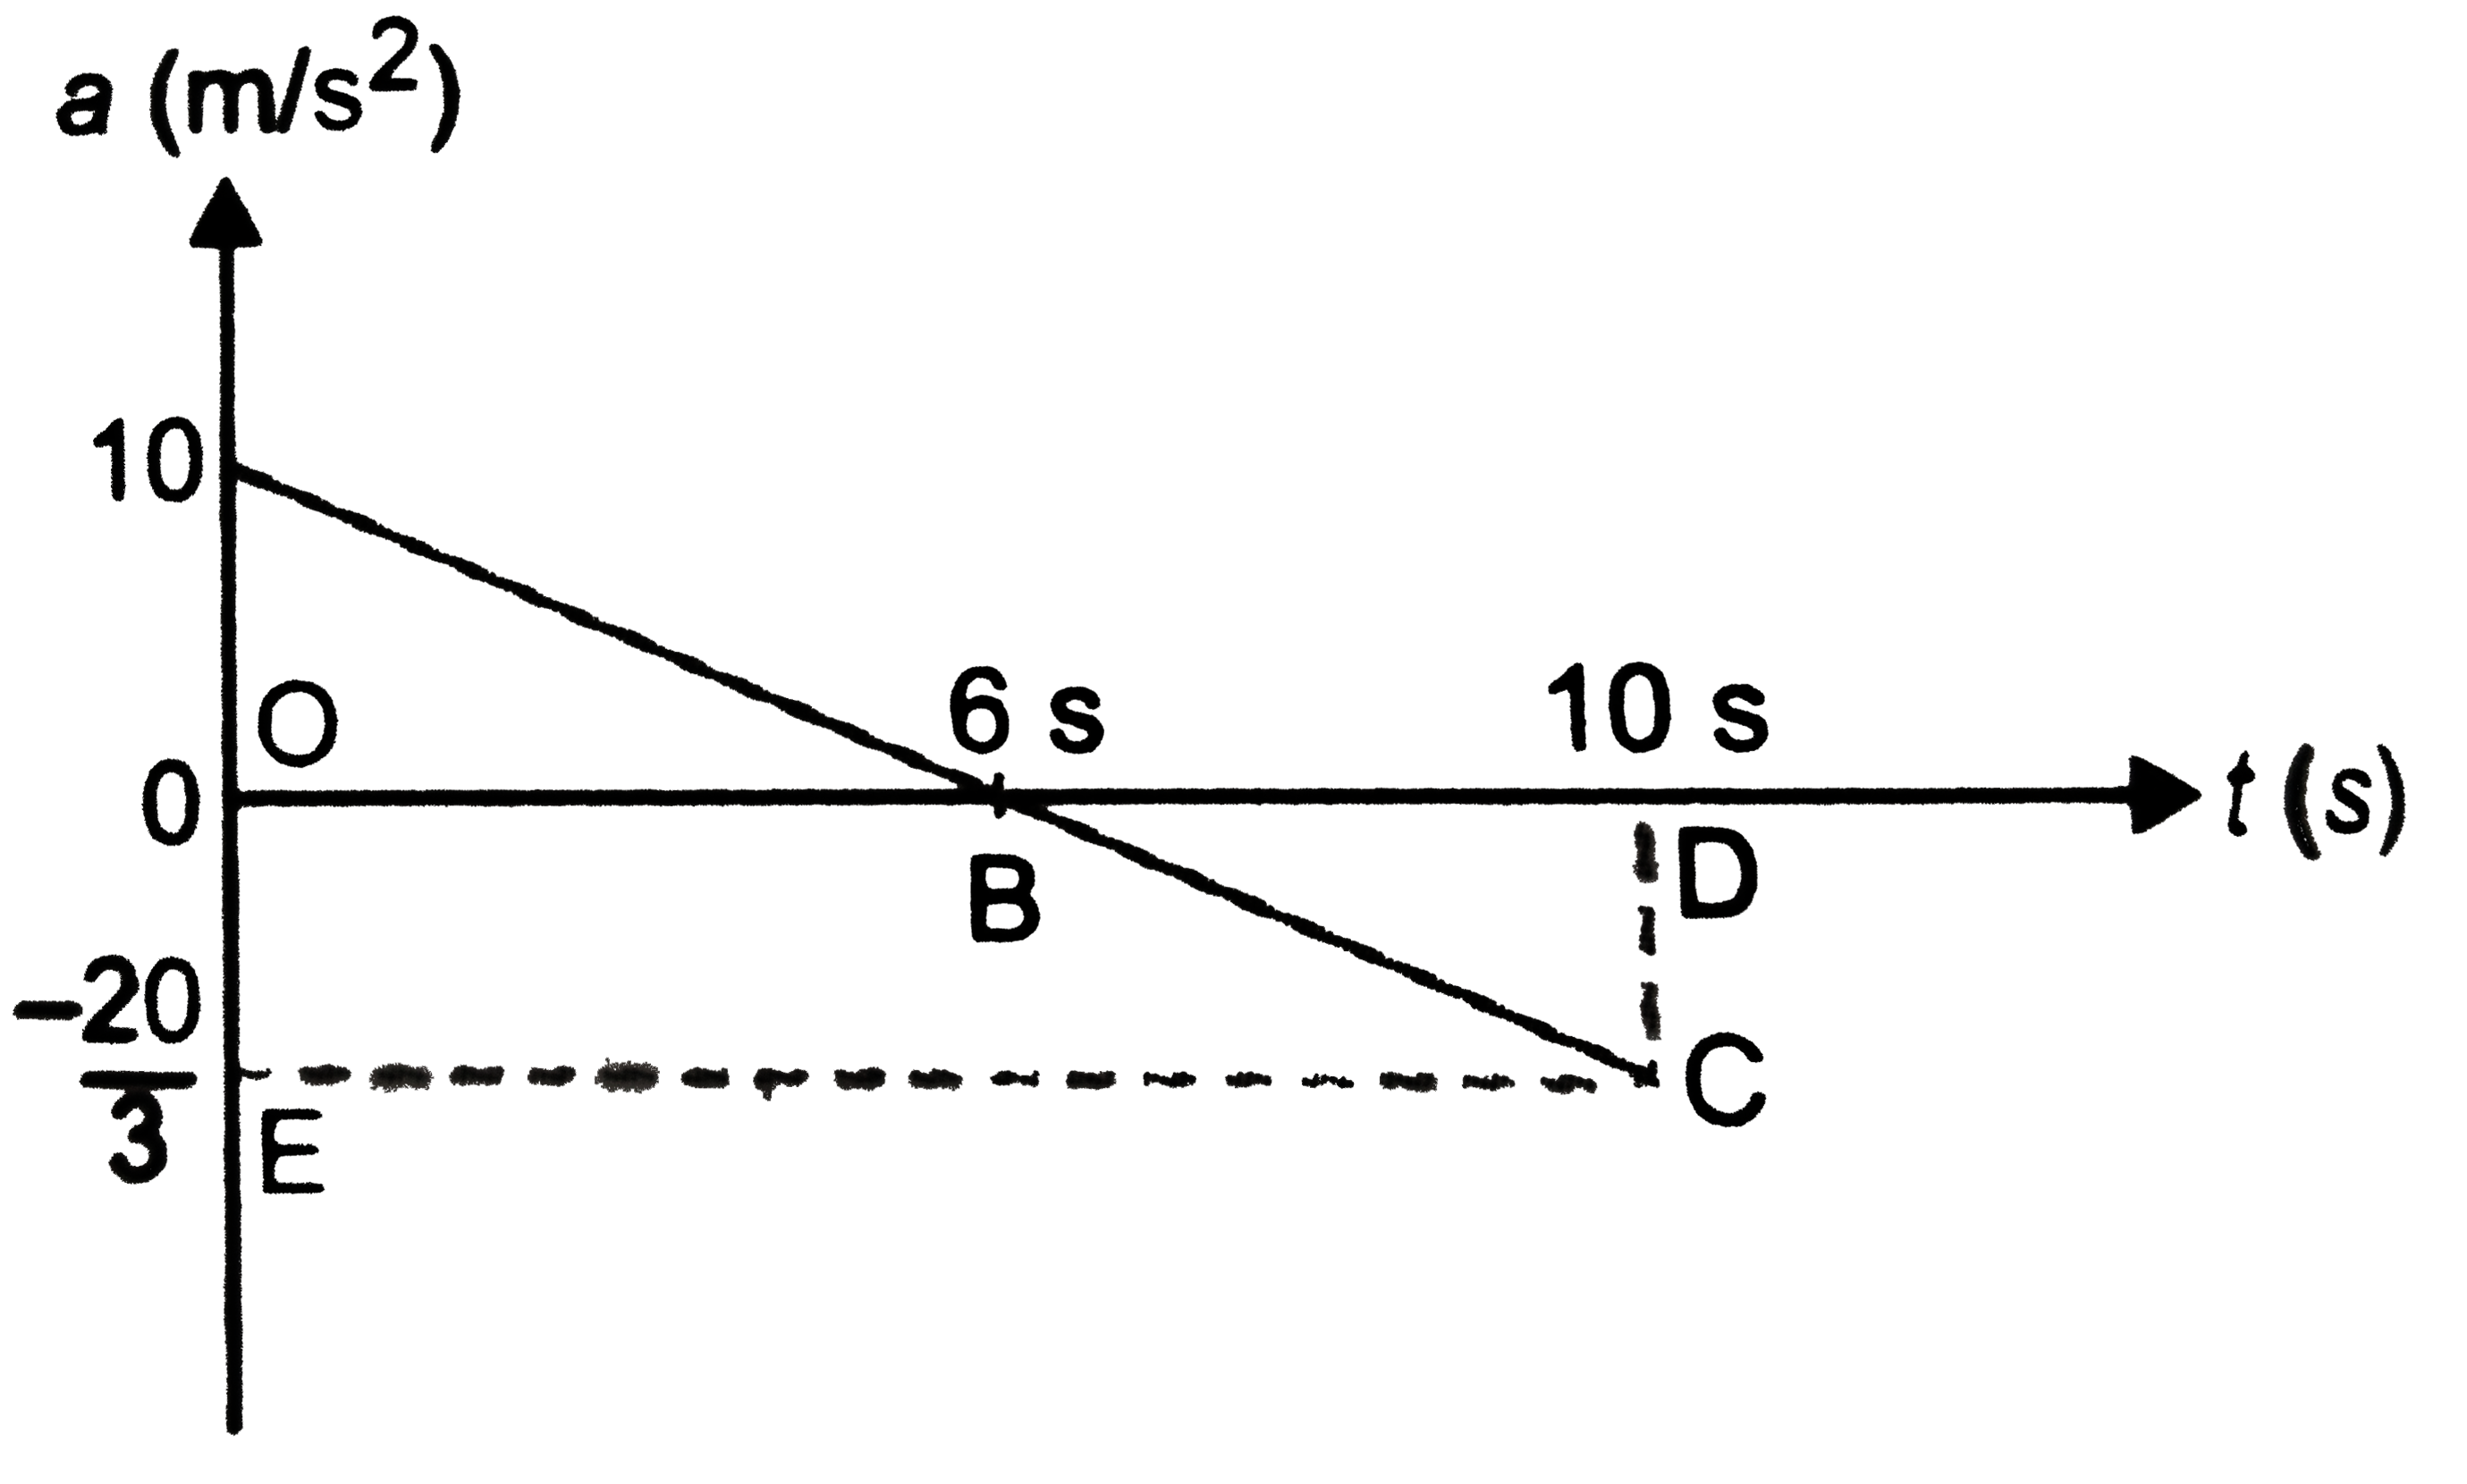
The acceleration time graph of a particle is shown in the Fig. 2 (CF). 11. At time t=0s velocity of the particle is 8ms−1. Its velocity t=10s is.
 .
.
From acceleration - time graph. Area under the
curve and t - axis represent to change in velocity.
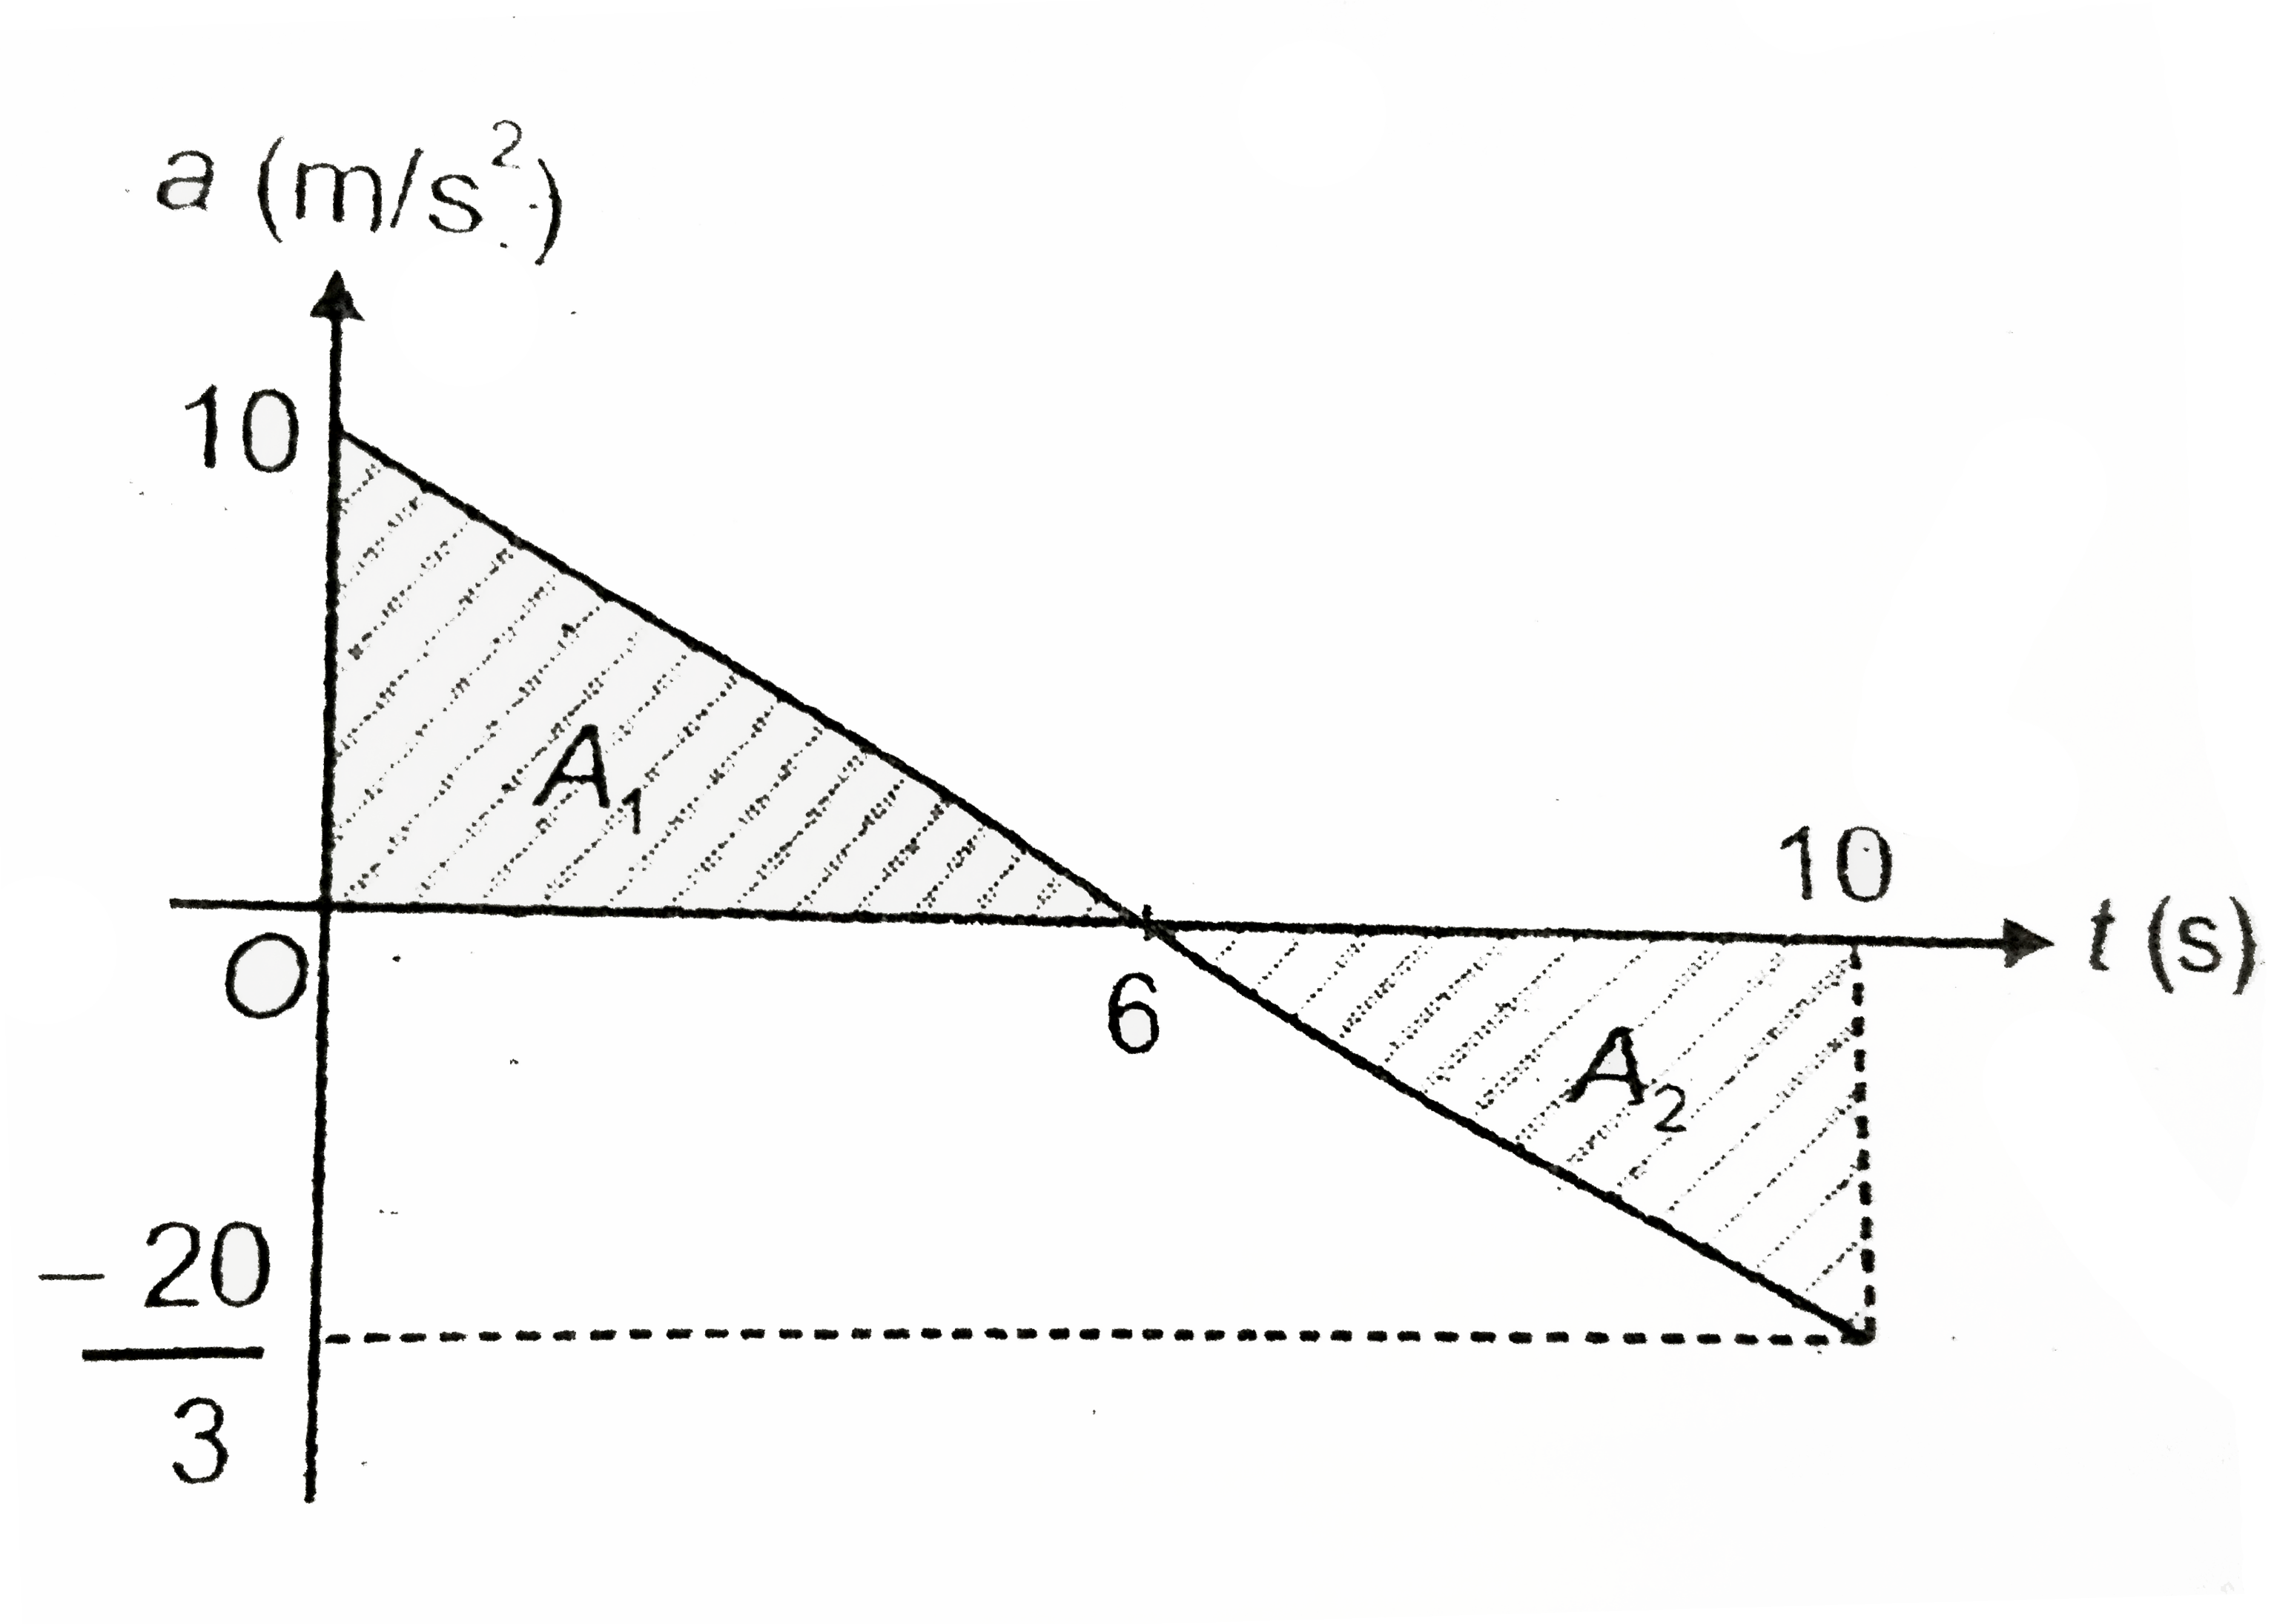
A1=12×(6−0)×(10−0)
=12×6×10=30m/s
A2=12×(10−6)×(203)=12×4×203=403m/s
Change in velocity=vf−vi=30+(−403)=90−403=503
vf−8=503
vf=8+503=24+503=743m/s
Topper's Solved these Questions
- MOTION IN STRAIGHT LINEBOOK - AAKASH INSTITUTE ENGLISHCHAPTER - MOTION IN STRAIGHT LINEEXERCISE - Try Yourself
40 Videos
- MOTION IN STRAIGHT LINEBOOK - AAKASH INSTITUTE ENGLISHCHAPTER - MOTION IN STRAIGHT LINEEXERCISE - Assignment (SECTION - A)
50 Videos
- MOTION IN A STRAIGHT LINEBOOK - AAKASH INSTITUTE ENGLISHCHAPTER - MOTION IN A STRAIGHT LINEEXERCISE - ASSIGNMENT (SECTION - D)
15 Videos
- MOVING CHARGE AND MAGNESIUMBOOK - AAKASH INSTITUTE ENGLISHCHAPTER - MOVING CHARGE AND MAGNESIUMEXERCISE - SECTION D
16 Videos
Similar Questions
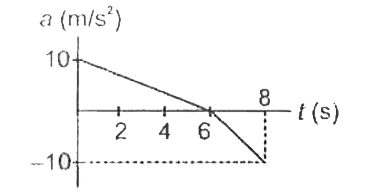
The acceleration - time graph for a particle moving along x - axis is shown in figure, If the initial velocity of particle is −5m/s, the velocity at t = 8 s is
View SolutionThe acceleration-time graph of a particle moving in a straight line is as shown in figure. The velocity of the particle at time t=0 is 2m/s. The velocity after 2 seconds will be
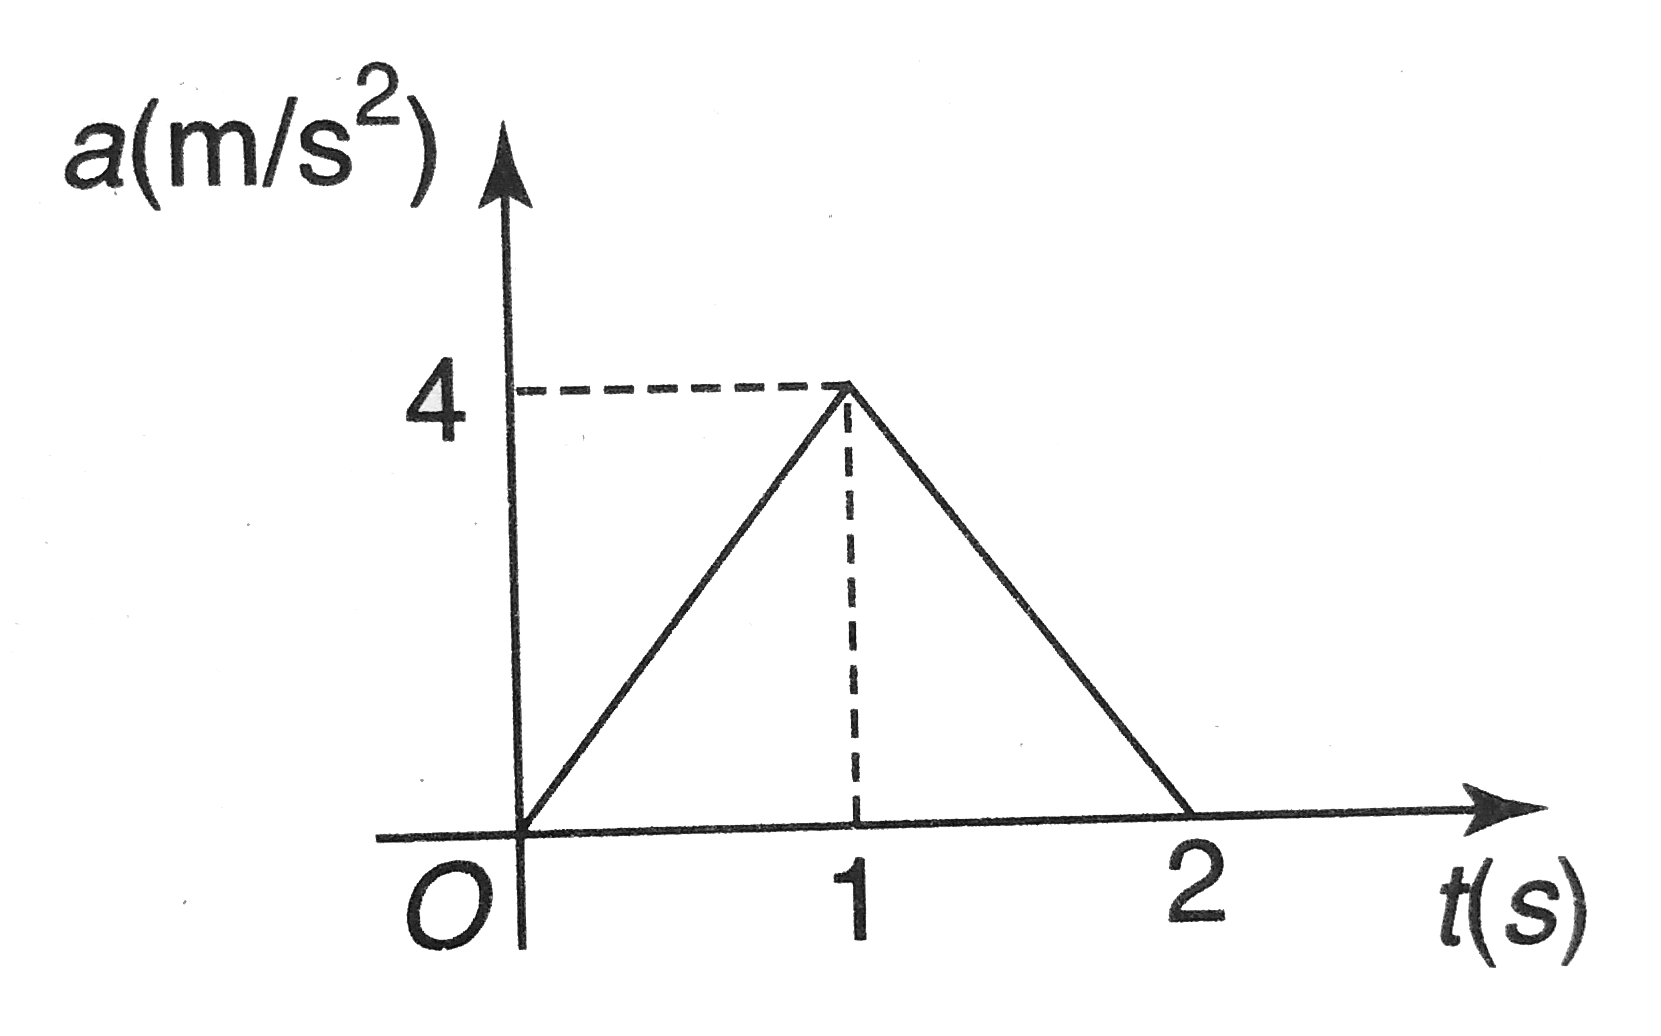
View SolutionThe acceleration-time graph of a particle moving in a straight line is as shown in figure. The velocity of the particle at time t=0 is 2m/s. The velocity after 2 seconds will be

View SolutionThe acceleration-time graph of a particle moving along x-axis is shown in the figure. If the particle starts with velocity 3 m/s at t = 0, find the velocity of particle at t = 4 s.
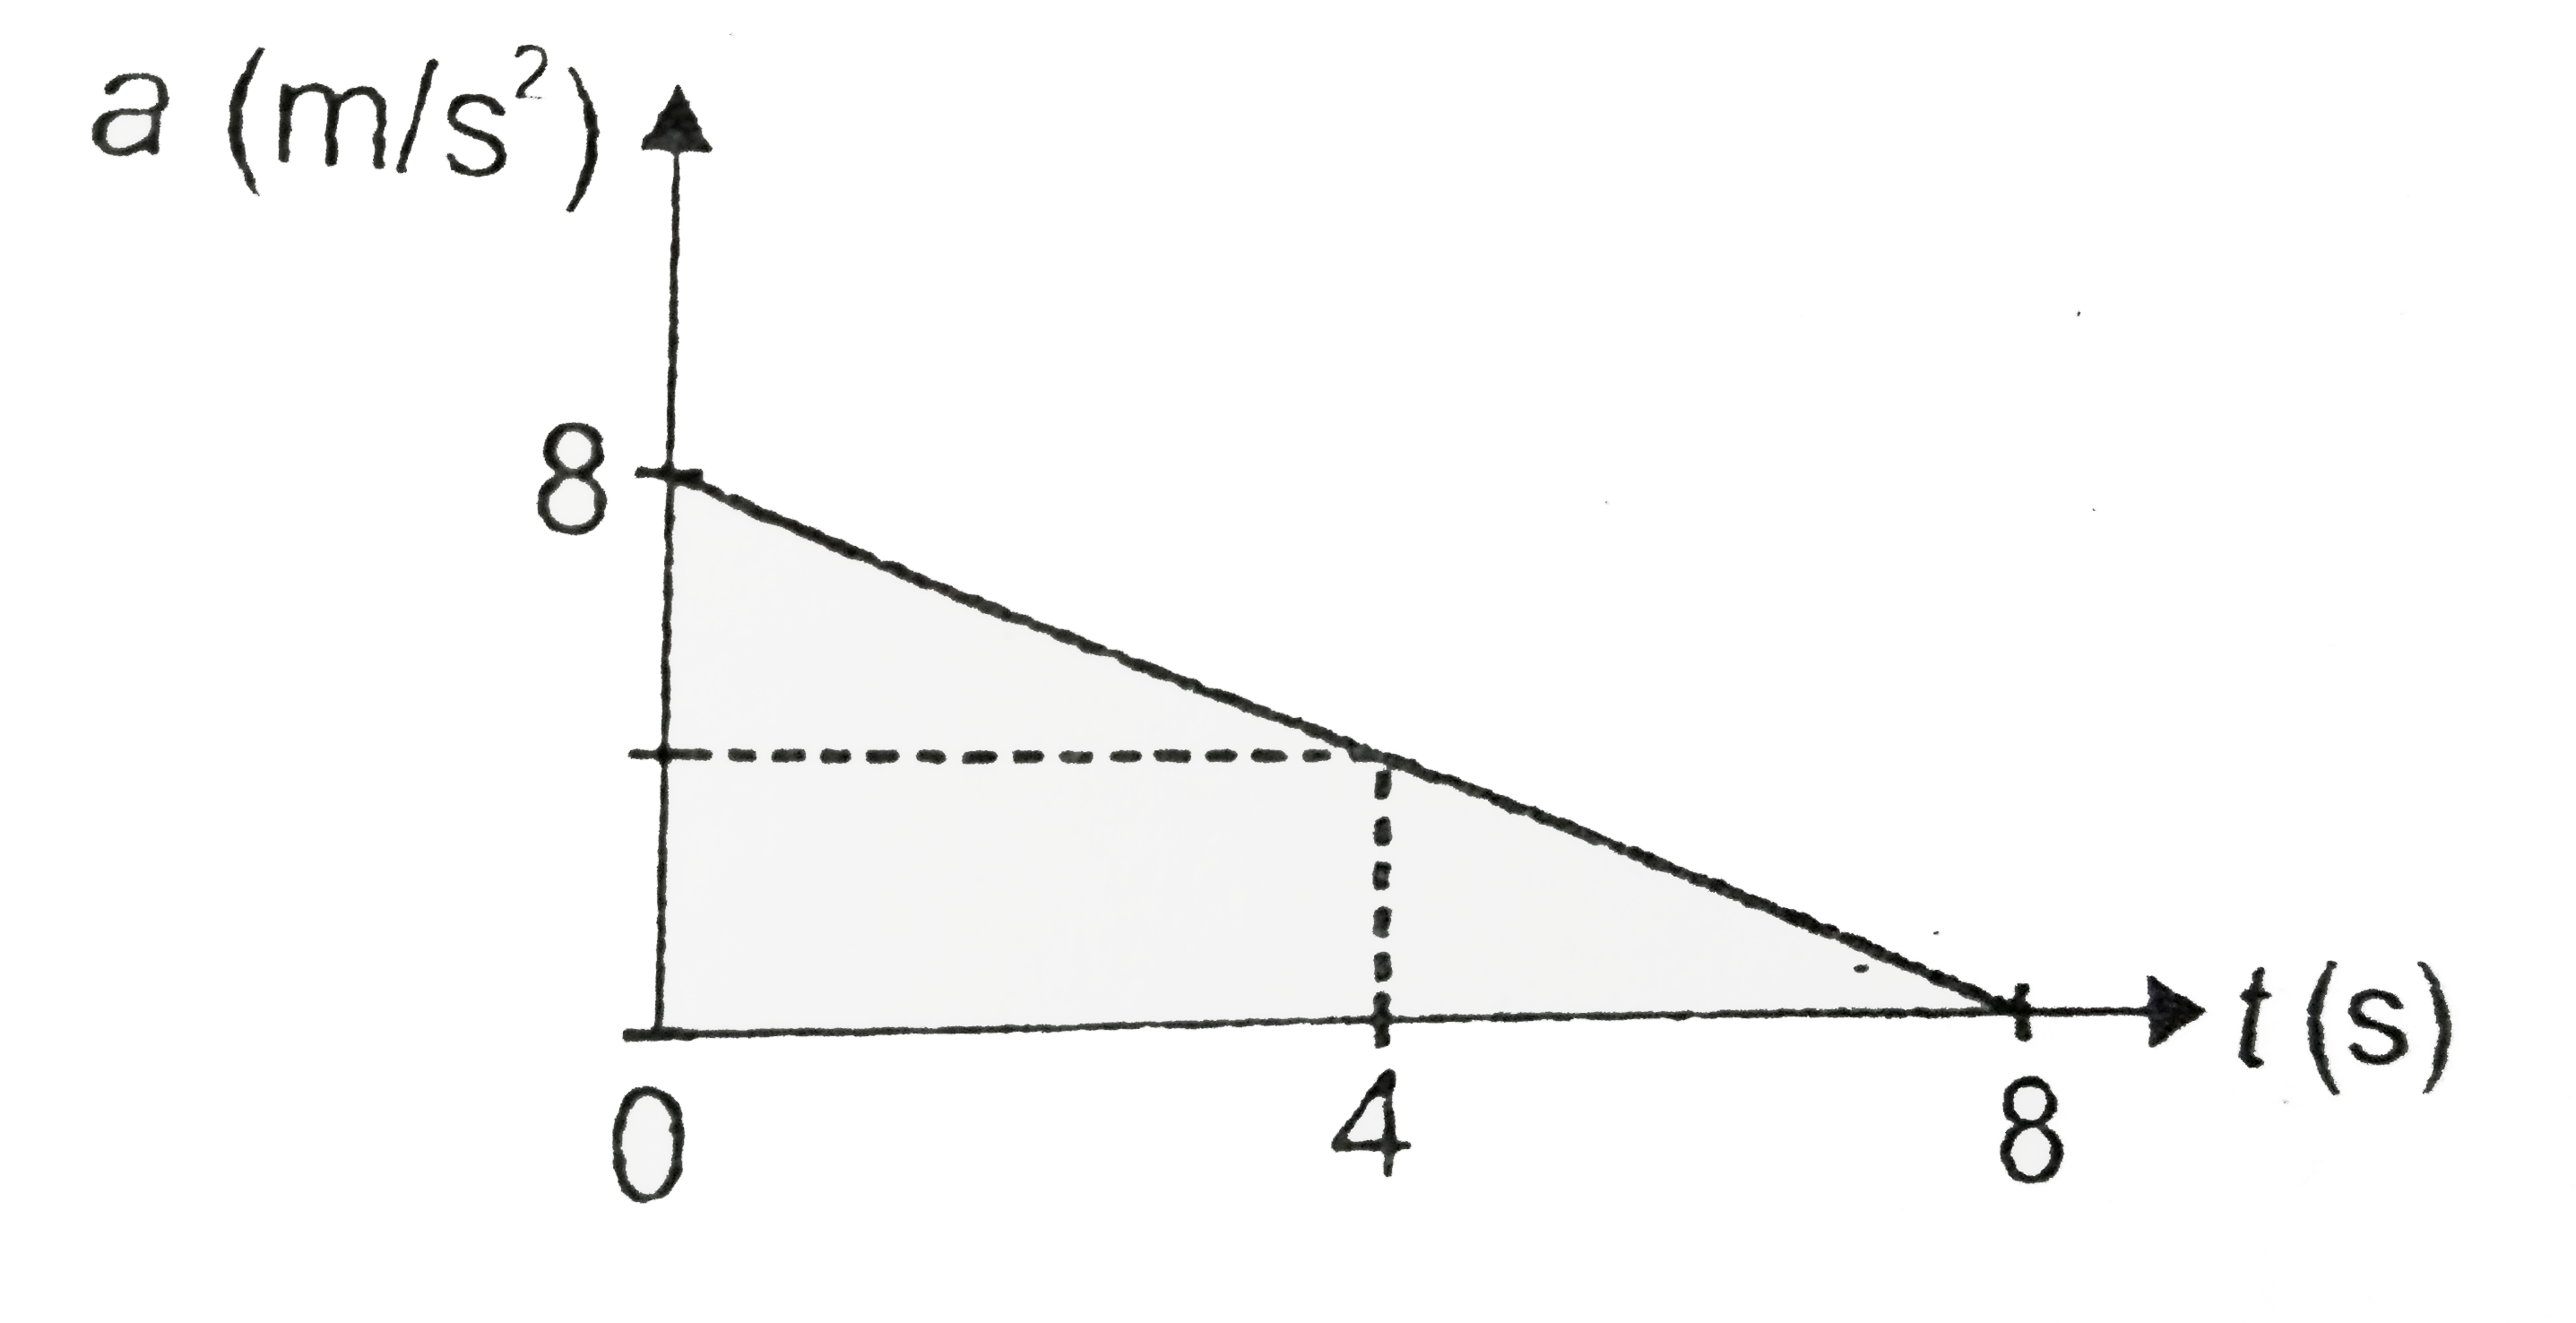
View SolutionAcceleration - time graph of a particle moving in a straight line is shown in figure. Velocity of particle at time t = 0 is 2ms−1. Find velocity at the end of fourth second.
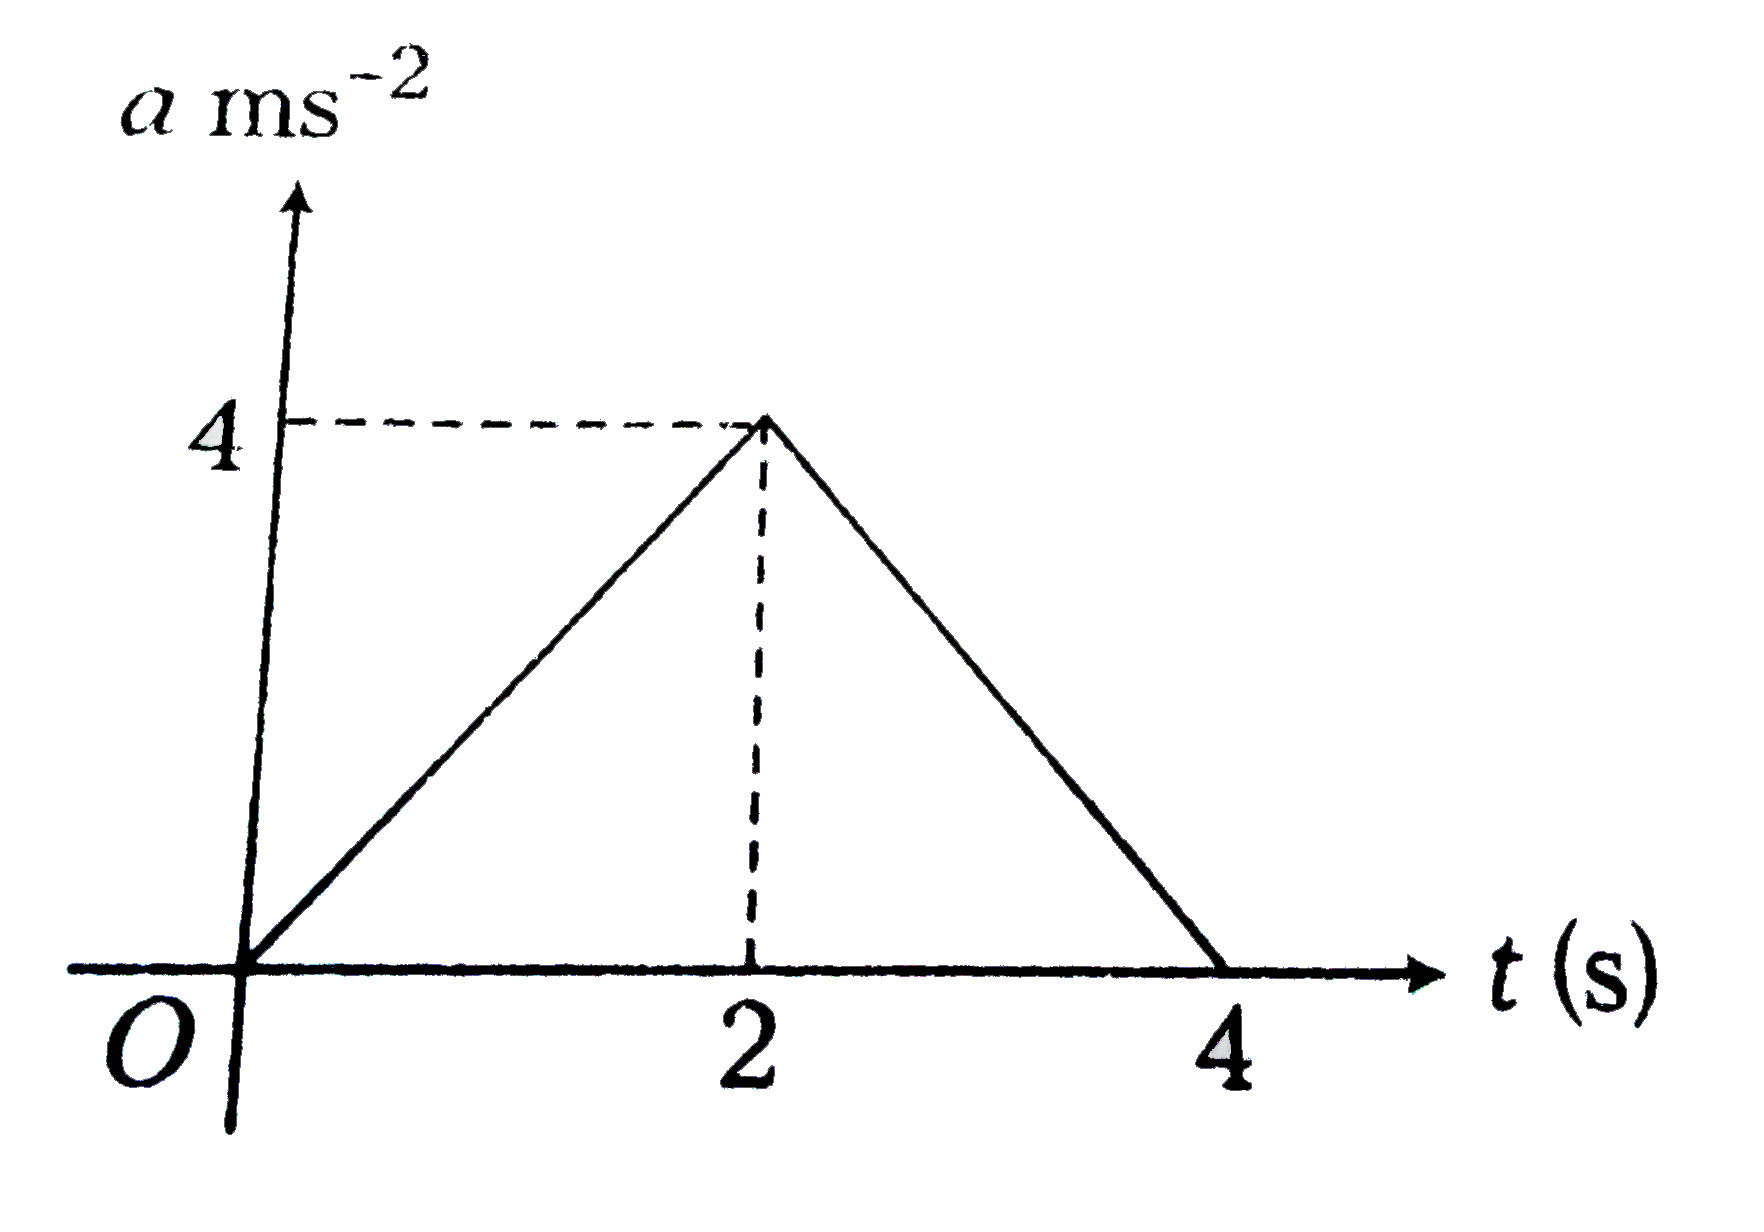
View SolutionThe acceleration-time graph of a particle moving along a straight line is as shown in. At what time the particle acquires its initial velocity?
 .
.
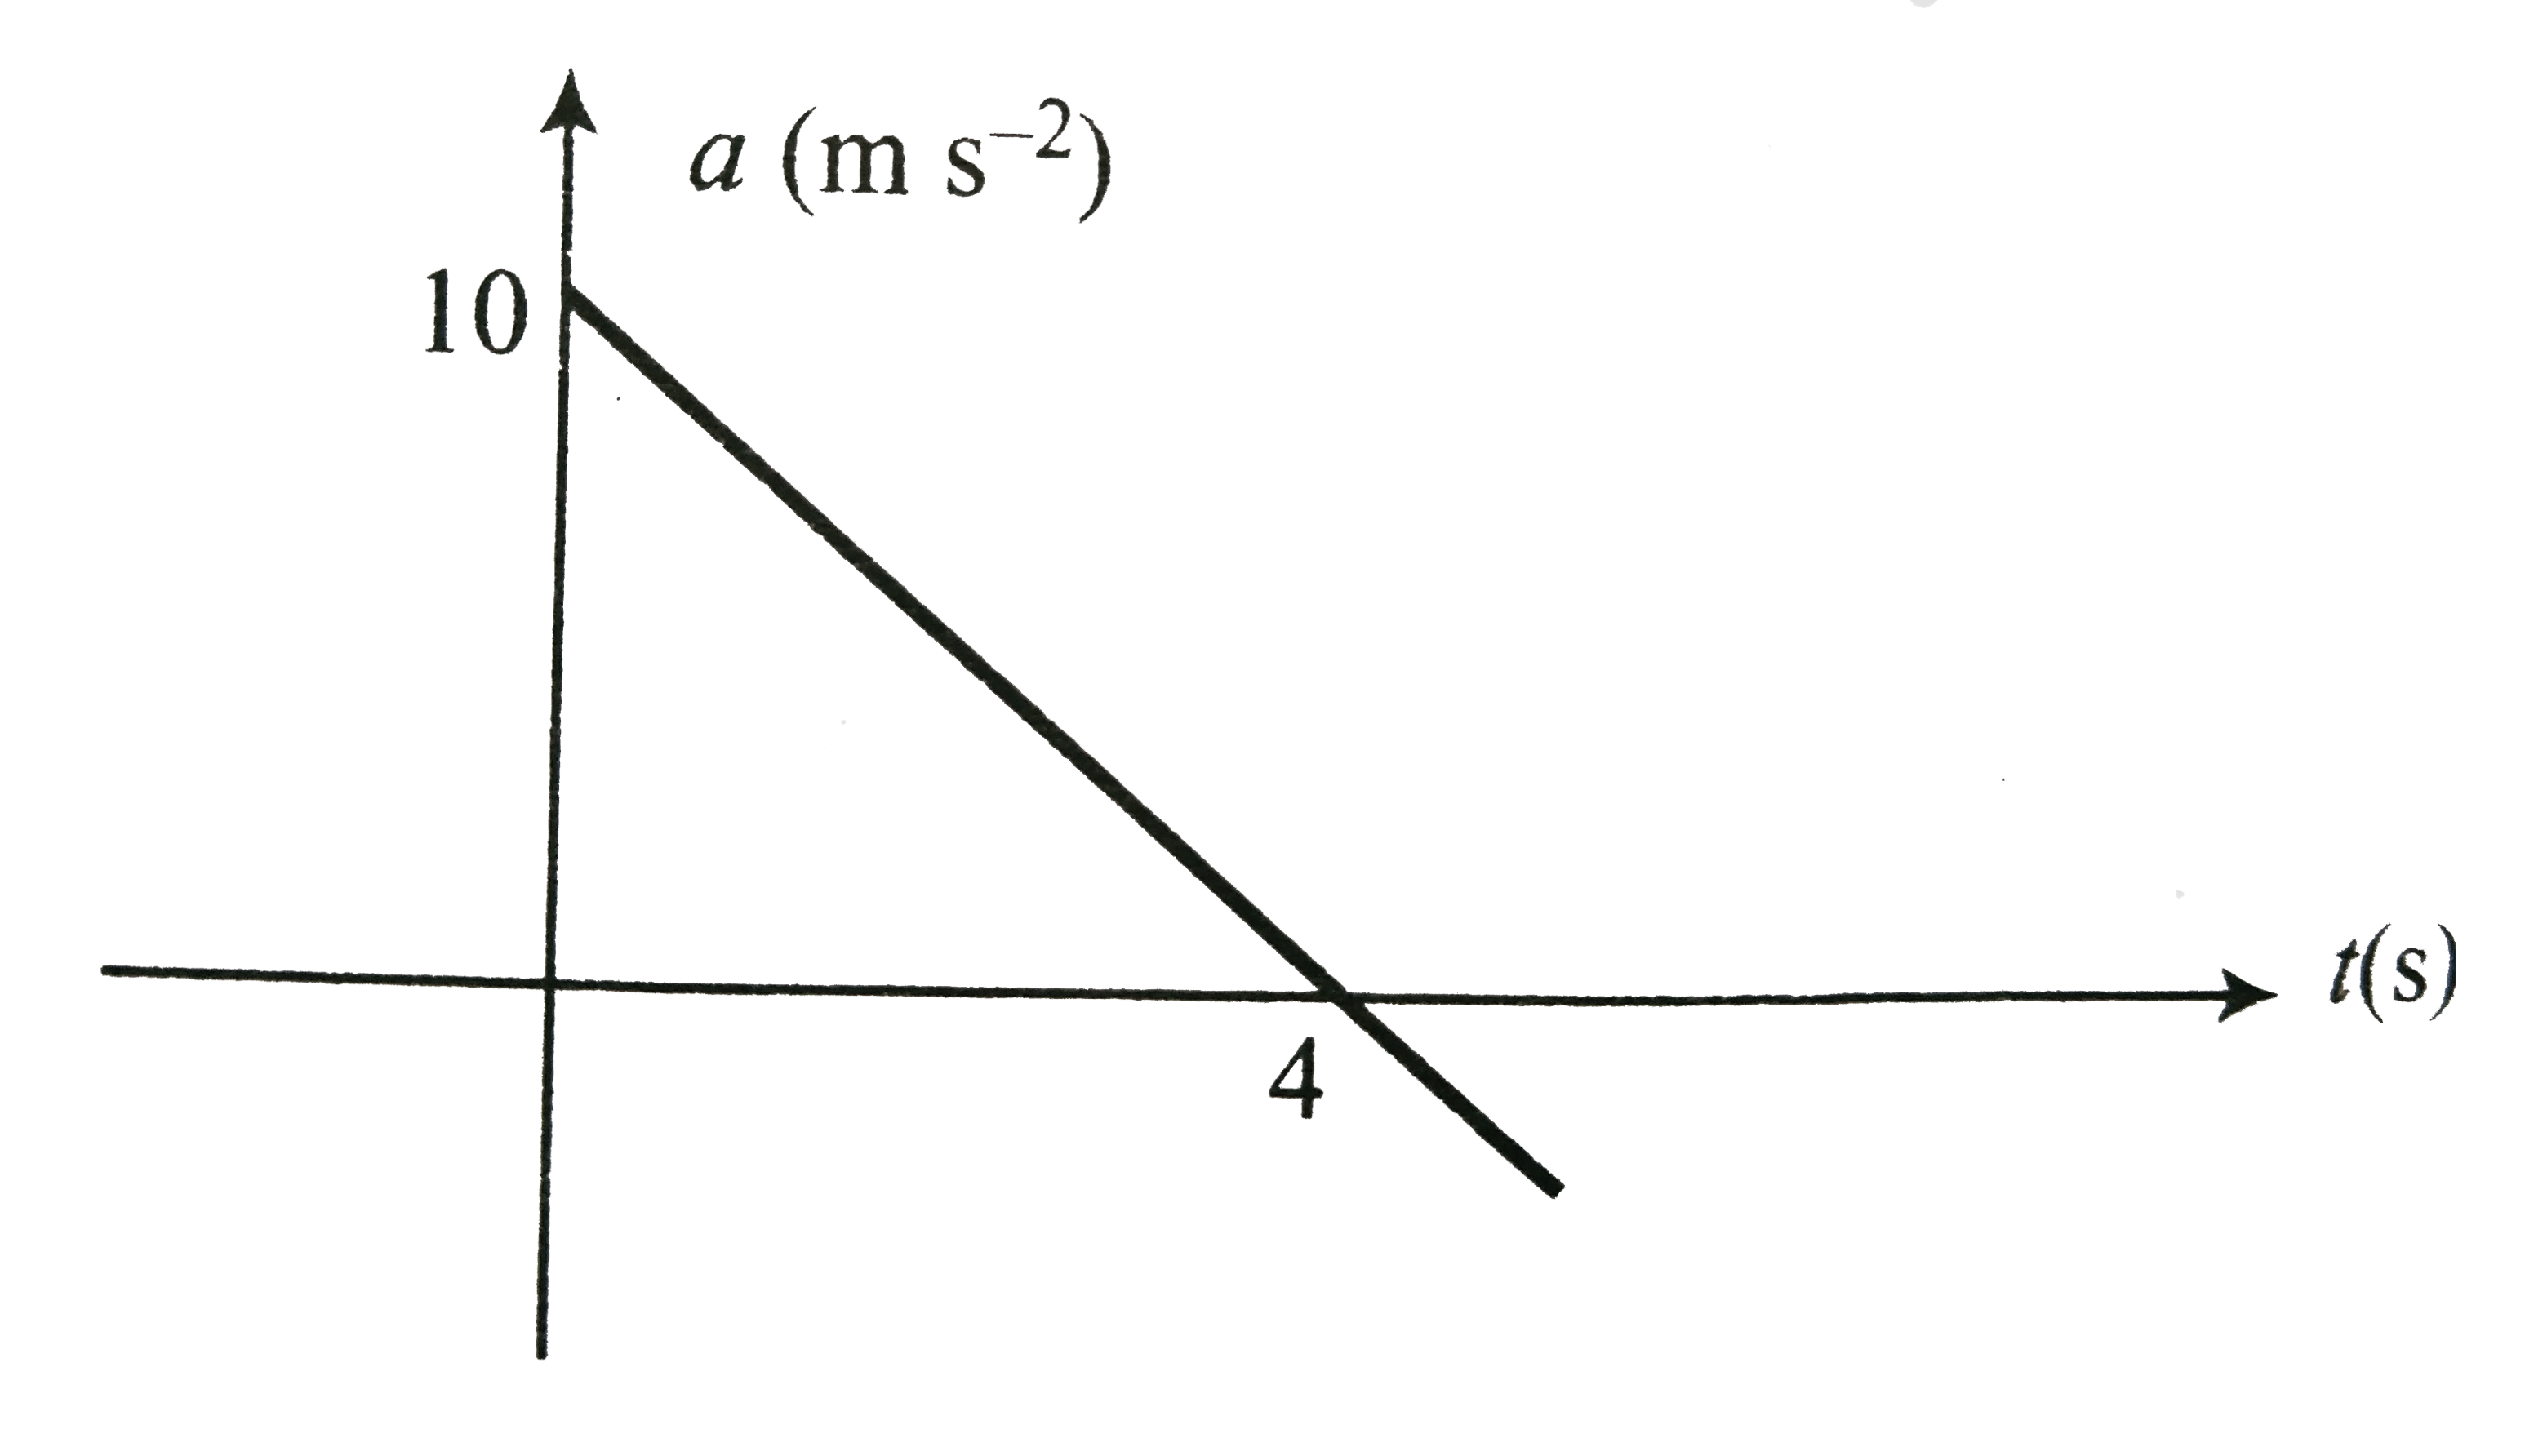
View SolutionThe acceleration-time graph of a particle moving along a straight line is as shown in. At what time the particle acquires its initial velocity?
 .
.
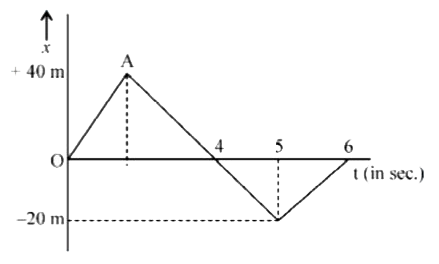
View Solutions-t graph of a particle in motion is shown in Fig. Calculate Average velocity
View SolutionThe acceleration-time (a−t) graph of a particle moving along straight line is as shown in figure. The time at which velocity of particle becomes equal to its initial velocity is

View Solutionvelocity-time graph of a particle moving in a straight line is as shown in figure. At time t=0, velocity of the particle is zero. Find
(a) average acceleration in a time interval from t=6s to t=12s,
(b) velocity of the particle at t=14s.
View Solution
