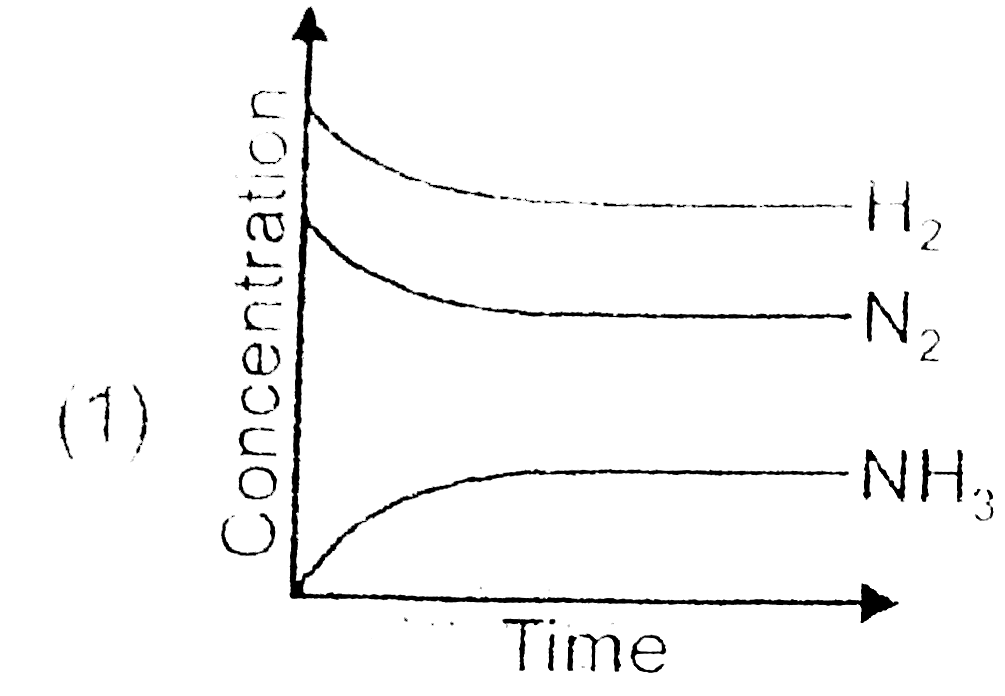
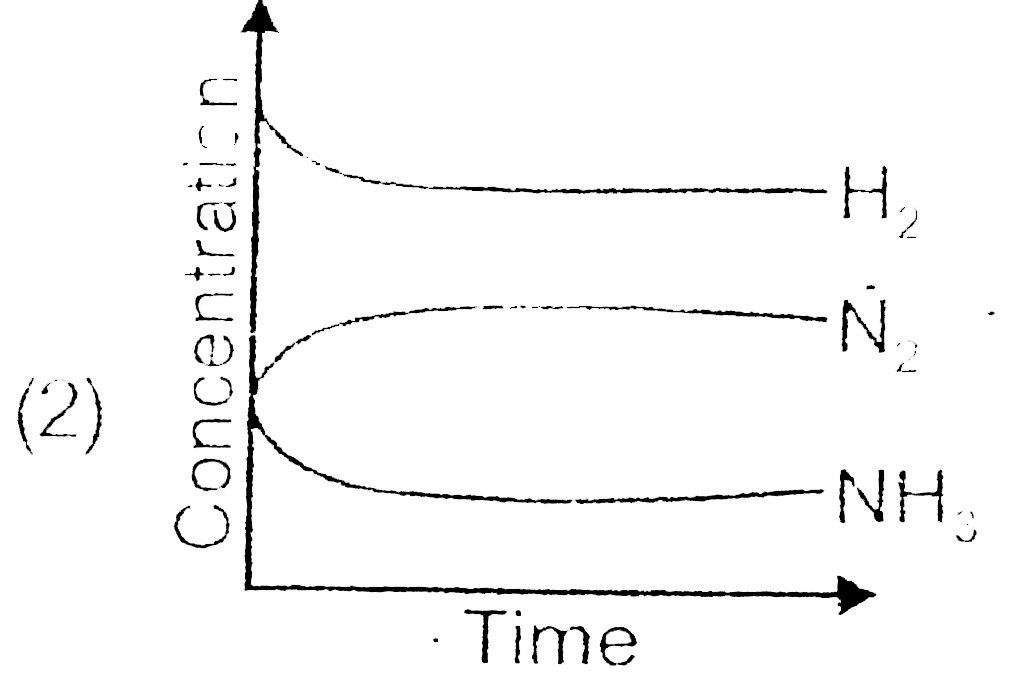
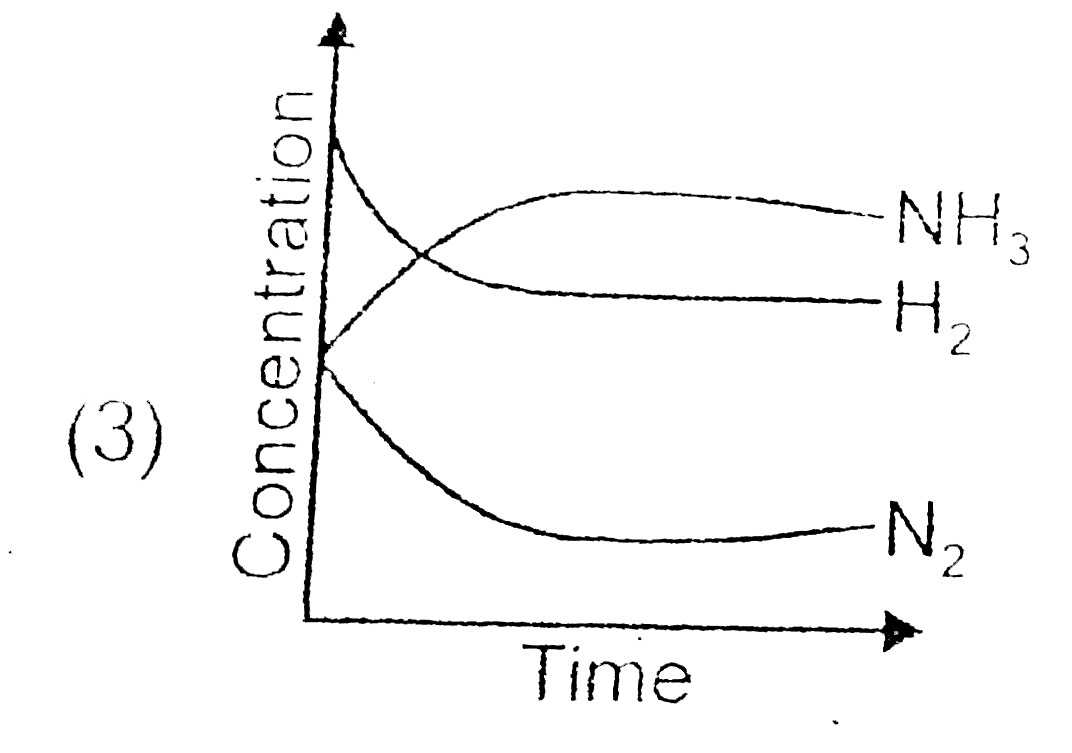
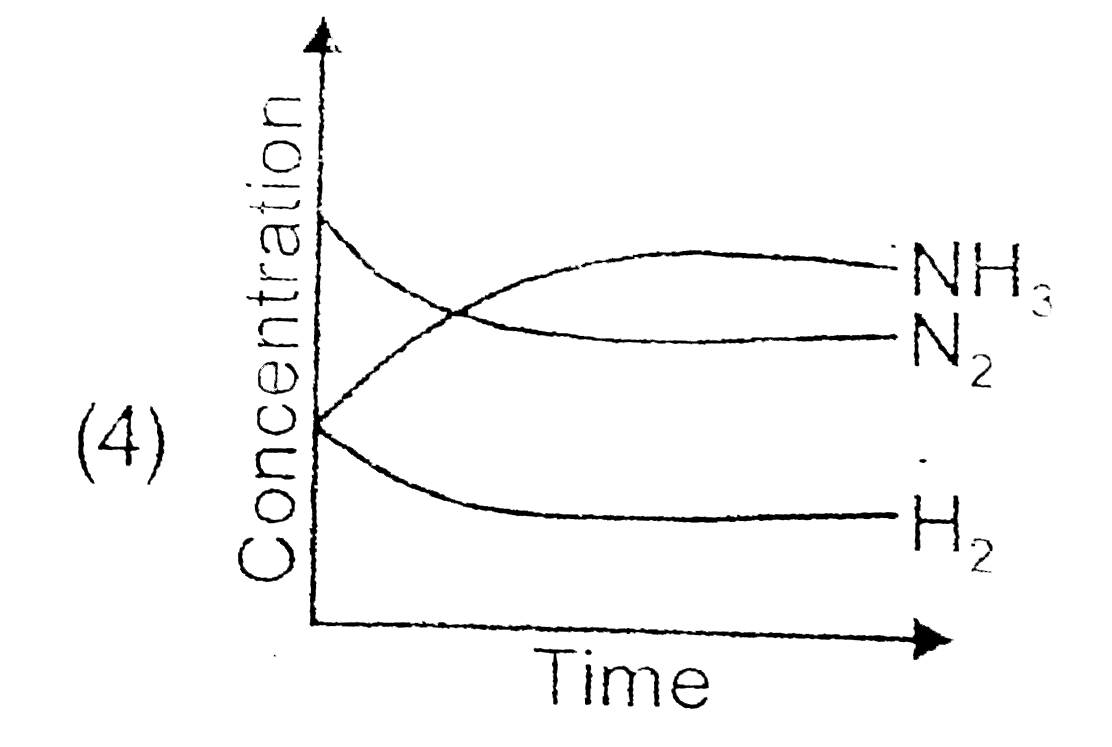
For the synthesis of ammonia by the reaction N2+3H2⇔2NH3 in the Haber's process ,the attainment of equilibrium is correctly predicated bt the curve


The correct Answer is:A
To solve the question regarding the synthesis of ammonia in the Haber process, we need to analyze the reaction and the equilibrium state it reaches. The reaction can be represented as:
N2+3H2⇌2NH3
1. Understanding the Reaction:
- The reaction involves nitrogen gas (N2) reacting with hydrogen gas (H2) to form ammonia (NH3).
- The stoichiometry of the reaction shows that 1 mole of nitrogen reacts with 3 moles of hydrogen to produce 2 moles of ammonia.
2. Initial Concentrations:
- At the start of the reaction (time t=0), we assume:
- Concentration of N2 = A
- Concentration of H2 = B
- Concentration of NH3 = 0 (no ammonia is formed initially).
3. Change in Concentrations:
- As the reaction progresses, N2 and H2 will decrease in concentration while NH3 will increase.
- Let the change in concentration of N2 be −x, then:
- Change in H2 = −3x (since 3 moles of H2 are consumed for every mole of N2).
- Change in NH3 = +2x (2 moles of NH3 are produced).
4. Equilibrium Concentrations:
- At equilibrium, the concentrations can be expressed as:
- Concentration of N2 = A−x
- Concentration of H2 = B−3x
- Concentration of NH3 = 2x
5. Graphical Representation:
- The graph should show:
- The concentration of NH3 starting from 0 and increasing to a maximum value (indicating formation).
- The concentrations of N2 and H2 should start from A and B respectively, and decrease over time until they reach a constant value at equilibrium.
6. Identifying the Correct Graph:
- The correct graph will show:
- NH3 starting from 0 and increasing, eventually leveling off at a certain concentration.
- Both N2 and H2 should decrease and also level off, indicating that they are being consumed to form NH3.
- Based on the analysis, the first graph (Graph A) matches this description, as it shows the correct trends for all species involved in the reaction.
Conclusion:
The correct graph that represents the attainment of equilibrium in the synthesis of ammonia via the Haber process is Graph A.
- The reaction involves nitrogen gas (N2) reacting with hydrogen gas (H2) to form ammonia (NH3).
- The stoichiometry of the reaction shows that 1 mole of nitrogen reacts with 3 moles of hydrogen to produce 2 moles of ammonia.
- At the start of the reaction (time t=0), we assume:
- Concentration of N2 = A
- Concentration of H2 = B
- Concentration of NH3 = 0 (no ammonia is formed initially).
- As the reaction progresses, N2 and H2 will decrease in concentration while NH3 will increase.
- Let the change in concentration of N2 be −x, then:
- Change in H2 = −3x (since 3 moles of H2 are consumed for every mole of N2).
- Change in NH3 = +2x (2 moles of NH3 are produced).
- At equilibrium, the concentrations can be expressed as:
- Concentration of N2 = A−x
- Concentration of H2 = B−3x
- Concentration of NH3 = 2x
- The graph should show:
- The concentration of NH3 starting from 0 and increasing to a maximum value (indicating formation).
- The concentrations of N2 and H2 should start from A and B respectively, and decrease over time until they reach a constant value at equilibrium.
- The correct graph will show:
- NH3 starting from 0 and increasing, eventually leveling off at a certain concentration.
- Both N2 and H2 should decrease and also level off, indicating that they are being consumed to form NH3.
- Based on the analysis, the first graph (Graph A) matches this description, as it shows the correct trends for all species involved in the reaction.
The correct graph that represents the attainment of equilibrium in the synthesis of ammonia via the Haber process is Graph A.
Topper's Solved these Questions
- EQUILIBRIUMBOOK - AAKASH INSTITUTE ENGLISHCHAPTER - EQUILIBRIUMEXERCISE - Assignment (SECTION-B)(OBJECTIVE TYPE QUESTIONS (ONE OPTION IS CORRECT)
20 Videos
- EQUILIBRIUMBOOK - AAKASH INSTITUTE ENGLISHCHAPTER - EQUILIBRIUMEXERCISE - Assignment (SECTION-C) (OBJECTIVE TYPE QUESTIONS (MORE THAN ONE OPTION ARE CORRECT)
10 Videos
- EQUILIBRIUMBOOK - AAKASH INSTITUTE ENGLISHCHAPTER - EQUILIBRIUMEXERCISE - ASSIGNMENT (SECTION -D)
20 Videos
- ENVIRONMENTAL CHEMISTRYBOOK - AAKASH INSTITUTE ENGLISHCHAPTER - ENVIRONMENTAL CHEMISTRYEXERCISE - ASSIGNMENT (SECTION-D) (Assertion - Reason Type Questions)
4 Videos
- GENERAL PRINCIPLES AND PROCESSES OF ISOLATION OF ELEMENTSBOOK - AAKASH INSTITUTE ENGLISHCHAPTER - GENERAL PRINCIPLES AND PROCESSES OF ISOLATION OF ELEMENTSEXERCISE - Assignment (Section-D) Assertion-Reason Type Question
15 Videos
Similar Questions
Knowledge Check
In the reaction,
N2(g)+3H2(g)⇔2NH3(g)
the value of the equilibrium constant depends onAvolume of the reaction vesselBtotal pressure of the systemCthe initial concentration of nitrogen and hydrogenDthe temperature
For the the manufacture of ammonia by the reaction N2+3H2⇔2NH3+21.9 Kcal. the favourable condition are
View SolutionIn a chemical reaction
N2+3H2⇔2NH3, at equilibrium point
View SolutionIn the reaction N2(g)+3H2(g)⇔2NH3(g), the value of the equlibrium constant depends on
View SolutionFor a reaction N2+3H2⇔2NH3, the value of KC does not depends upon:
View SolutionFor the reaction
N2(g)+3H2(g)⇔2NH3(g),ΔH=?
View Solution1 mol of N2 is mixed with 3 mol of H2 in a litre container. If 50% of N2 is converted into ammonia by the reaction N2(g)+3H2(g)⇔2NH3(g), then the total number of moles of gas at the equilibrium are
View SolutionFor the reaction : N2(g)+3H2(g)⇔2NH3(g), ΔH=−ve, the correct statement is :
View Solution
