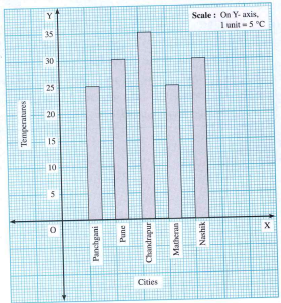
This bar graph shows the temperatures in degree Celsius in different cities on a certain day in February. Observe the graph and answer the questions :
Which cities had a maximum temperature of 30∘C ?
 Solution in Marathi
Pune and Nashik had the maximum temperature of 30∘C
Topper's Solved these Questions
Similar Questions
What would be the yearly interest on ₹ 6000 at 10 p.c.p.a. ?
View SolutionObserve the figure and name
Collinear points

View SolutionDetermine the point of symmetry of a regular hexagon.
View SolutionMatch the following Column A to Column B

View SolutionMatch the following Column A to Column B

View SolutionMatch the following Column A to Column B

View SolutionThe inequation represented by the graph given below is :
View SolutionThe inequation that best describes the graph given below is _________
View SolutionThe inequation that best describes the following graph is _________
View SolutionThis bar graph shows the temperatures in degree Celsius in different cities on a certain day in February. Observe the graph and answer the questions :
What data is shown on the vertical and the horizontal lines ?
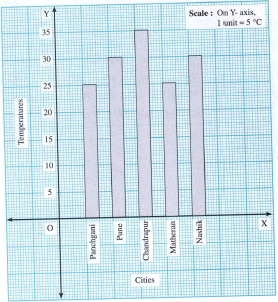
View SolutionThis bar graph shows the temperatures in degree Celsius in different cities on a certain day in February. Observe the graph and answer the questions :
Which city had the highest temperature ?
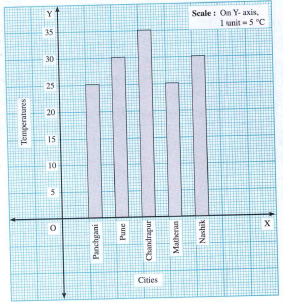
View SolutionThis bar graph shows the temperatures in degree Celsius in different cities on a certain day in February. Observe the graph and answer the questions :
Which cities had equal maximum temperatures ?
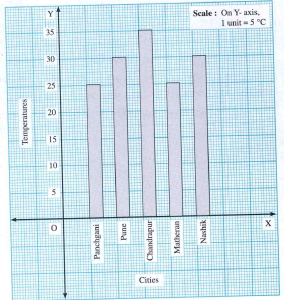
View SolutionThis bar graph shows the temperatures in degree Celsius in different cities on a certain day in February. Observe the graph and answer the questions :
Which cities had a maximum temperature of 30∘C ?

View SolutionThis bar graph shows the temperatures in degree Celsius in different cities on a certain day in February. Observe the graph and answer the questions :
What is the difference between the maximum temperatures of Panchgani and Chandrapur ?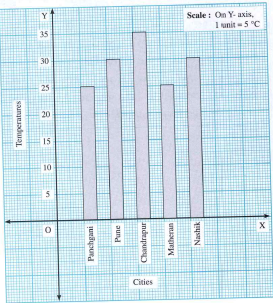
View SolutionThis bar graph shows the temperatures in degree Celsius in different cities on a certain day in February. Observe the graph and answer the questions :
What data is shown on the vertical and the horizontal lines ?

View Solution
