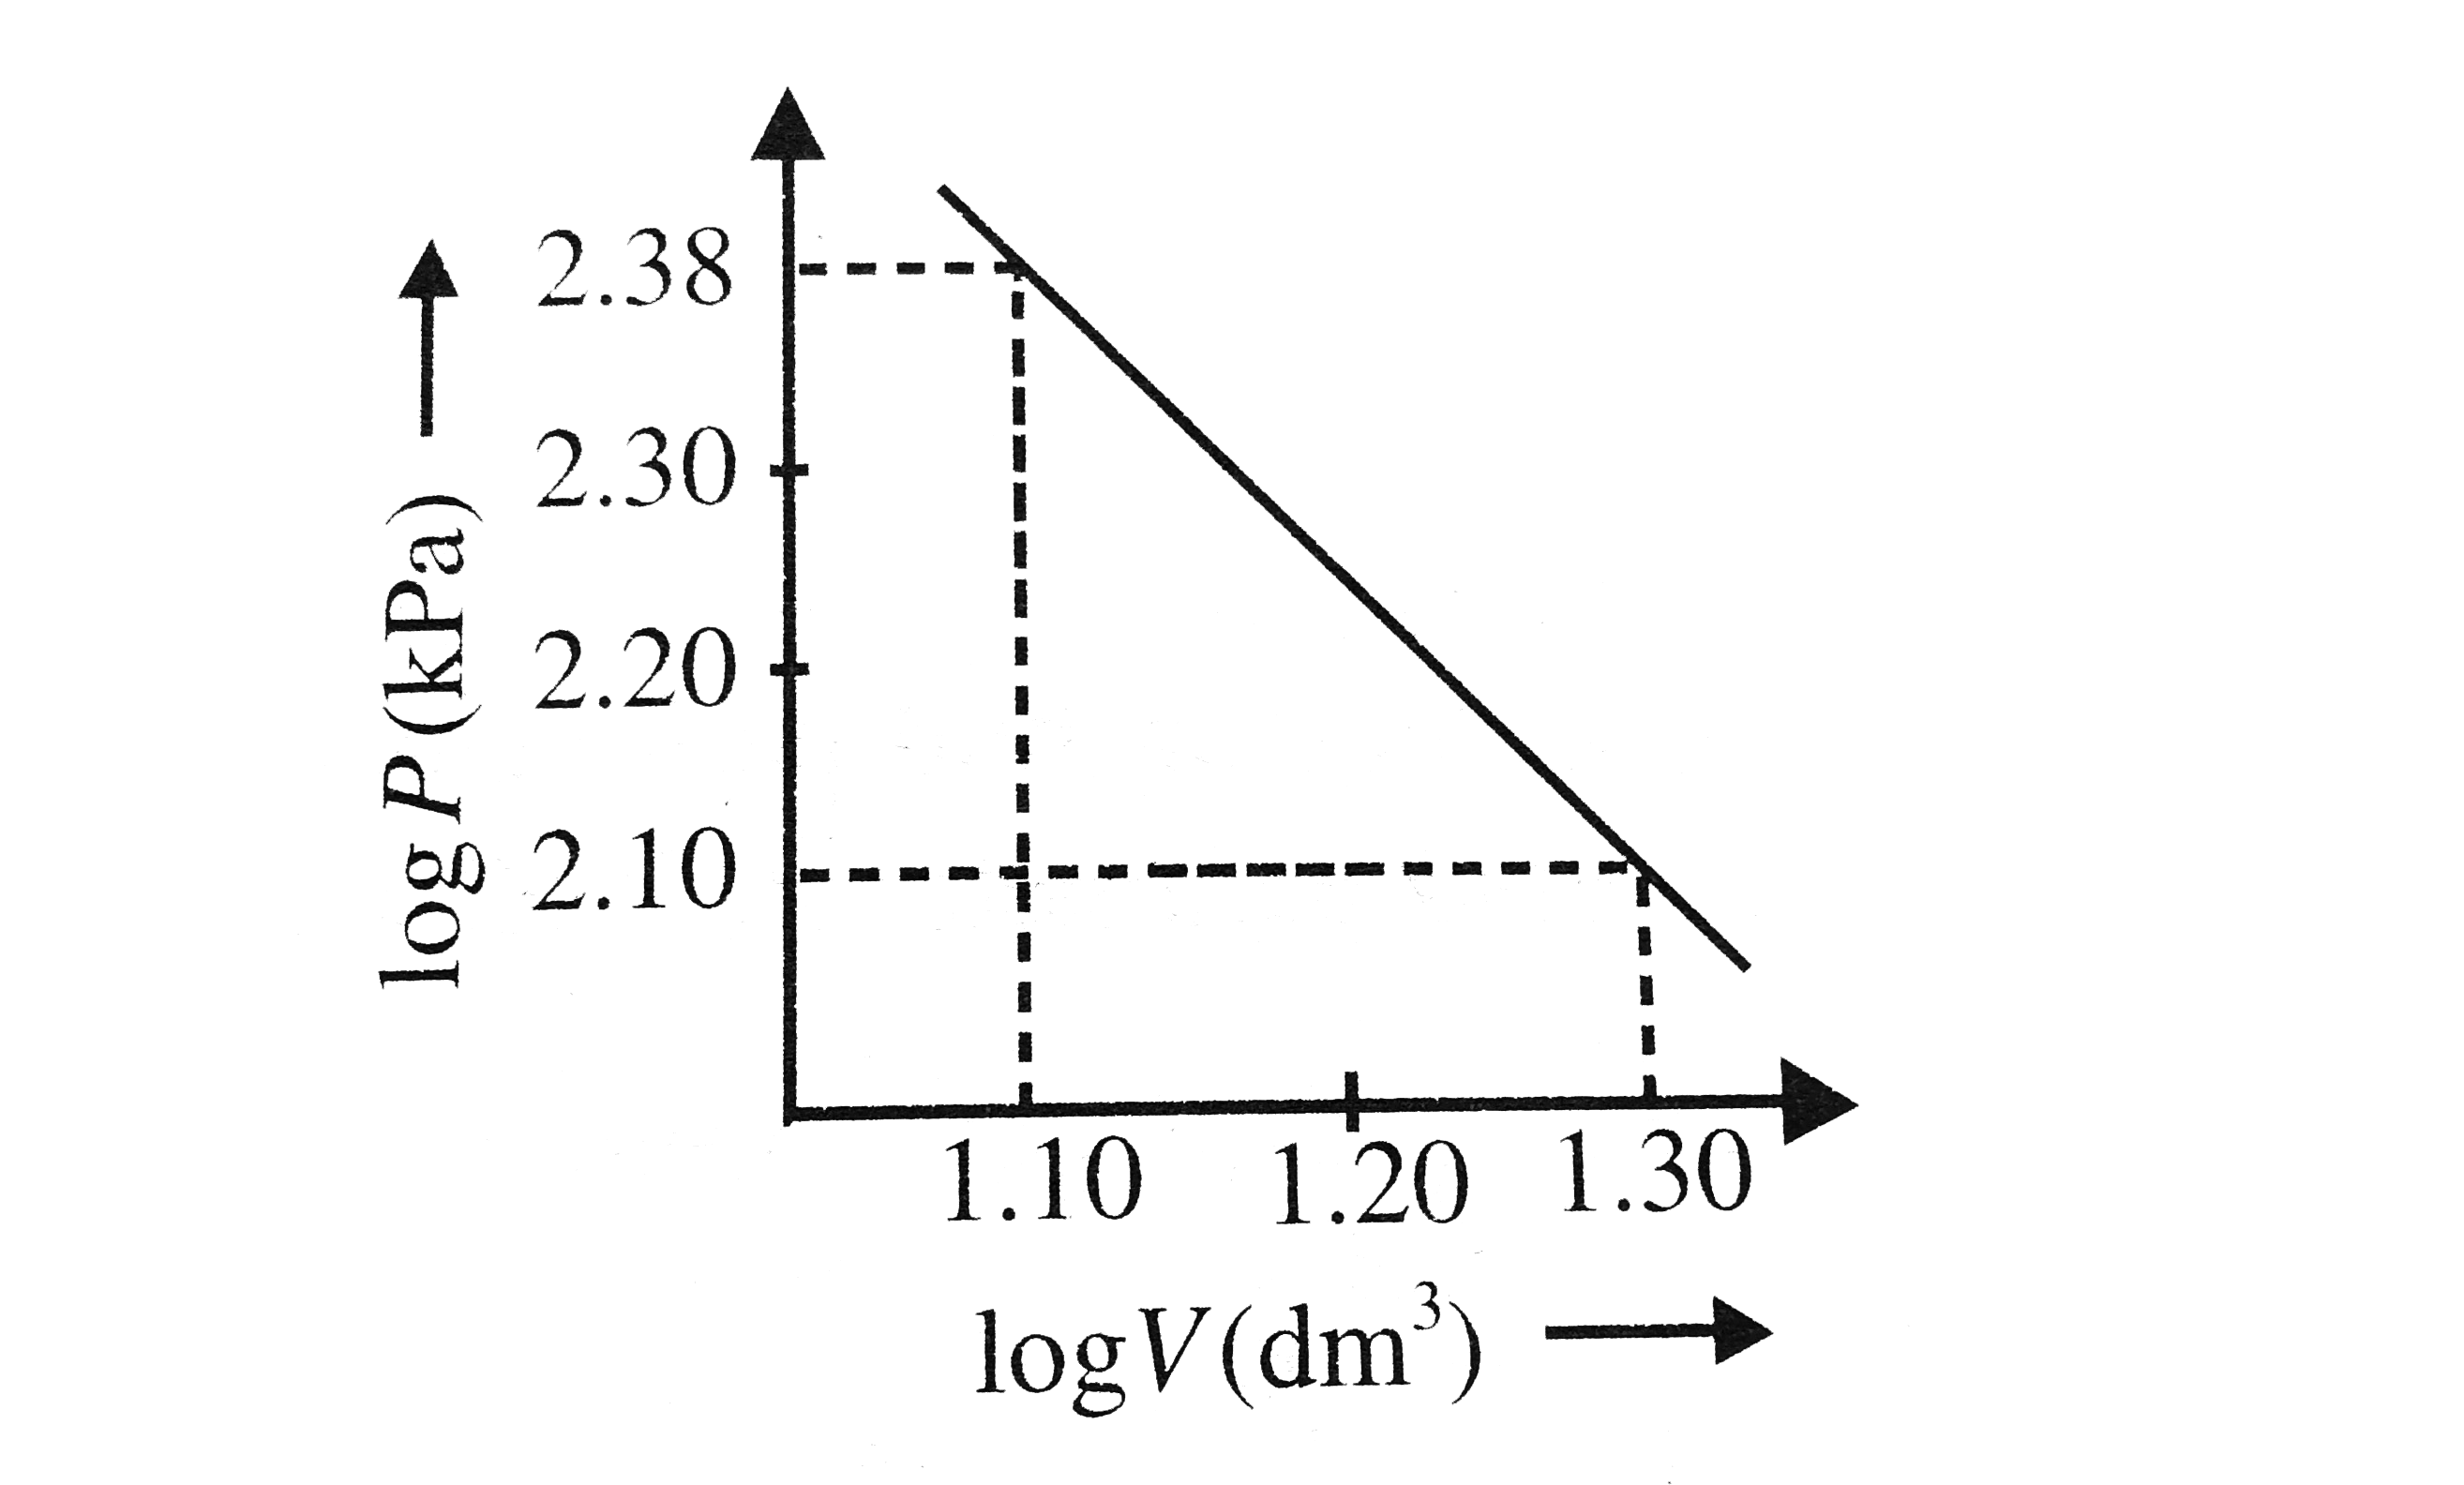
Logarithms of readings of pressure and volume for an ideal gas were plotted on a graph as shown in Fig. By measuring the gradient, it can be shwon that the gas may be
monatomic and undergoing an adiabatic change
monatomic and undergoing an isothermal change
diatomic and undergoing an adiabatic change
triatomic and undergoing an isothermal change
The correct Answer is:C
c. logP=mlogV+C1, where C1 is positive, m is slope
m=2.38−2.101.1−1.3=1.4
logP=1.4logV+C1
logPV1.4=C1
PV1.4=k
Thus, it represent an ideal diatomic gas undergoing adiabatic change.
Topper's Solved these Questions
- KINETIC THEORY OF GASES AND FIRST LAW OF THERMODYNAMICSBOOK - CENGAGE PHYSICS ENGLISHCHAPTER - KINETIC THEORY OF GASES AND FIRST LAW OF THERMODYNAMICSEXERCISE - Multiple Corrects
29 Videos
- KINETIC THEORY OF GASES AND FIRST LAW OF THERMODYNAMICSBOOK - CENGAGE PHYSICS ENGLISHCHAPTER - KINETIC THEORY OF GASES AND FIRST LAW OF THERMODYNAMICSEXERCISE - Assertion-Reasoning
6 Videos
- KINETIC THEORY OF GASES AND FIRST LAW OF THERMODYNAMICSBOOK - CENGAGE PHYSICS ENGLISHCHAPTER - KINETIC THEORY OF GASES AND FIRST LAW OF THERMODYNAMICSEXERCISE - Subjective
22 Videos
- KINETIC THEORY OF GASESBOOK - CENGAGE PHYSICS ENGLISHCHAPTER - KINETIC THEORY OF GASESEXERCISE - Compression
2 Videos
- LINEAR AND ANGULAR SIMPLE HARMONIC MOTIONBOOK - CENGAGE PHYSICS ENGLISHCHAPTER - LINEAR AND ANGULAR SIMPLE HARMONIC MOTIONEXERCISE - Single correct anwer type
14 Videos
Similar Questions
Knowledge Check
If the pressure and the volume of certain quantity of ideal gas are halved, then its temperature
Ais doubledBbecomes one-fourthCremains constantDbecome four times
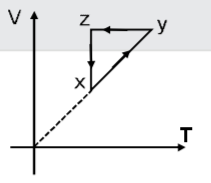
Choose the correct graph between pressure and volume of ideal gas.
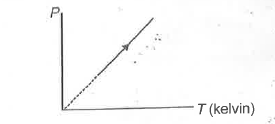
View SolutionThe graph of pressure and temperature for an ideal gas is as shown in figure. The given process is
View SolutionWrite the relation between pressure and volume for an adiabatic change in an ideal gas.
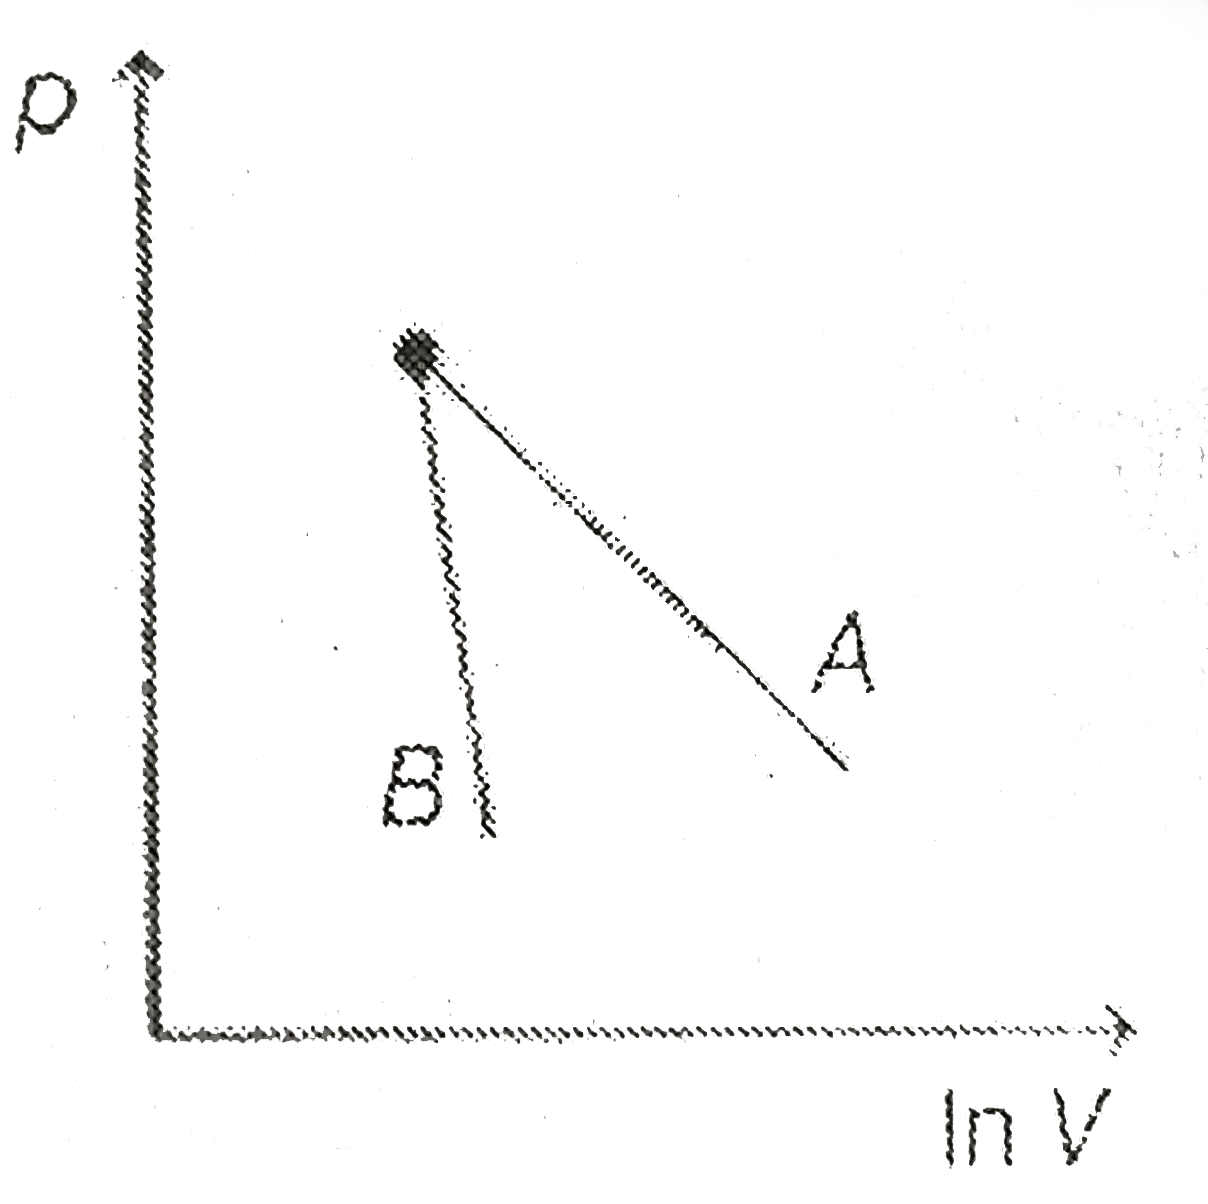
View SolutionThe figure shows the graph of logarithmic reading of pressure and volume for two ideal gases A and B undergoing adiabatic process. From figure, it can be concluded that
View SolutionIf both the temperature and the volume of an ideal gas are doubled, the pressure
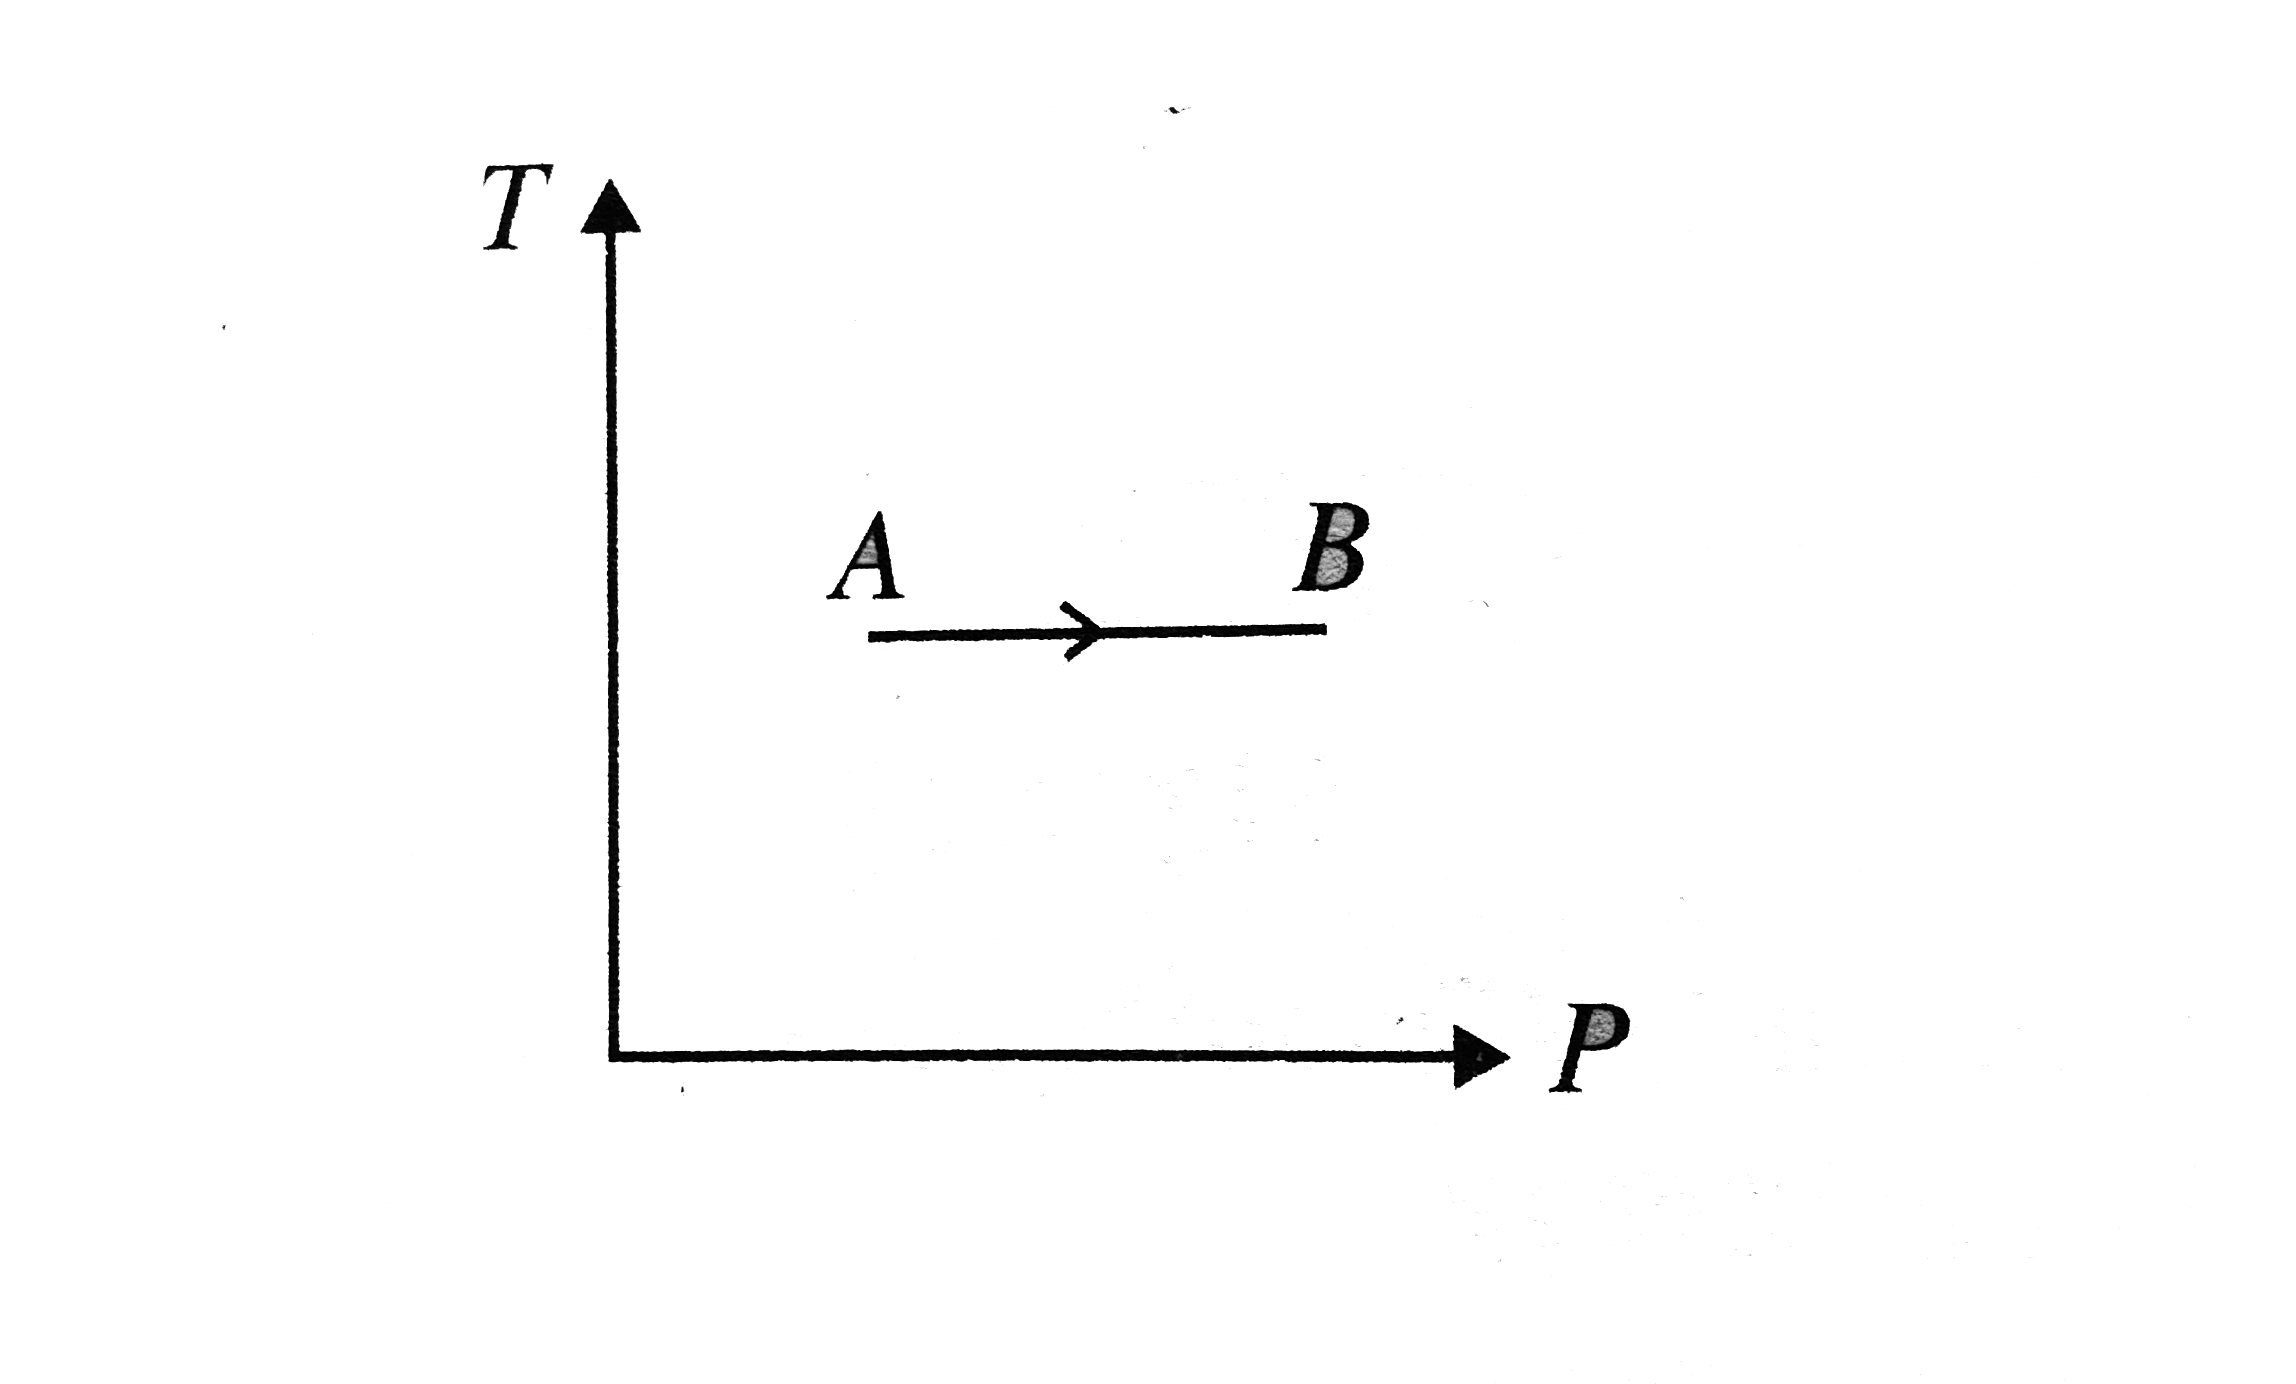
View SolutionTemperature versus pressure graph of an ideal gas is shown in Fig. During the process AB
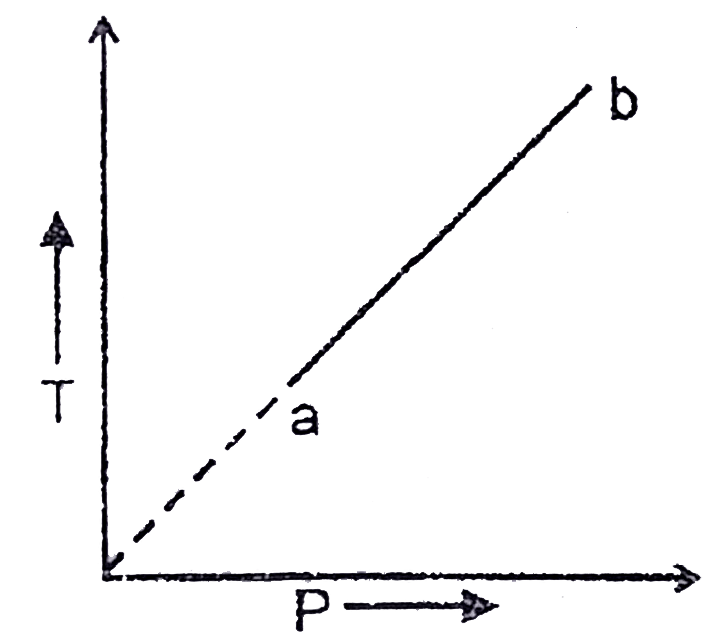
View SolutionAn ideal gas change from state a to state b as shown in Fig. what is the work done by the gas in the process?
View Solution
