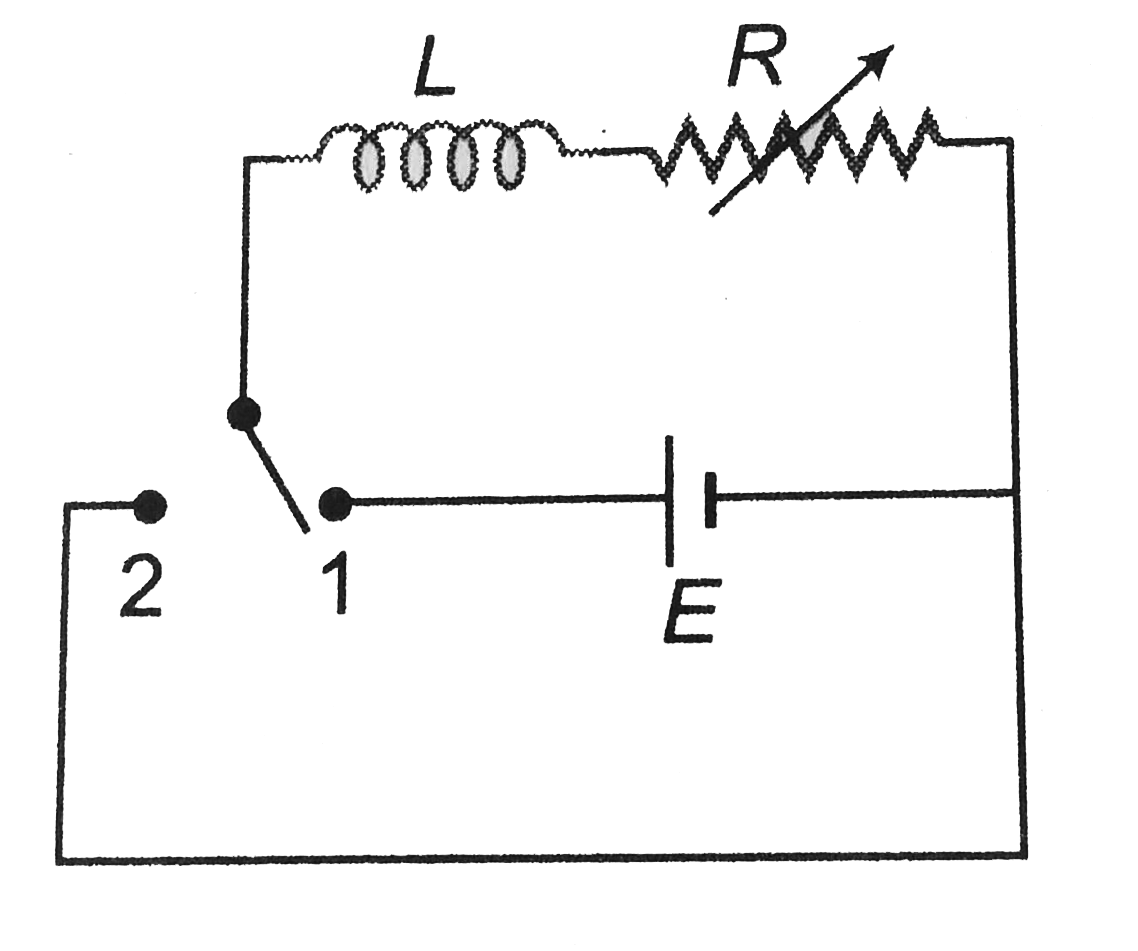
In the circuit shows in Fig. the initail current through the inductor at t=0 is I0. After a time t=L/R, the switch is quickly shifted to position 2.
a. Plot a graph showing the variation of current with time.
b. Calculate the value of current in the inductor at t=32LR.
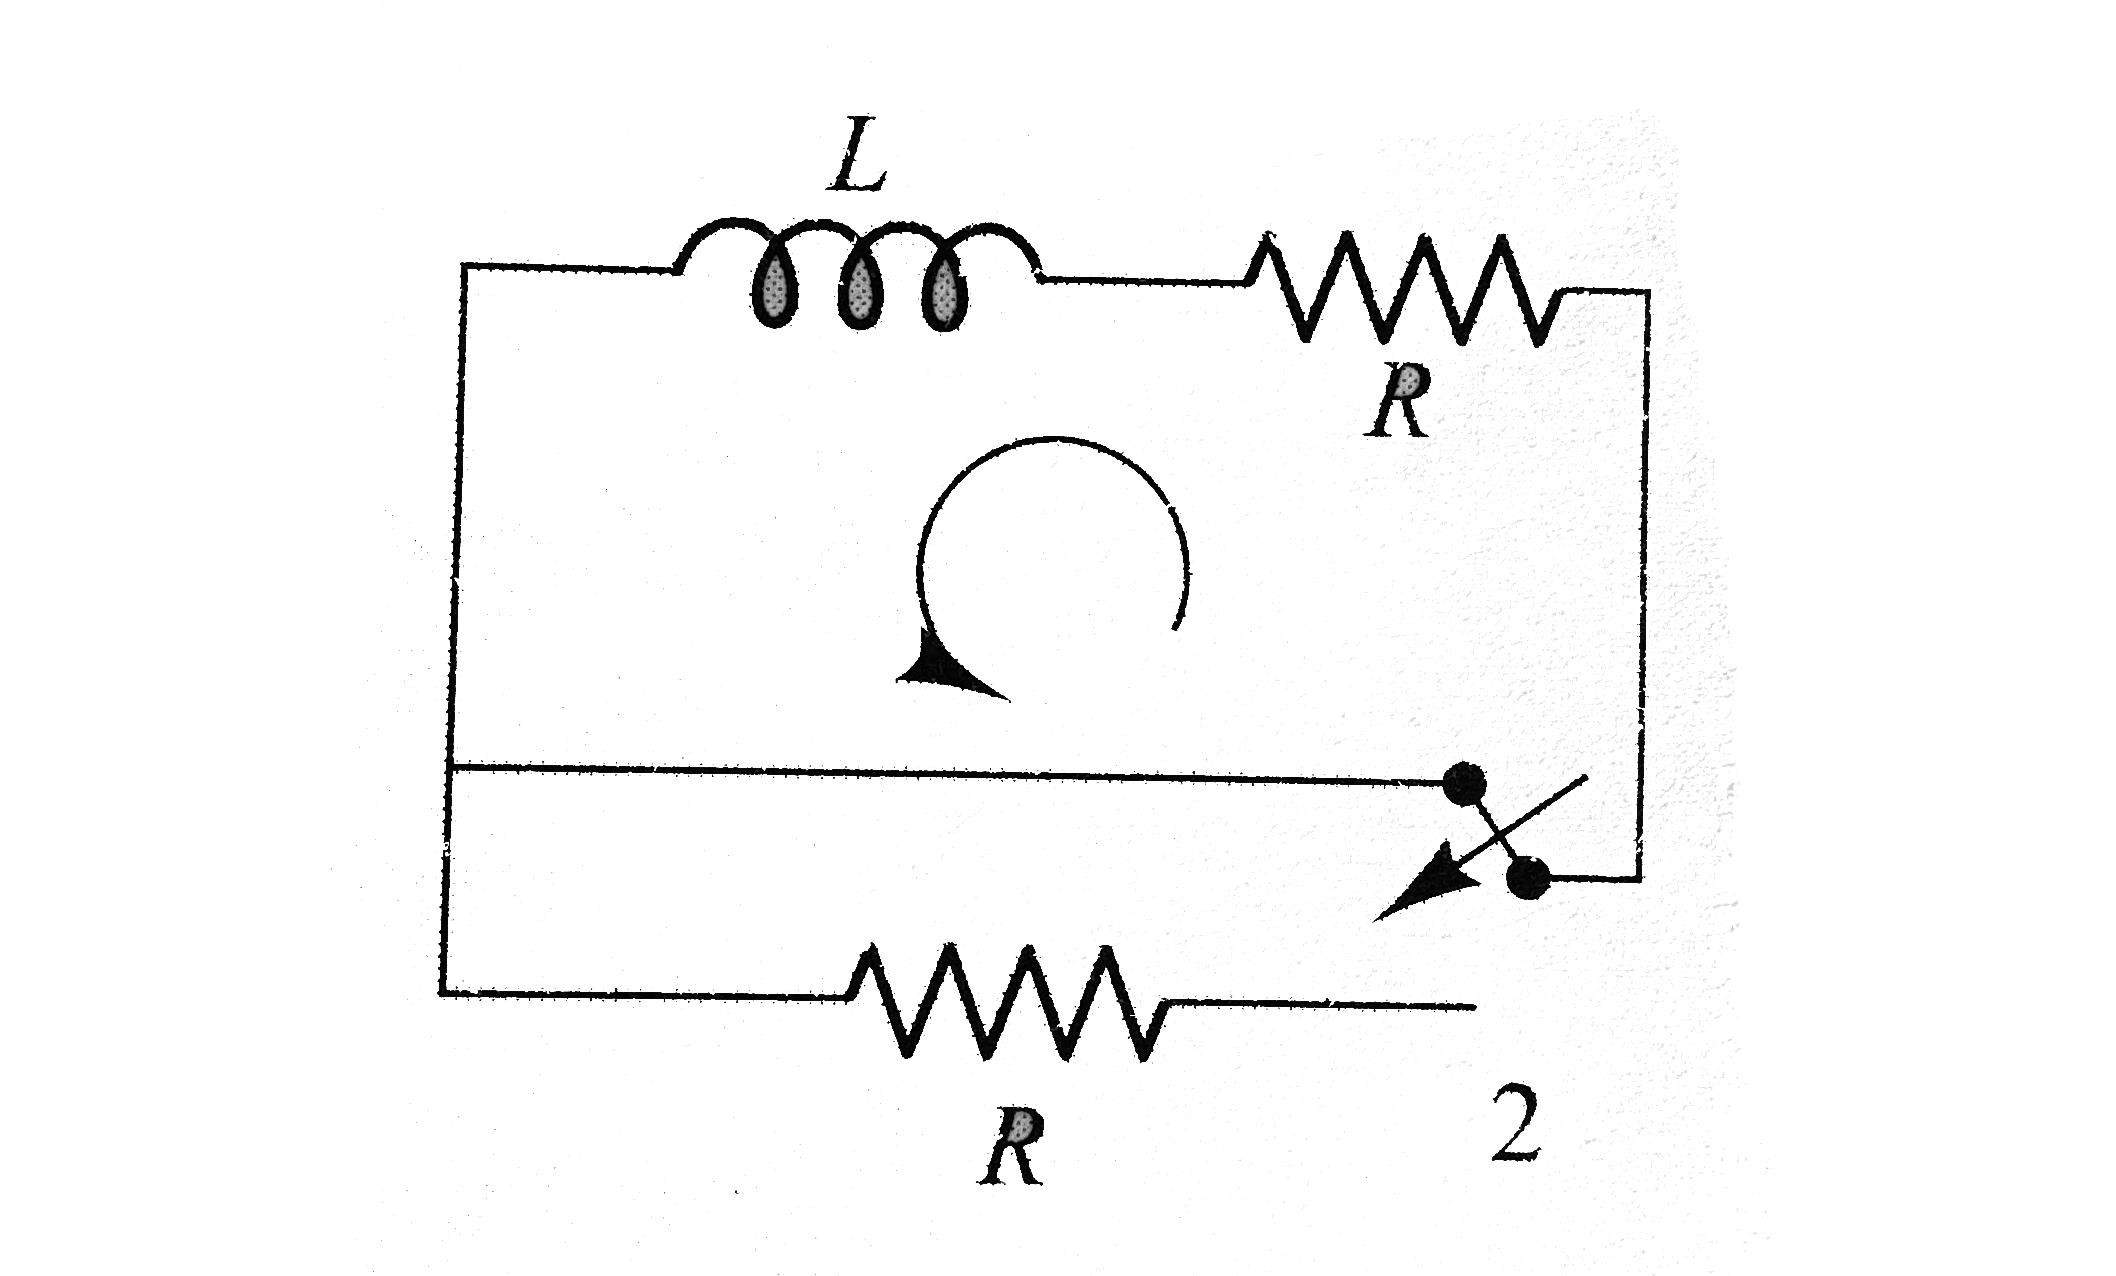
a. Shifting the position of switch increases the resistance of the circuit. This decreases the value of time constant.
Consequently, the rate of decreases of current increases.
The variation of current with tomes is shows in Fig
b.The equations of the curves are i=I0e−Rt/L (for 0≤t≤L/R)
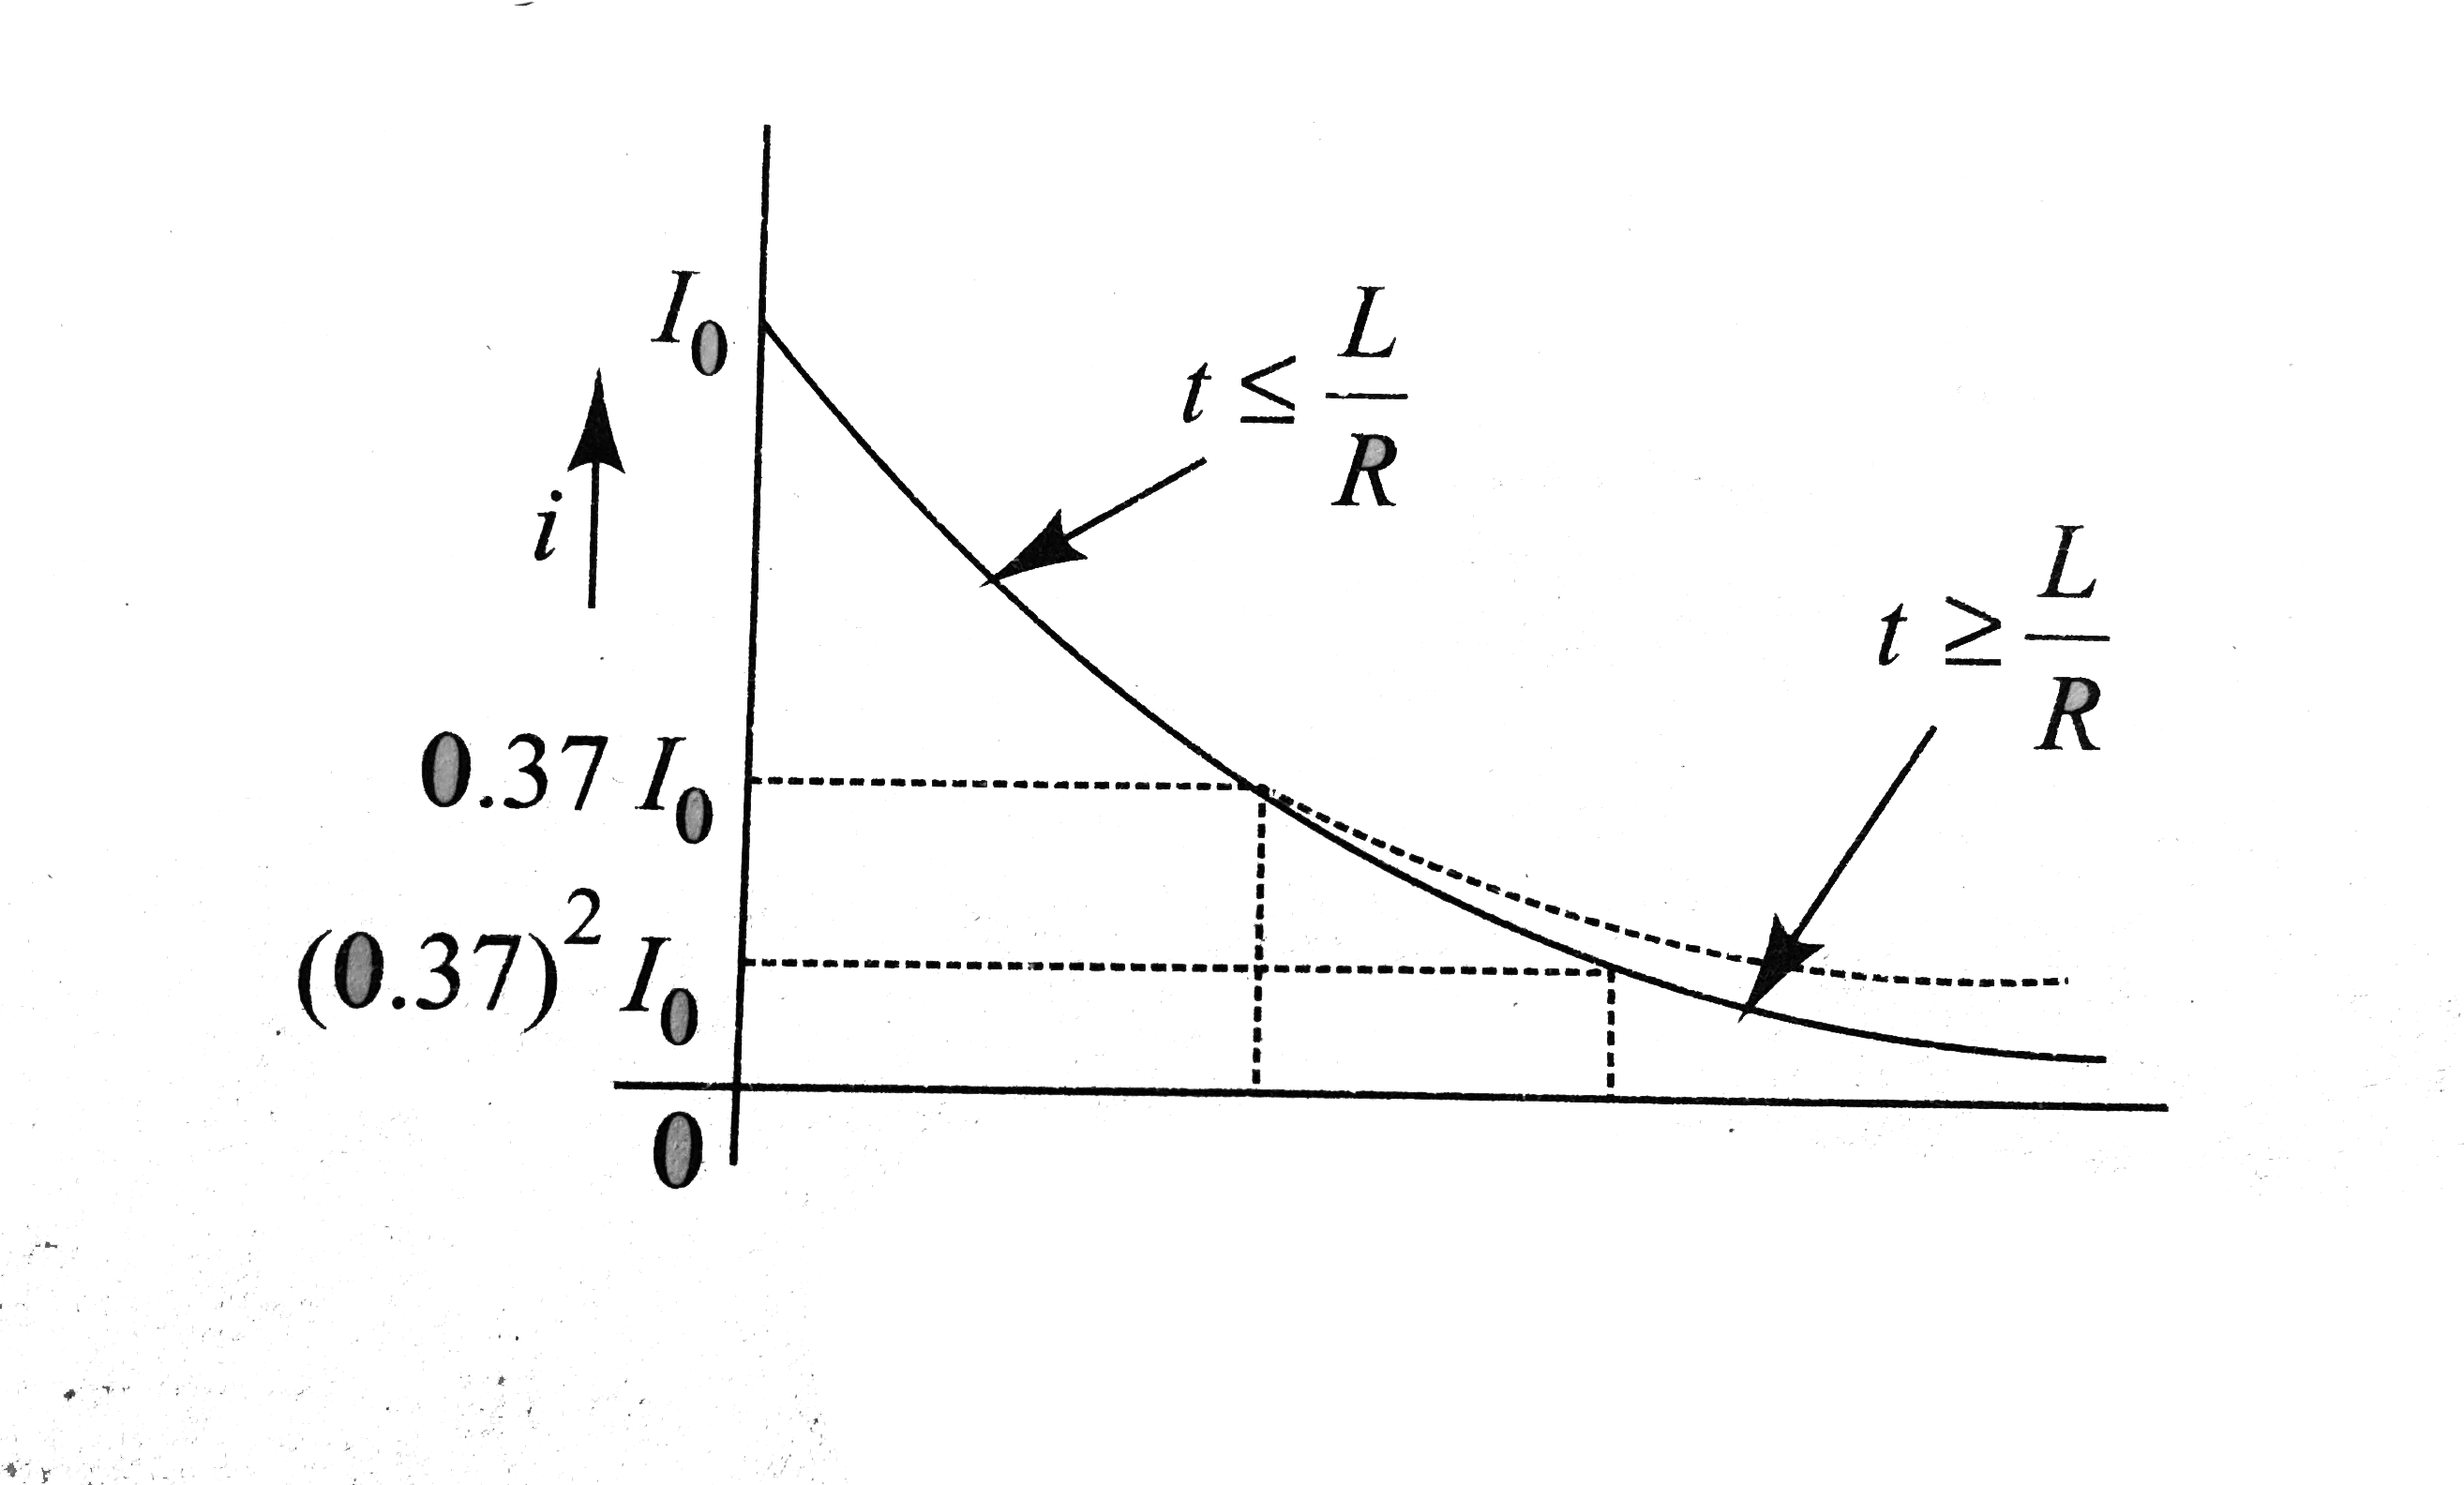
For RL≤t≤∞ and i=(0.37)I0e−2RL(t−LR)
At t=32LR, hence i=(0.37)I0e−2RL(3L2R−LR) or i=(0.37)2I0
Topper's Solved these Questions
- INDUCTANCEBOOK - CENGAGE PHYSICS ENGLISHCHAPTER - INDUCTANCEEXERCISE - Solved Examples
3 Videos
- INDUCTANCEBOOK - CENGAGE PHYSICS ENGLISHCHAPTER - INDUCTANCEEXERCISE - Exercise 4.1
24 Videos
- HEATING EFFECT OF CURRENTBOOK - CENGAGE PHYSICS ENGLISHCHAPTER - HEATING EFFECT OF CURRENTEXERCISE - Thermal Power in Resistance Connected in Circuit
27 Videos
- MAGNETIC FIELD AND MAGNETIC FORCESBOOK - CENGAGE PHYSICS ENGLISHCHAPTER - MAGNETIC FIELD AND MAGNETIC FORCESEXERCISE - Multiple Correct Answer type
2 Videos
Similar Questions
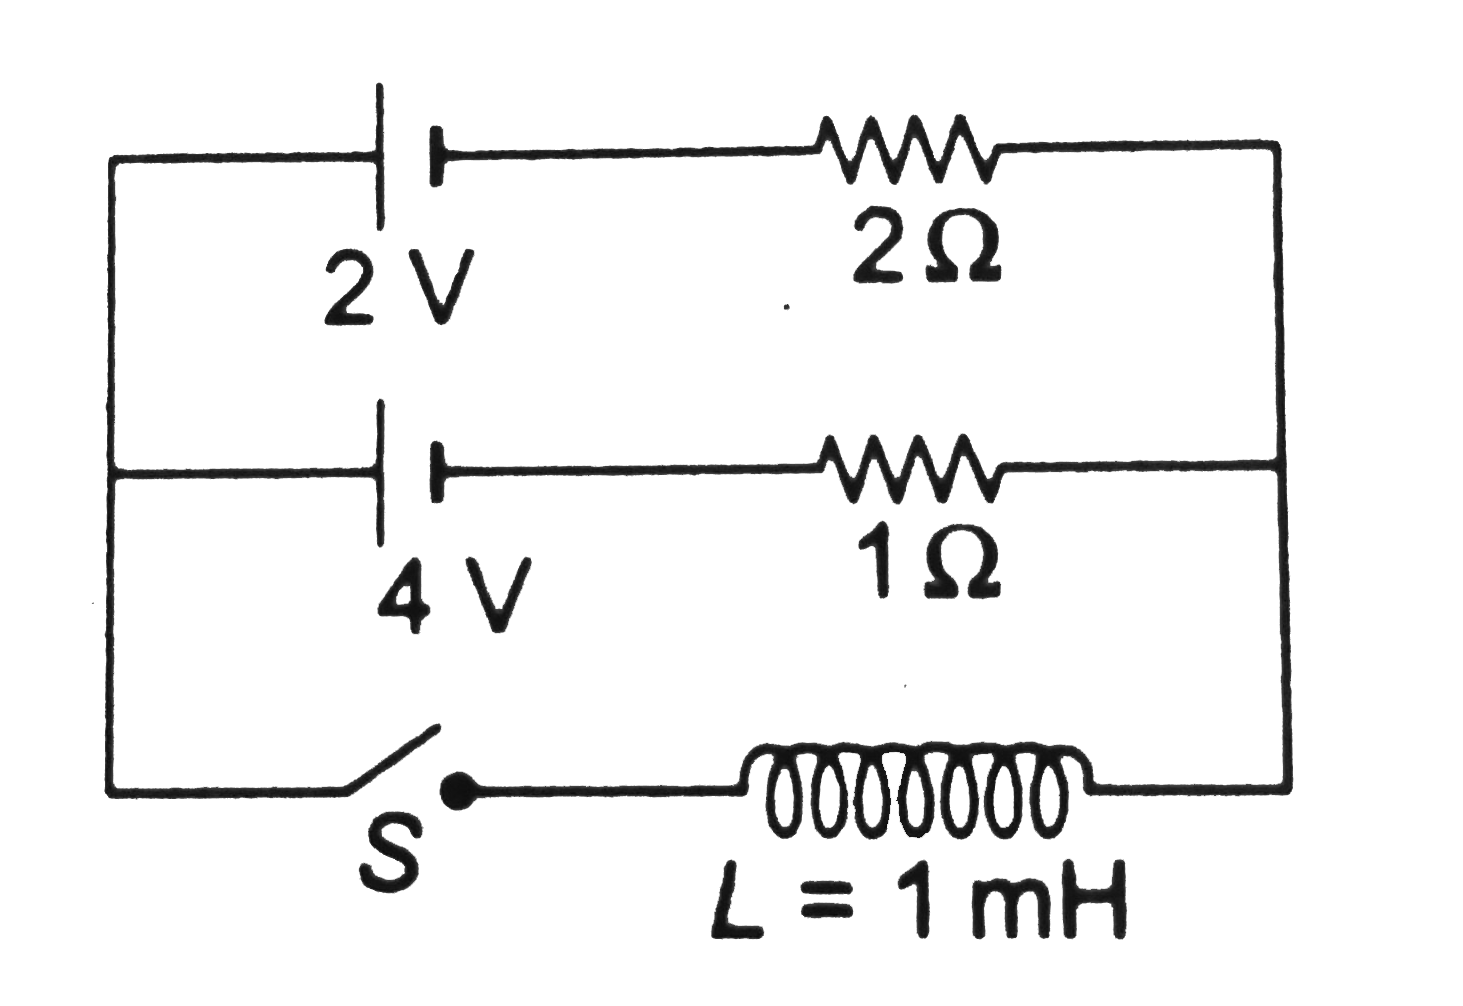
In the circuit shown, switch S is closed at time t=0. Find the current through the inductor as a function of time t.
View SolutionSwitch is closed at t=0 then the current in the circuit at t=L2R is
_PHY_E06_157_Q01.png)
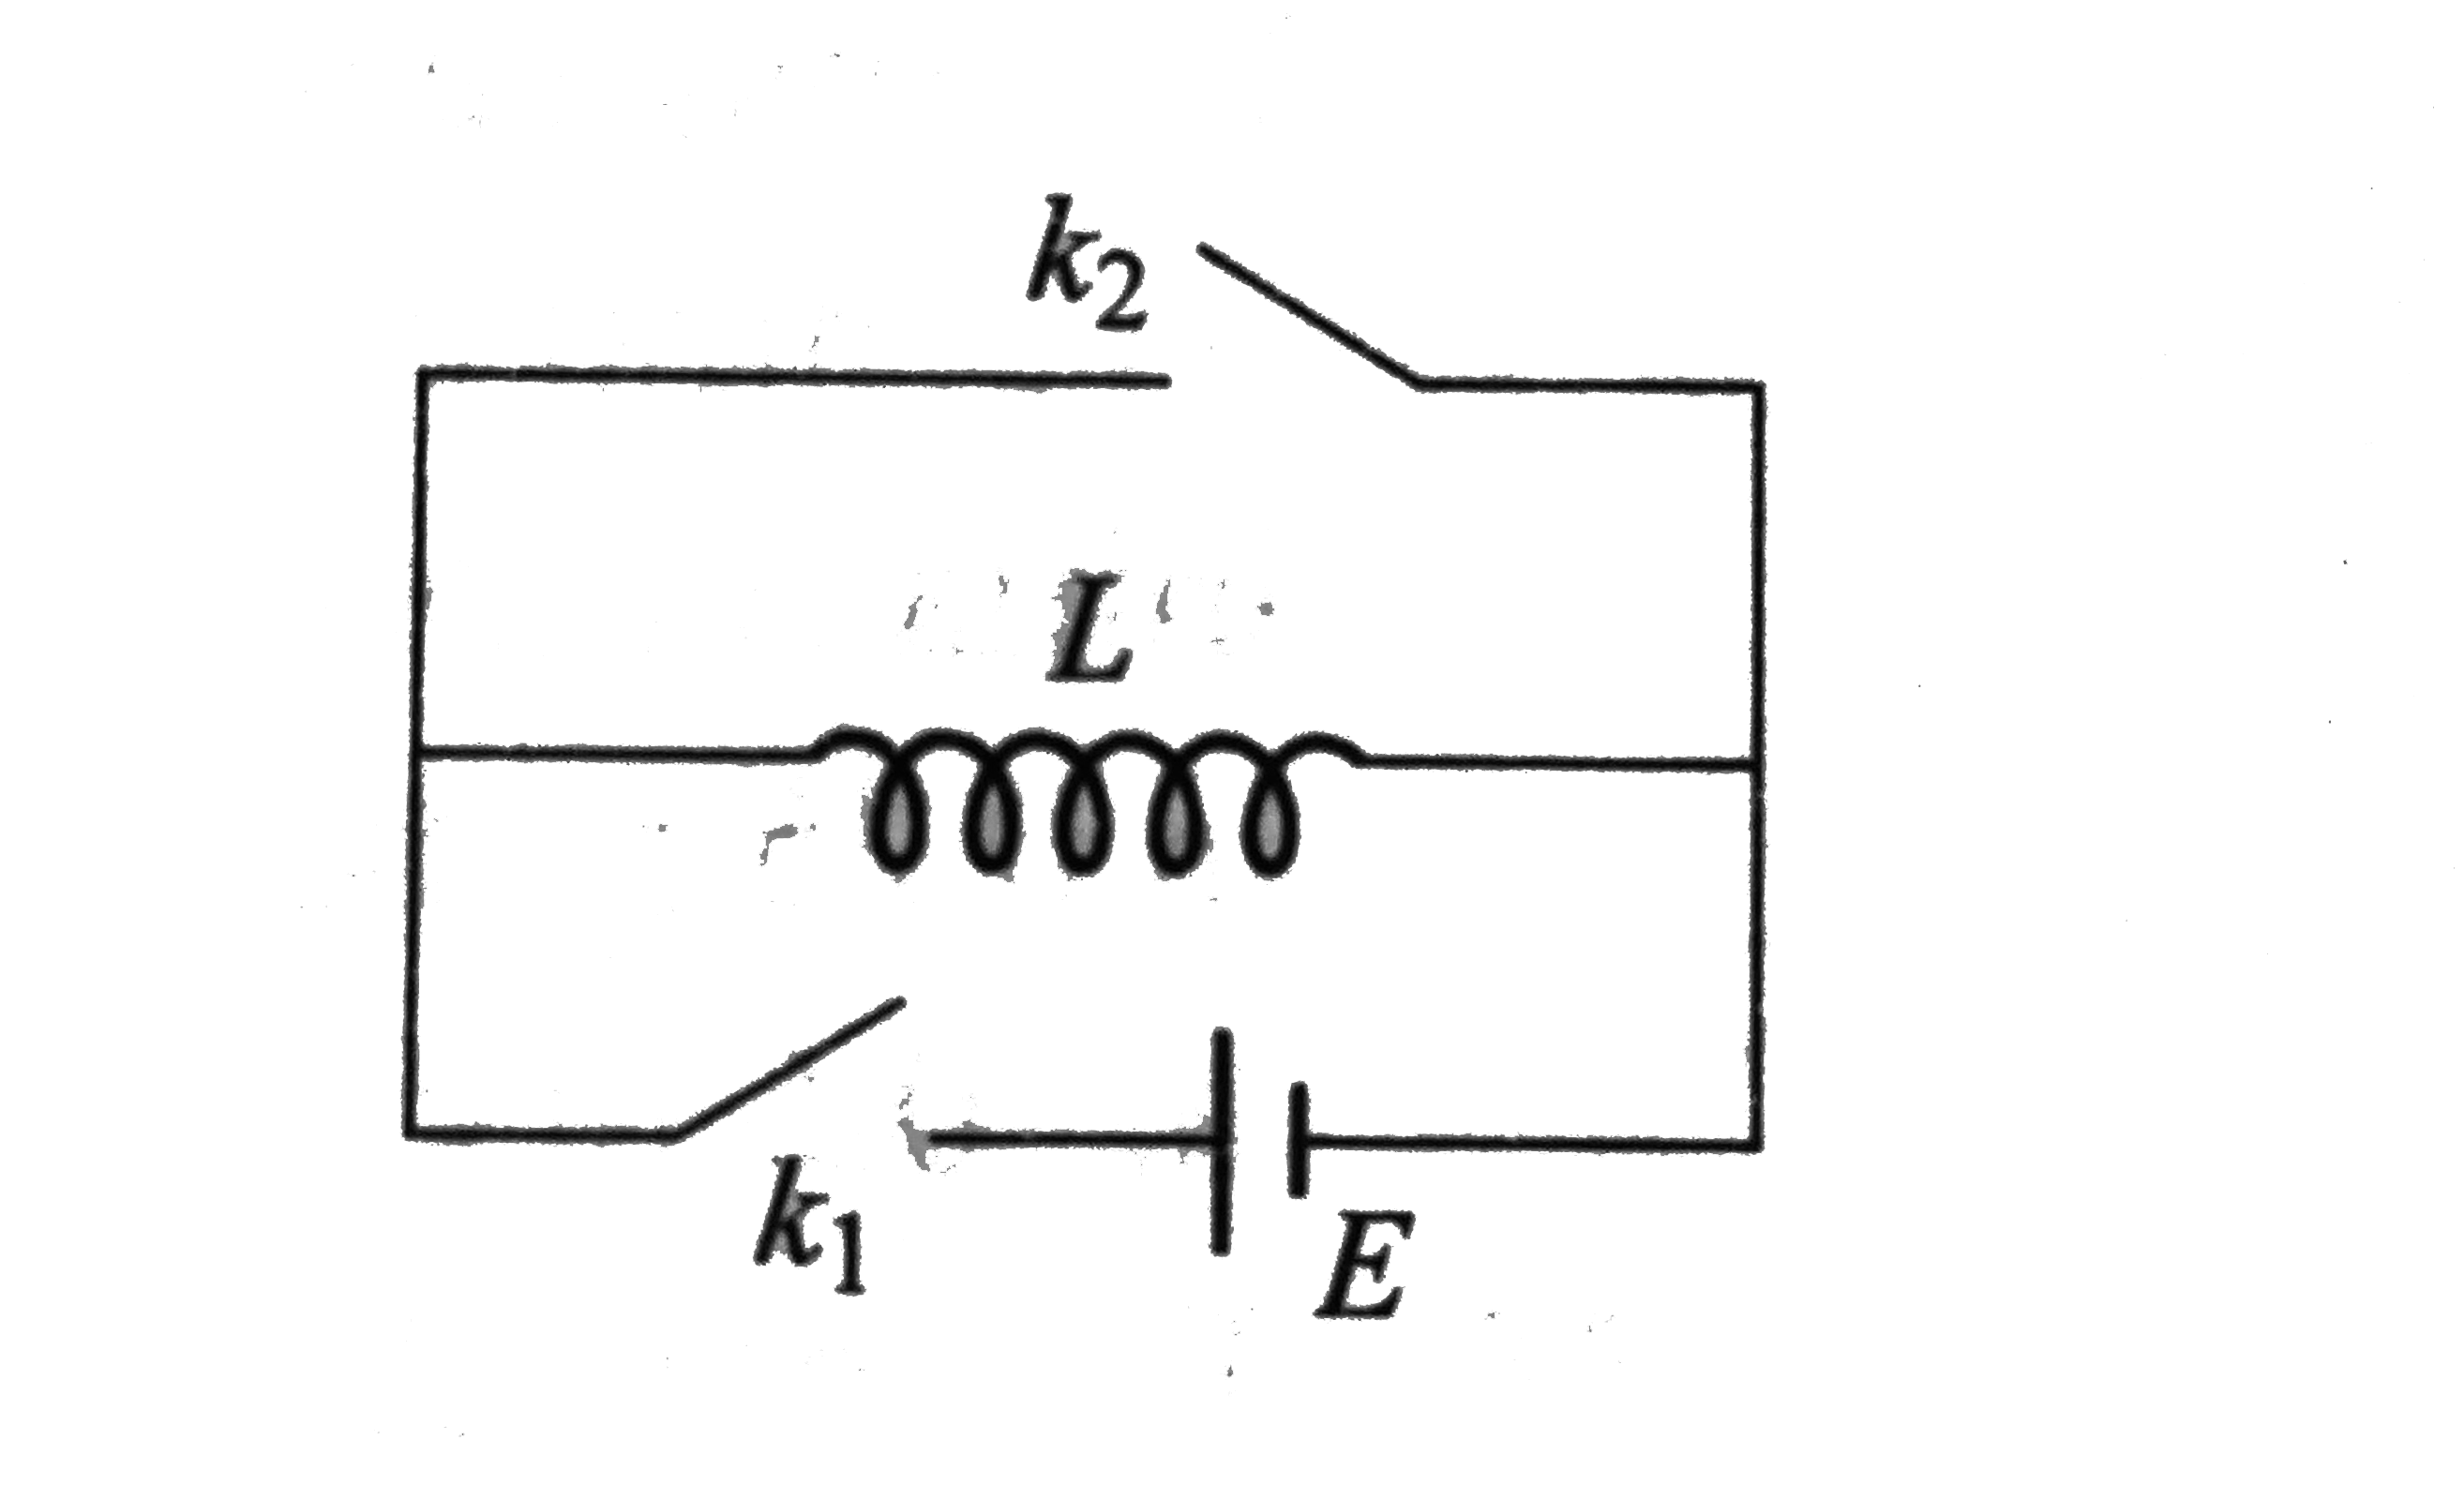
View SolutionIn the circuit shows in Fig. switch k2 is open and switch k1 is closed at t=0. At time t=t0, switch k1 is opened and switch k2 is simultaneosuly closed. The variation of inductor current with time is
View SolutionIn the circuit shown in figure switch S is thrown to position 1 at t=0. when the current in the resistort is 1A, it is shifted to position 2. the total heat generated in the circuit after shifting to position 2 is
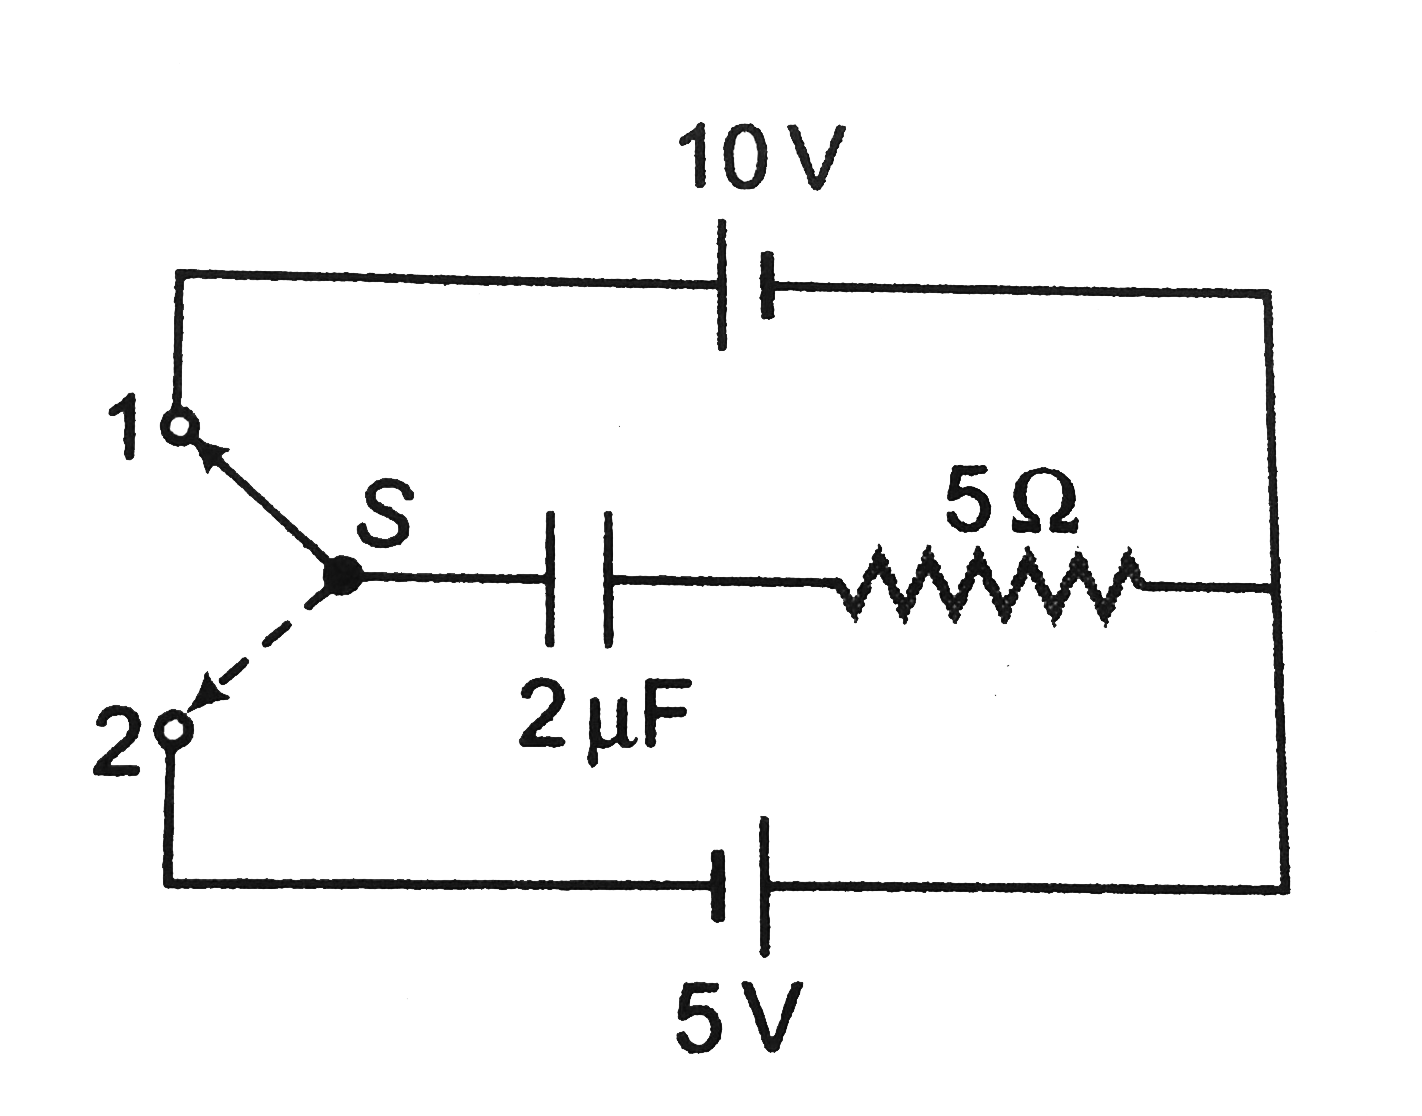
View SolutionIn the circuit shown in the figure initialy the switch in position 1 for a long time, then suddenly at t=0 the switch is shifted to position 2. It is required that a constant current should flow in the circuit, the value of resistance R in the circuit
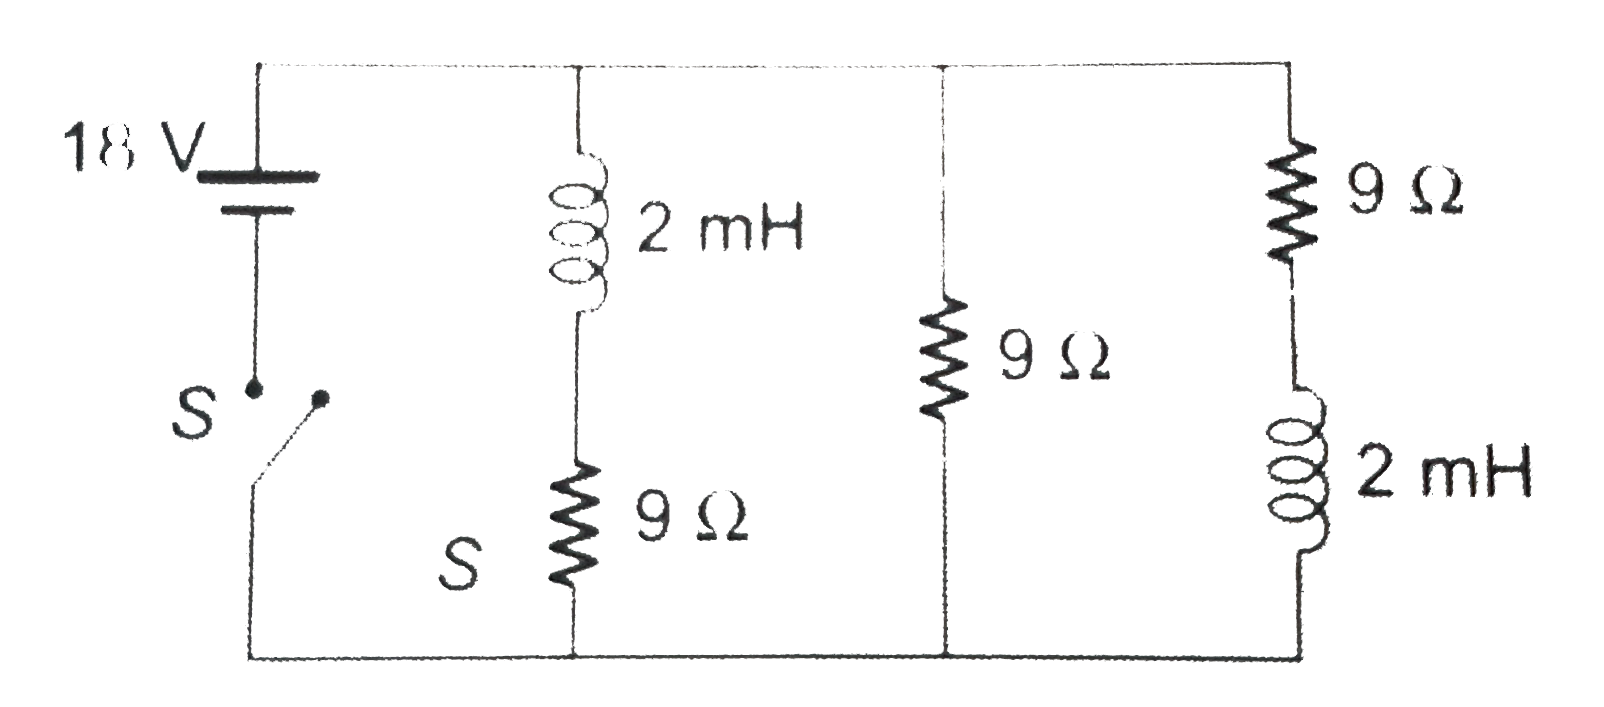
View SolutionCalculate the ratio of current flowing through the battery at t = 0 and t=∞ (t = 0 is the time of closing of the switch)
View SolutionIn the circuit shown in figure switch S is closed at time t=0
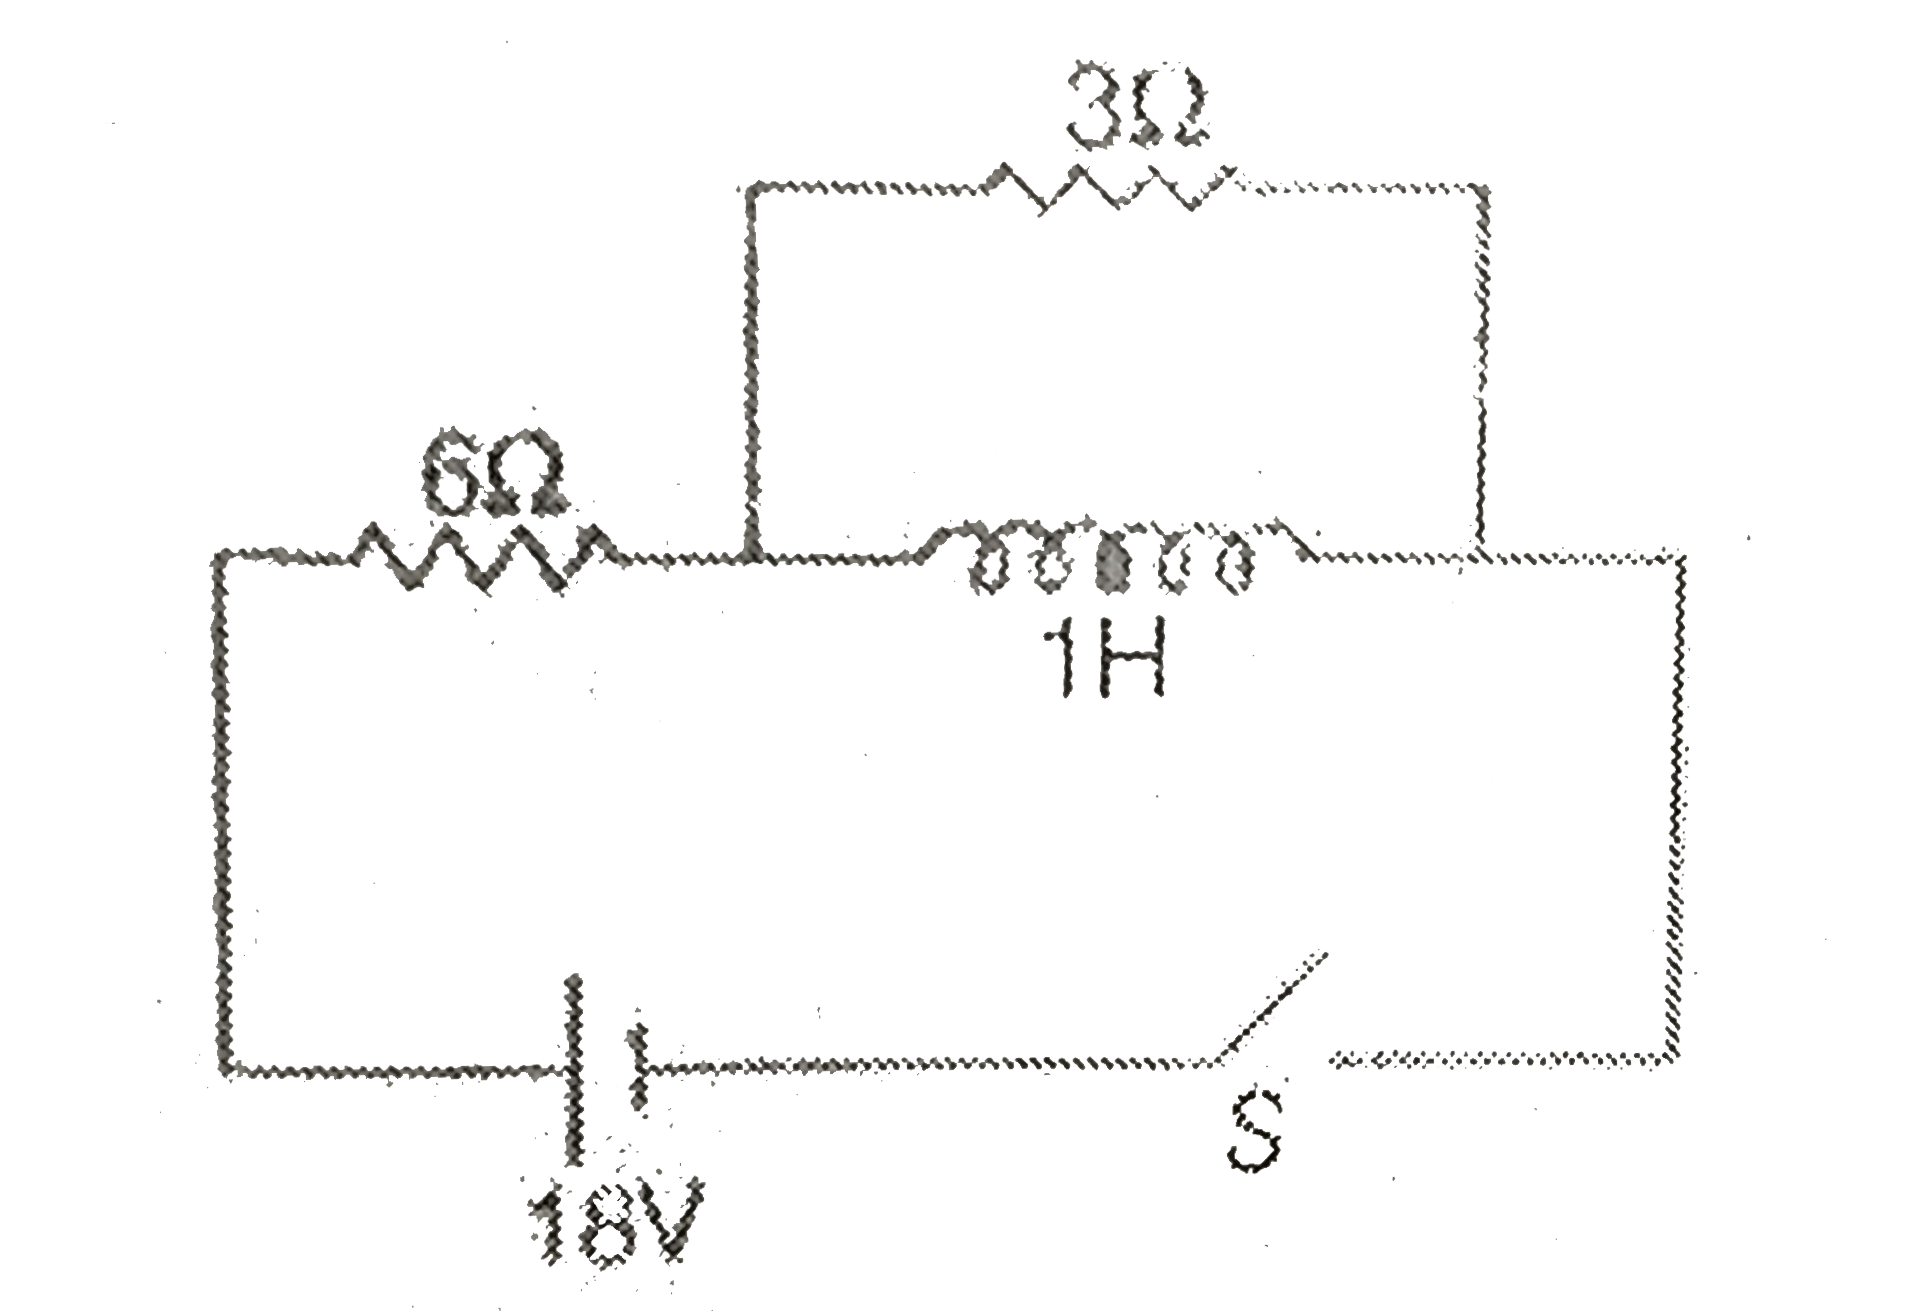
Current I from the battery at time t is given by
View SolutionIn the circuit shown if Fig. the switch S is closed at time t = 0. The current through the capacitor and inductor will be equal at time t equal (given R=√L/C
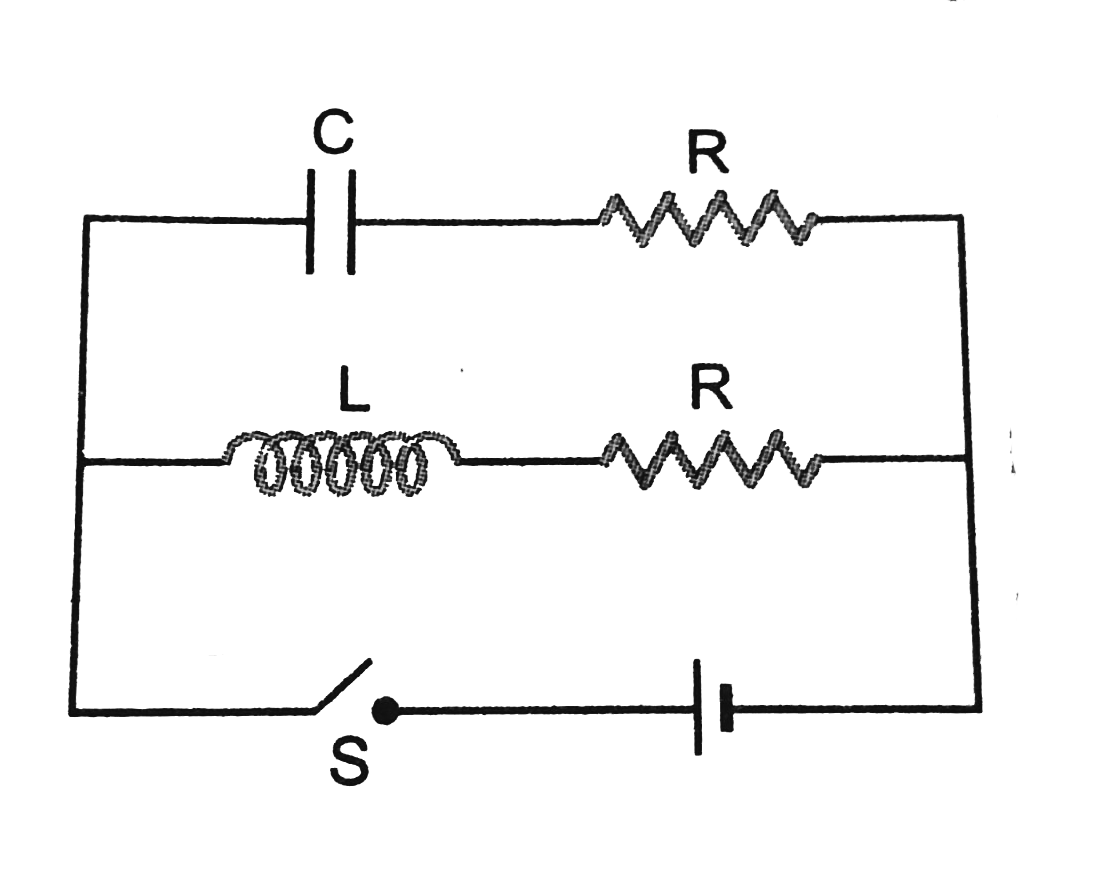
View SolutionSwitch S is cloesd in the circuit at time t=0. Find the current through the capacitor and the inductor at any time t
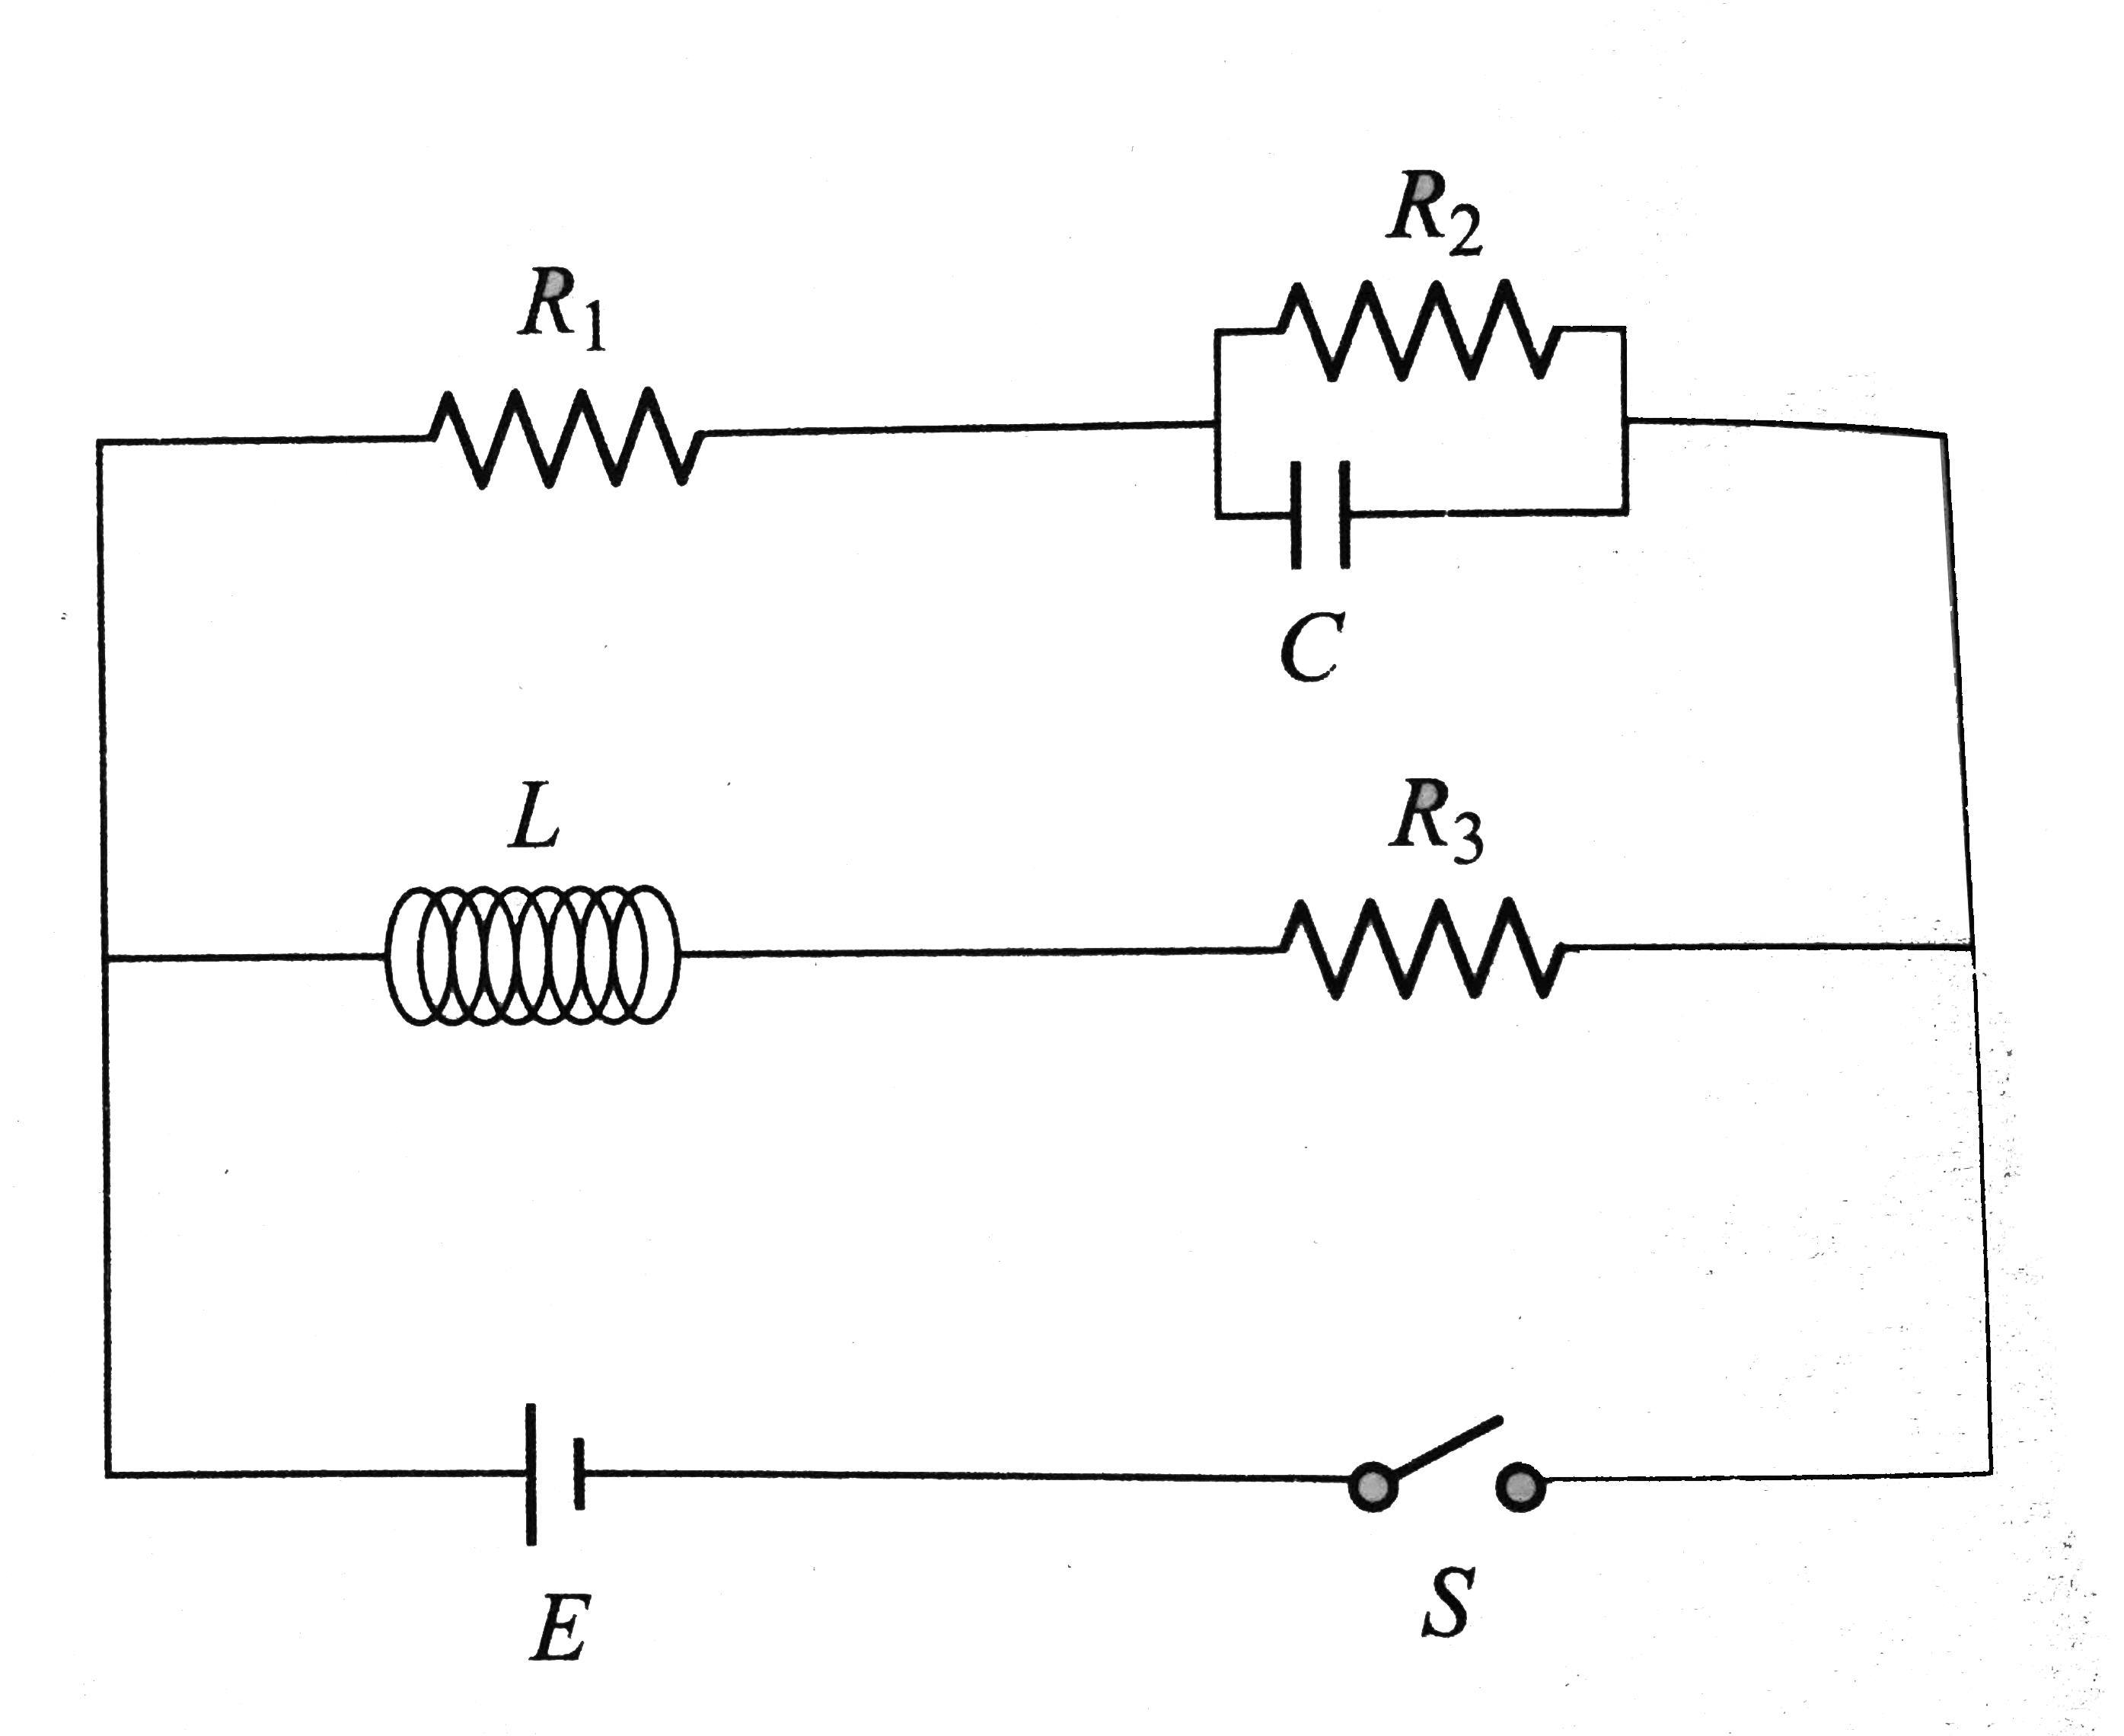
View SolutionConsider the circuit shown in figure.(a) find the current through the battery a long time after the switch S is closed. (b) Suppose the switch is again opened at t = 0. What is the time constant of the discharging circuit? (c ) Find t current through the inductor after one time constant.
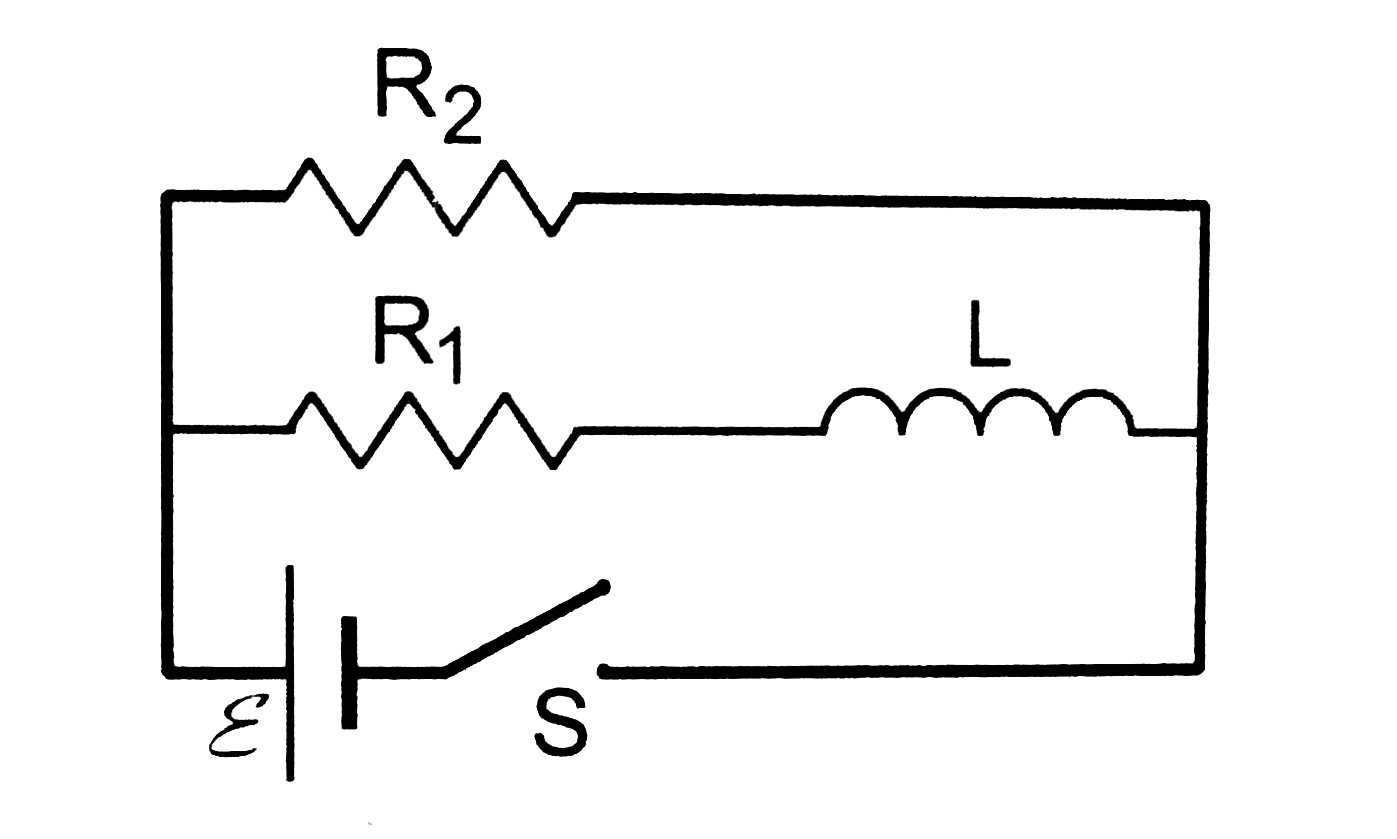
View Solution
