A particle starts with some initial velocity with an acceleration along the direction of motion. Draw a graph depicting the variation of velocity (v) along y-axis with the variation of displacement(s) along x-axis.
To solve the problem of depicting the variation of velocity (v) along the y-axis with the variation of displacement (s) along the x-axis, we can follow these steps:
1. Identify the Initial Conditions:
- Let the initial velocity of the particle be u.
- The particle has a constant acceleration A in the direction of motion.
2. Use the Third Equation of Motion:
- The third equation of motion relates velocity, initial velocity, acceleration, and displacement:
v2=u2+2As
- Here, v is the final velocity, u is the initial velocity, A is the acceleration, and s is the displacement.
3. Rearranging the Equation:
- Rearranging the equation gives:
v2=2As+u2
- This can be expressed in the form of y and x:
v2=2As+u2⟹v2=2As+u2
4. Graphing the Equation:
- In this equation, v2 (y-axis) is a function of s (x-axis). The term 2A acts as a slope, and u2 is the y-intercept.
- The graph will be a parabola opening upwards since the coefficient of s (which is 2A) is positive.
5. Plotting the Graph:
- When s=0, v2=u2, so the point (0, u2) will be on the graph.
- As s increases, v2 will also increase, indicating that the velocity increases with displacement.
6. Final Graph:
- The graph will start at the point (0, u2) and curve upwards to the right, depicting the relationship between velocity and displacement.
- Let the initial velocity of the particle be u.
- The particle has a constant acceleration A in the direction of motion.
- The third equation of motion relates velocity, initial velocity, acceleration, and displacement:
v2=u2+2As
- Here, v is the final velocity, u is the initial velocity, A is the acceleration, and s is the displacement.
- Rearranging the equation gives:
v2=2As+u2
- This can be expressed in the form of y and x:
v2=2As+u2⟹v2=2As+u2
- In this equation, v2 (y-axis) is a function of s (x-axis). The term 2A acts as a slope, and u2 is the y-intercept.
- The graph will be a parabola opening upwards since the coefficient of s (which is 2A) is positive.
- When s=0, v2=u2, so the point (0, u2) will be on the graph.
- As s increases, v2 will also increase, indicating that the velocity increases with displacement.
- The graph will start at the point (0, u2) and curve upwards to the right, depicting the relationship between velocity and displacement.
Topper's Solved these Questions
- BASIC MATHEMATICSBook:CENGAGE PHYSICS ENGLISHChapter:BASIC MATHEMATICSExercise:Solved Examples
Explore 9 Videos
- BASIC MATHEMATICSBook:CENGAGE PHYSICS ENGLISHChapter:BASIC MATHEMATICSExercise:Exercise 2.1
Explore 2 Videos
- ARCHIVES 2 VOLUME 6Book:CENGAGE PHYSICS ENGLISHChapter:ARCHIVES 2 VOLUME 6Exercise:Integer
Explore 4 Videos
- CALORIMETRYBook:CENGAGE PHYSICS ENGLISHChapter:CALORIMETRYExercise:Solved Example
Explore 13 Videos
Similar Questions
If v is the velocity of a body moving along x-axis, then acceleration of body is
View SolutionFor a body moving with uniform acceleration along straight line, the variation of its velocity (v) with position (x) is best represented by
View SolutionA particle starts with uniform acceleration. Draw a graph taking the displacement(s) of the particle along y-axis and time(t) along x-axis. What is the curve known as?
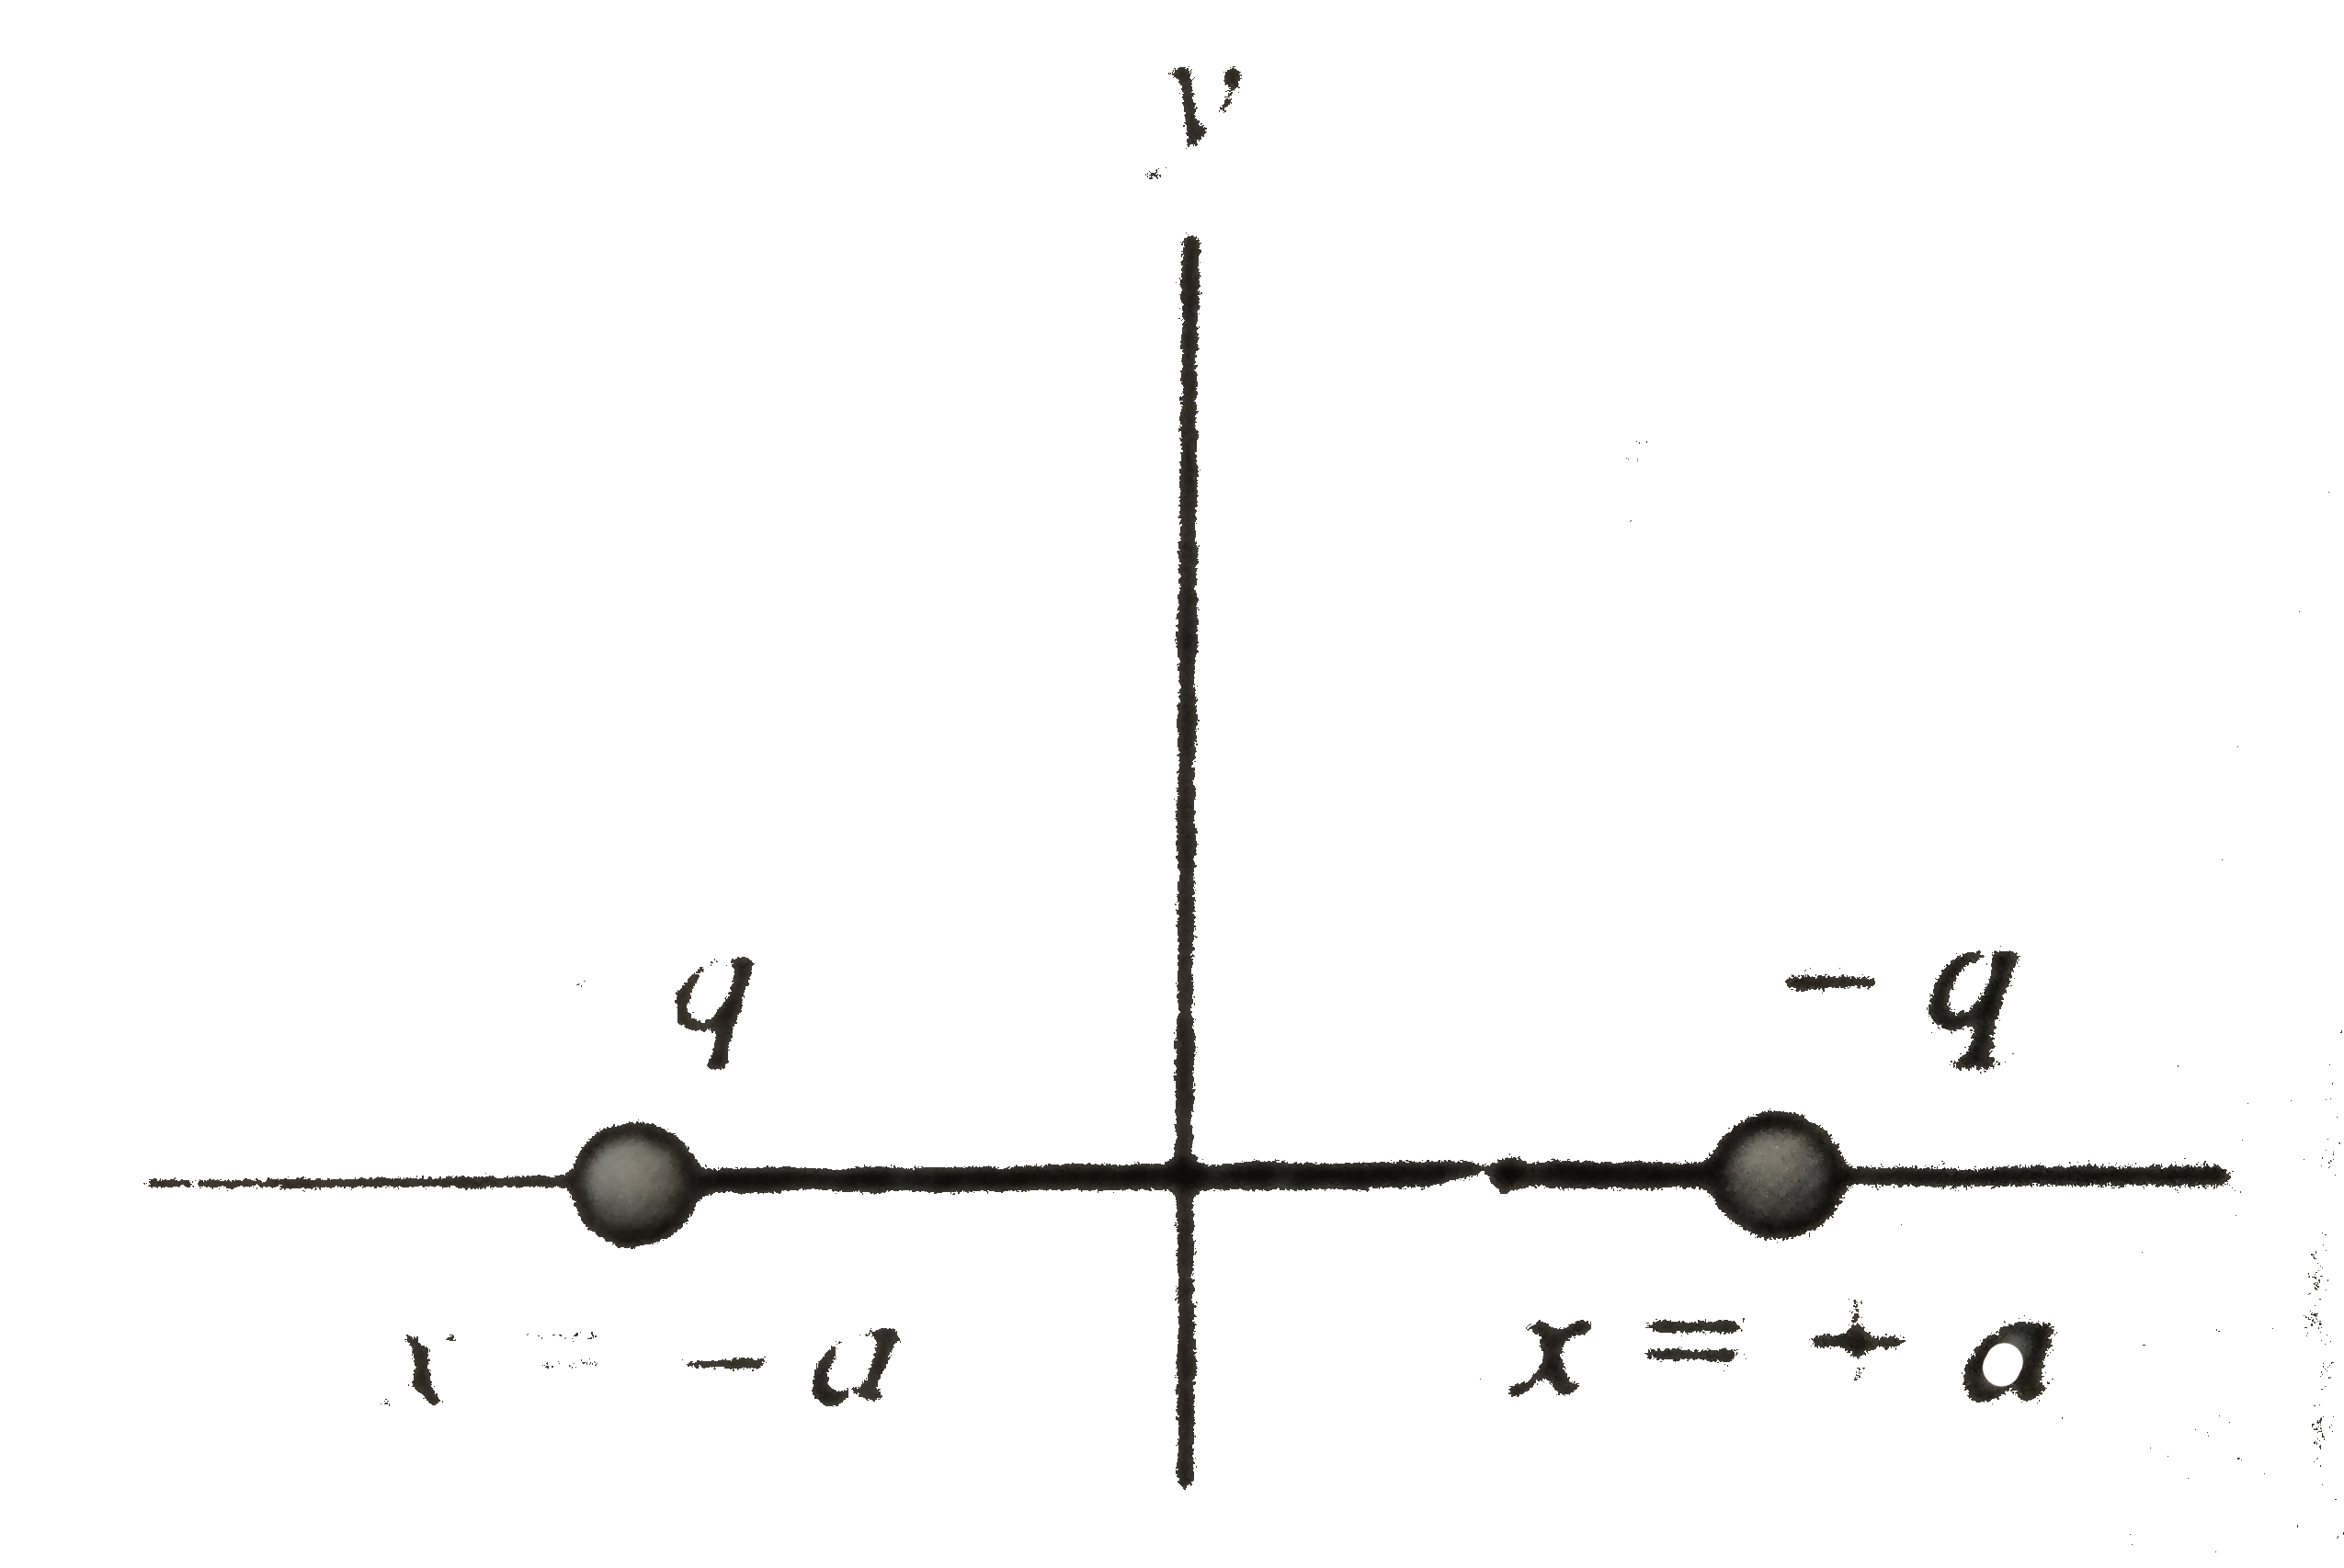
View SolutionTwo point charge ±q are placed on the axis at x=−a and x=+a, as shown in fig.
(i) Plot the variation of E along the x-axis.
(ii) Plot the variation of E along the y-axis.

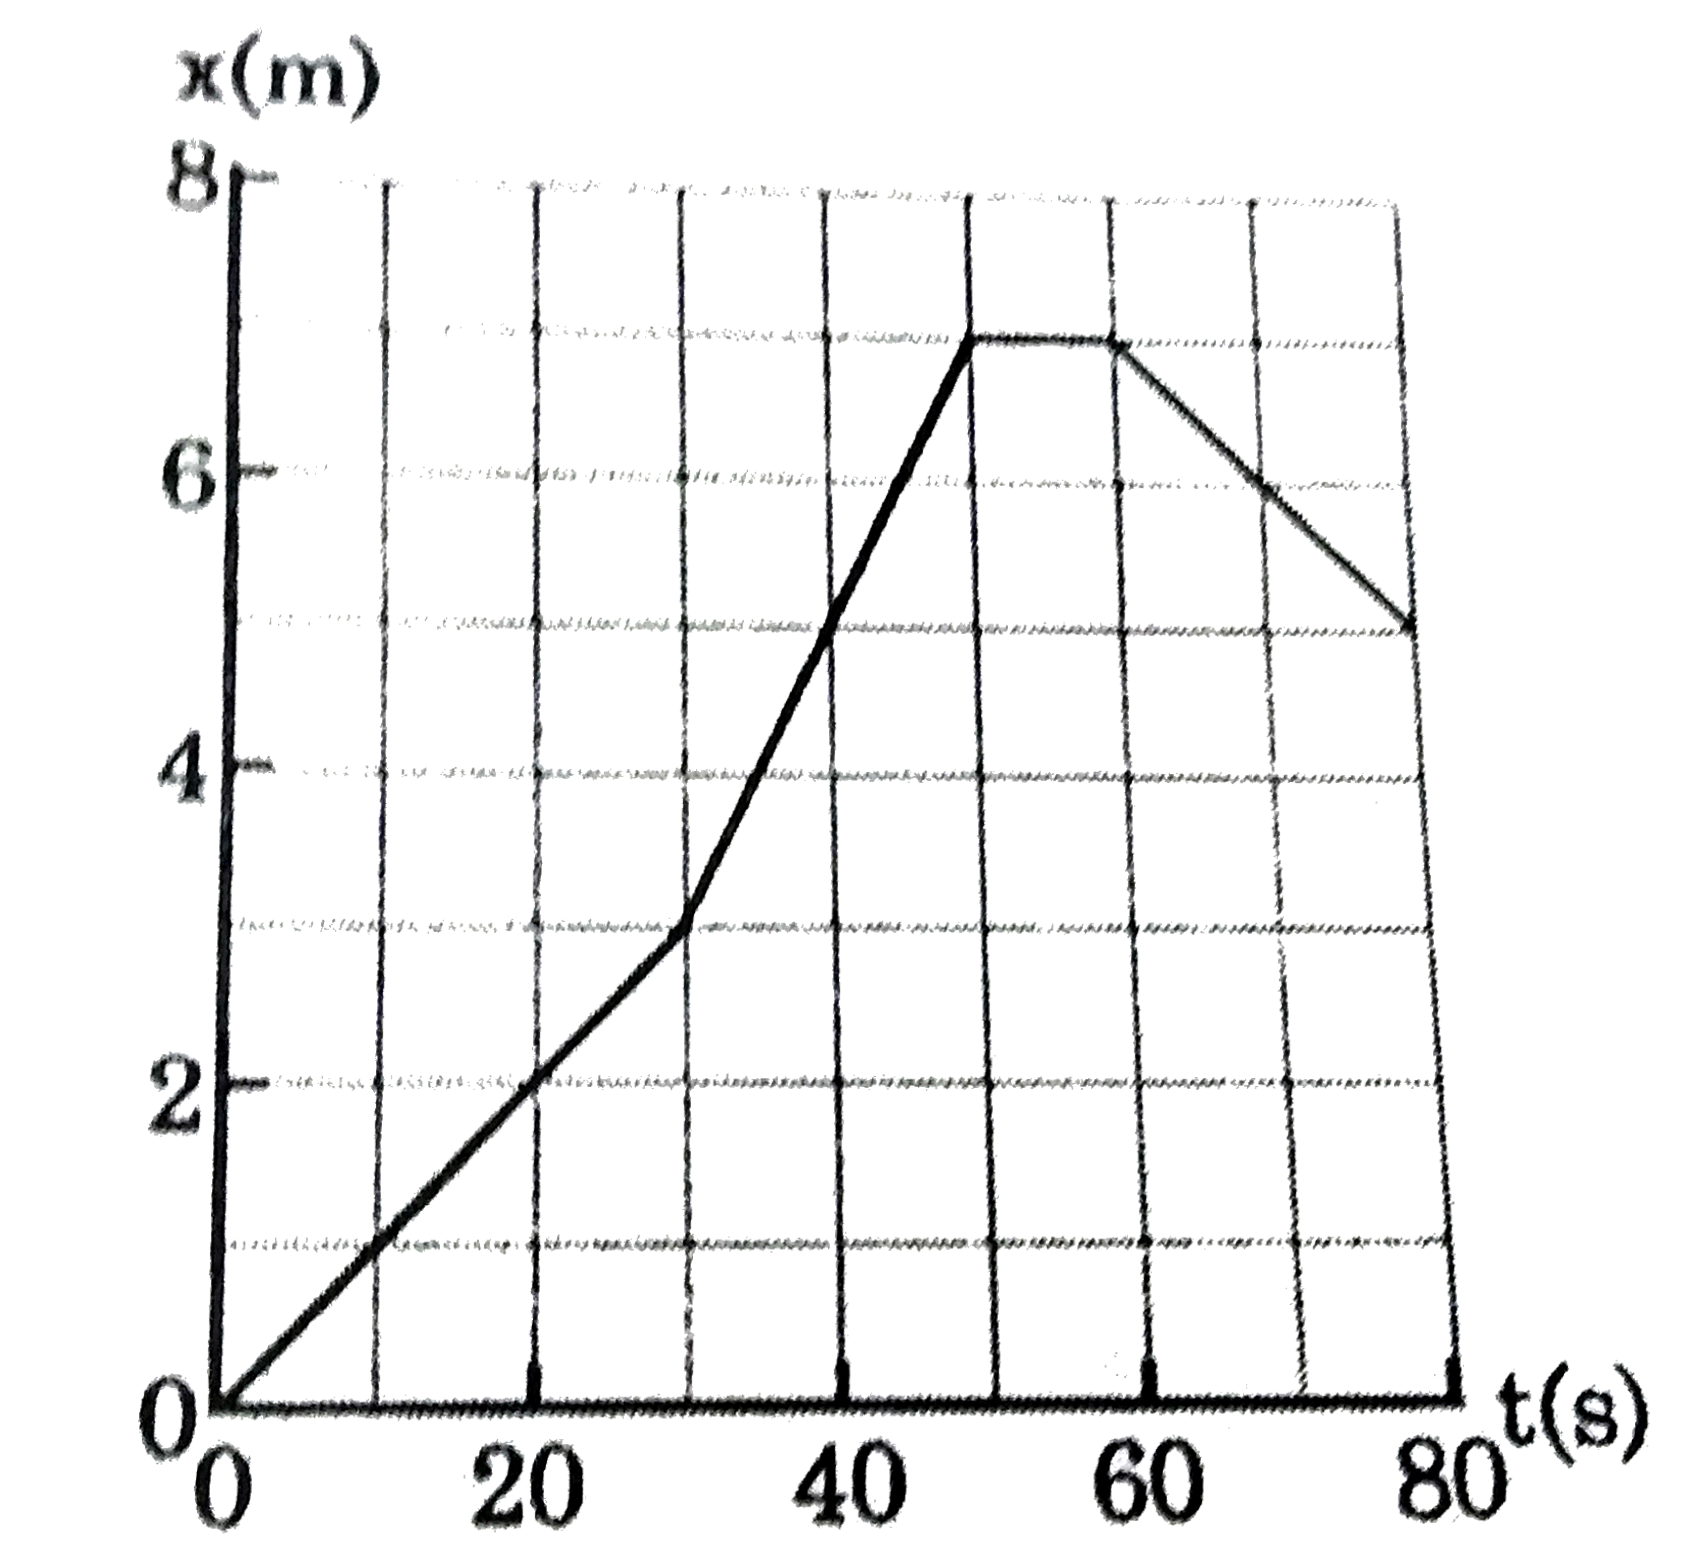
View SolutionGraph represents motion of an object along X-axis for 80 s :-

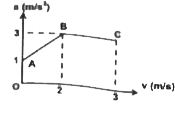
View SolutionA particle starts its motion from the origin in positive x-direction. The given graph shows the variation of acceleration (a) with velocity (v). Plot the corresponding graph between velocity and time.

View SolutionA particle starting from rest moves along a straight line with constant acceleration for this velocity displacement graph will have the form-
View SolutionThe variation of velocity of a particle moving along a straight line is shown in . is
 .
.
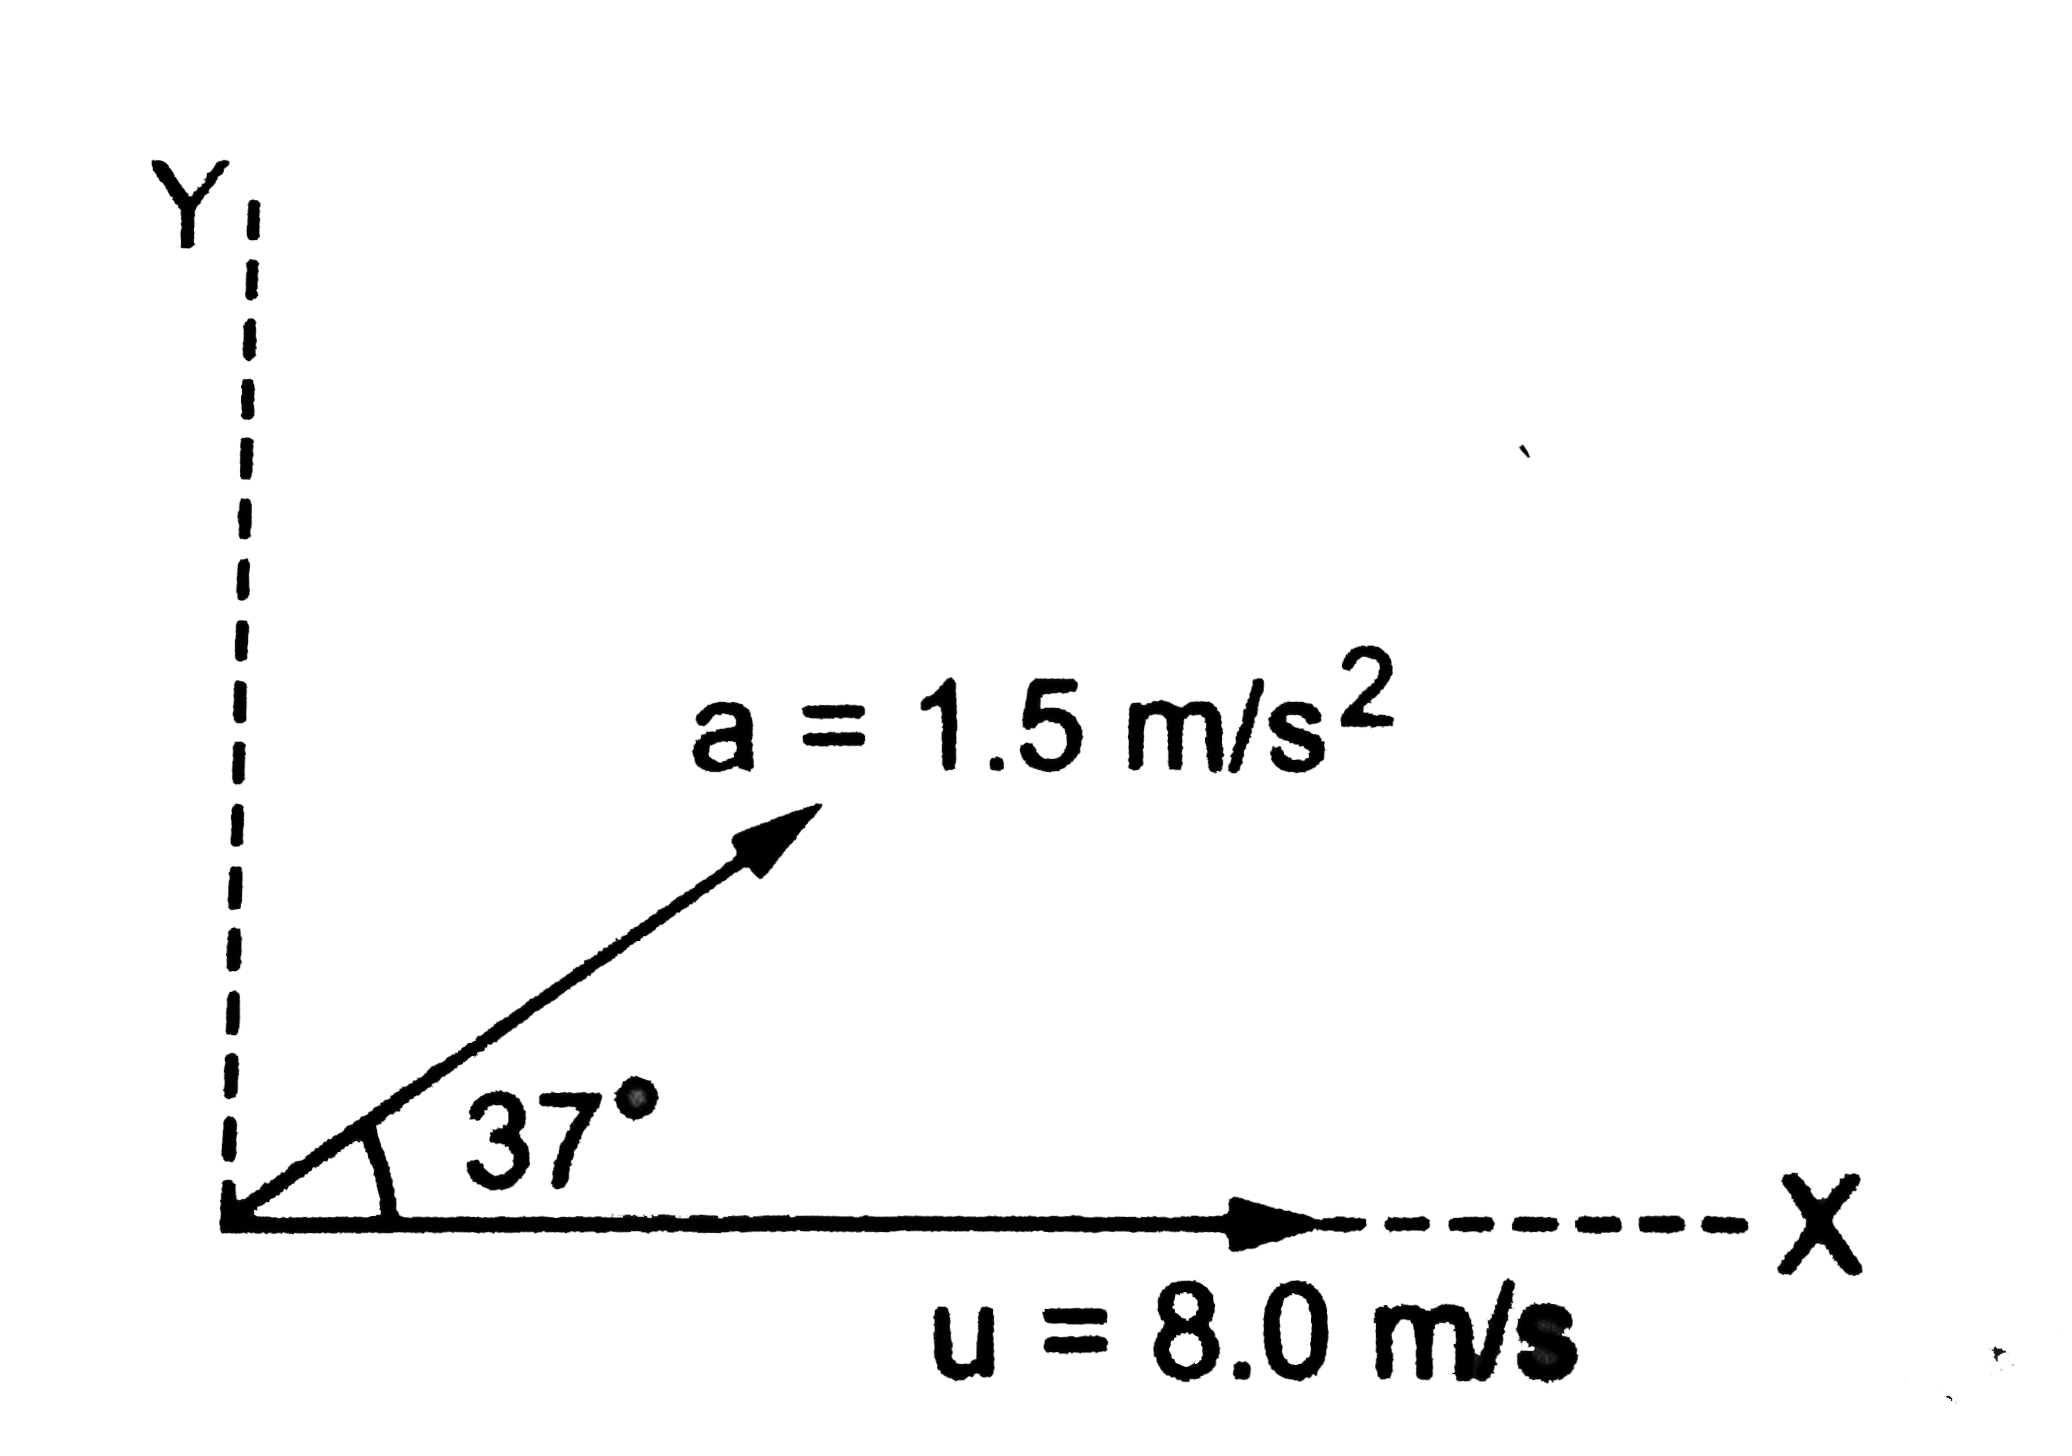
View SolutionA particle movesin the X-Y plane with a constasnt acceleration of 1.5ms2 in the direction making an angle of 370 with the X-axis.At t=0 the particle is at the orign and its velocity is 8.0 m/s along the X-axis. Find the velocity and the position of the particle at t=4.0 s.

View SolutionA particle moves along a straight line path. After some time it comes to rest. The motion is with constant acceleration whose direction with respect to the direction of velocity is :
View Solution

