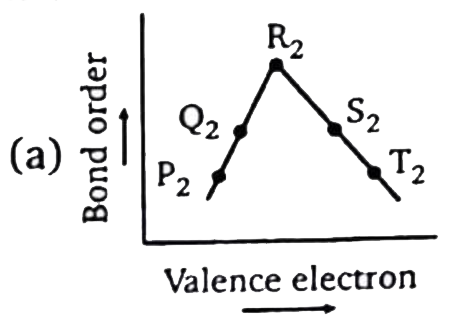
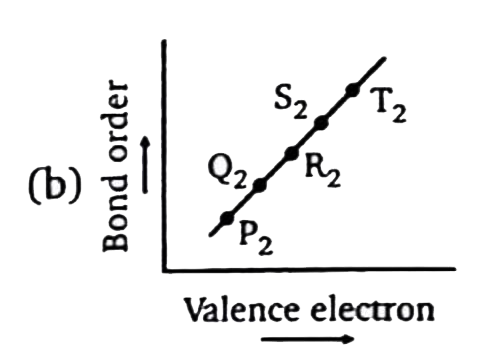
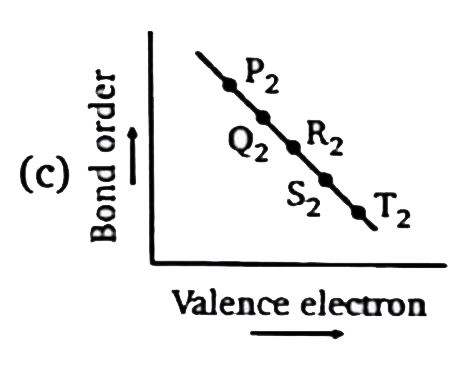
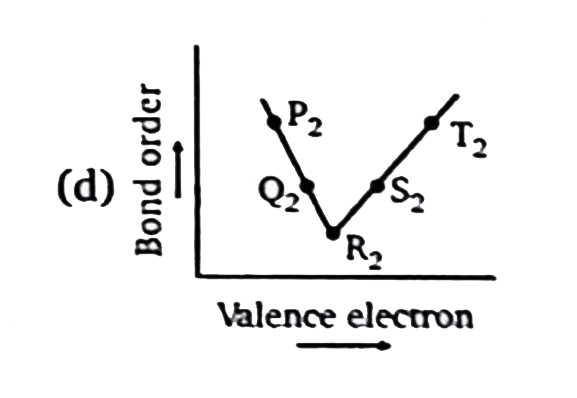
If P to T are second period p-block elements then which of the following graph show corrrect relation between valence electrons in P2→T2
The correct Answer is:A
To solve the problem, we will analyze the relationship between the number of valence electrons in the second period p-block elements (B, C, N, O, F, Ne) and their corresponding bond orders.
1. Identify the Second Period p-Block Elements:
The second period p-block elements are:
- Boron (B)
- Carbon (C)
- Nitrogen (N)
- Oxygen (O)
- Fluorine (F)
- Neon (Ne)
2. Determine the Number of Valence Electrons:
Each of these elements has the following number of valence electrons:
- Boron (B): 3 valence electrons
- Carbon (C): 4 valence electrons
- Nitrogen (N): 5 valence electrons
- Oxygen (O): 6 valence electrons
- Fluorine (F): 7 valence electrons
- Neon (Ne): 8 valence electrons
3. Determine the Bond Order for Diatomic Molecules:
The bond orders for the diatomic molecules formed by these elements are:
- B₂: Bond order = 1
- C₂: Bond order = 2
- N₂: Bond order = 3
- O₂: Bond order = 2
- F₂: Bond order = 1
- Ne₂: Bond order = 0 (Noble gas, no bond)
4. Plot the Relationship:
Now, we can plot the relationship between the number of valence electrons and bond order:
- For 3 valence electrons (B): Bond order = 1
- For 4 valence electrons (C): Bond order = 2
- For 5 valence electrons (N): Bond order = 3
- For 6 valence electrons (O): Bond order = 2
- For 7 valence electrons (F): Bond order = 1
- For 8 valence electrons (Ne): Bond order = 0
5. Analyze the Graph:
From the data, we see that as we move from Boron to Nitrogen, the bond order increases, reaching a maximum at Nitrogen. After that, as we move to Oxygen and Fluorine, the bond order decreases. This indicates a peak in bond order at Nitrogen.
6. Select the Correct Graph:
The correct graph will show an initial increase in bond order as the number of valence electrons increases, followed by a decrease after reaching the peak at Nitrogen. Therefore, the correct option is the one that illustrates this trend.
Conclusion:
The correct answer is option number one, which shows the bond order first increasing and then decreasing as the number of valence electrons increases from B to Ne.
The second period p-block elements are:
- Boron (B)
- Carbon (C)
- Nitrogen (N)
- Oxygen (O)
- Fluorine (F)
- Neon (Ne)
Each of these elements has the following number of valence electrons:
- Boron (B): 3 valence electrons
- Carbon (C): 4 valence electrons
- Nitrogen (N): 5 valence electrons
- Oxygen (O): 6 valence electrons
- Fluorine (F): 7 valence electrons
- Neon (Ne): 8 valence electrons
The bond orders for the diatomic molecules formed by these elements are:
- B₂: Bond order = 1
- C₂: Bond order = 2
- N₂: Bond order = 3
- O₂: Bond order = 2
- F₂: Bond order = 1
- Ne₂: Bond order = 0 (Noble gas, no bond)
Now, we can plot the relationship between the number of valence electrons and bond order:
- For 3 valence electrons (B): Bond order = 1
- For 4 valence electrons (C): Bond order = 2
- For 5 valence electrons (N): Bond order = 3
- For 6 valence electrons (O): Bond order = 2
- For 7 valence electrons (F): Bond order = 1
- For 8 valence electrons (Ne): Bond order = 0
From the data, we see that as we move from Boron to Nitrogen, the bond order increases, reaching a maximum at Nitrogen. After that, as we move to Oxygen and Fluorine, the bond order decreases. This indicates a peak in bond order at Nitrogen.
The correct graph will show an initial increase in bond order as the number of valence electrons increases, followed by a decrease after reaching the peak at Nitrogen. Therefore, the correct option is the one that illustrates this trend.
The correct answer is option number one, which shows the bond order first increasing and then decreasing as the number of valence electrons increases from B to Ne.
Topper's Solved these Questions
- CHEMICAL BONDING (ADVANCED)BOOK - VK JAISWAL ENGLISHCHAPTER - CHEMICAL BONDING (ADVANCED)EXERCISE - Level 3
77 Videos
- CHEMICAL BONDING (ADVANCED)BOOK - VK JAISWAL ENGLISHCHAPTER - CHEMICAL BONDING (ADVANCED)EXERCISE - ONE OR MORE ANSWER IS/ARE CORRECT
78 Videos
- CHEMICAL BONDING (ADVANCED)BOOK - VK JAISWAL ENGLISHCHAPTER - CHEMICAL BONDING (ADVANCED)EXERCISE - SUBJECTIVE PROBLEMS
64 Videos
- CHEMICAL BONDING (BASIC)BOOK - VK JAISWAL ENGLISHCHAPTER - CHEMICAL BONDING (BASIC)EXERCISE - SUBJECTIVE PROBLEMS
54 Videos
Similar Questions
Knowledge Check

The table above shows the population growth of certain bacteria over four seconds. Which one of the following equations shows the relationship between t and p, according to the table?Ap=3tBp=2t2Cp=2×3tDp=2×3t−1
In the given (V-T) diagram, what is the relation between pressure P1andP2 ?
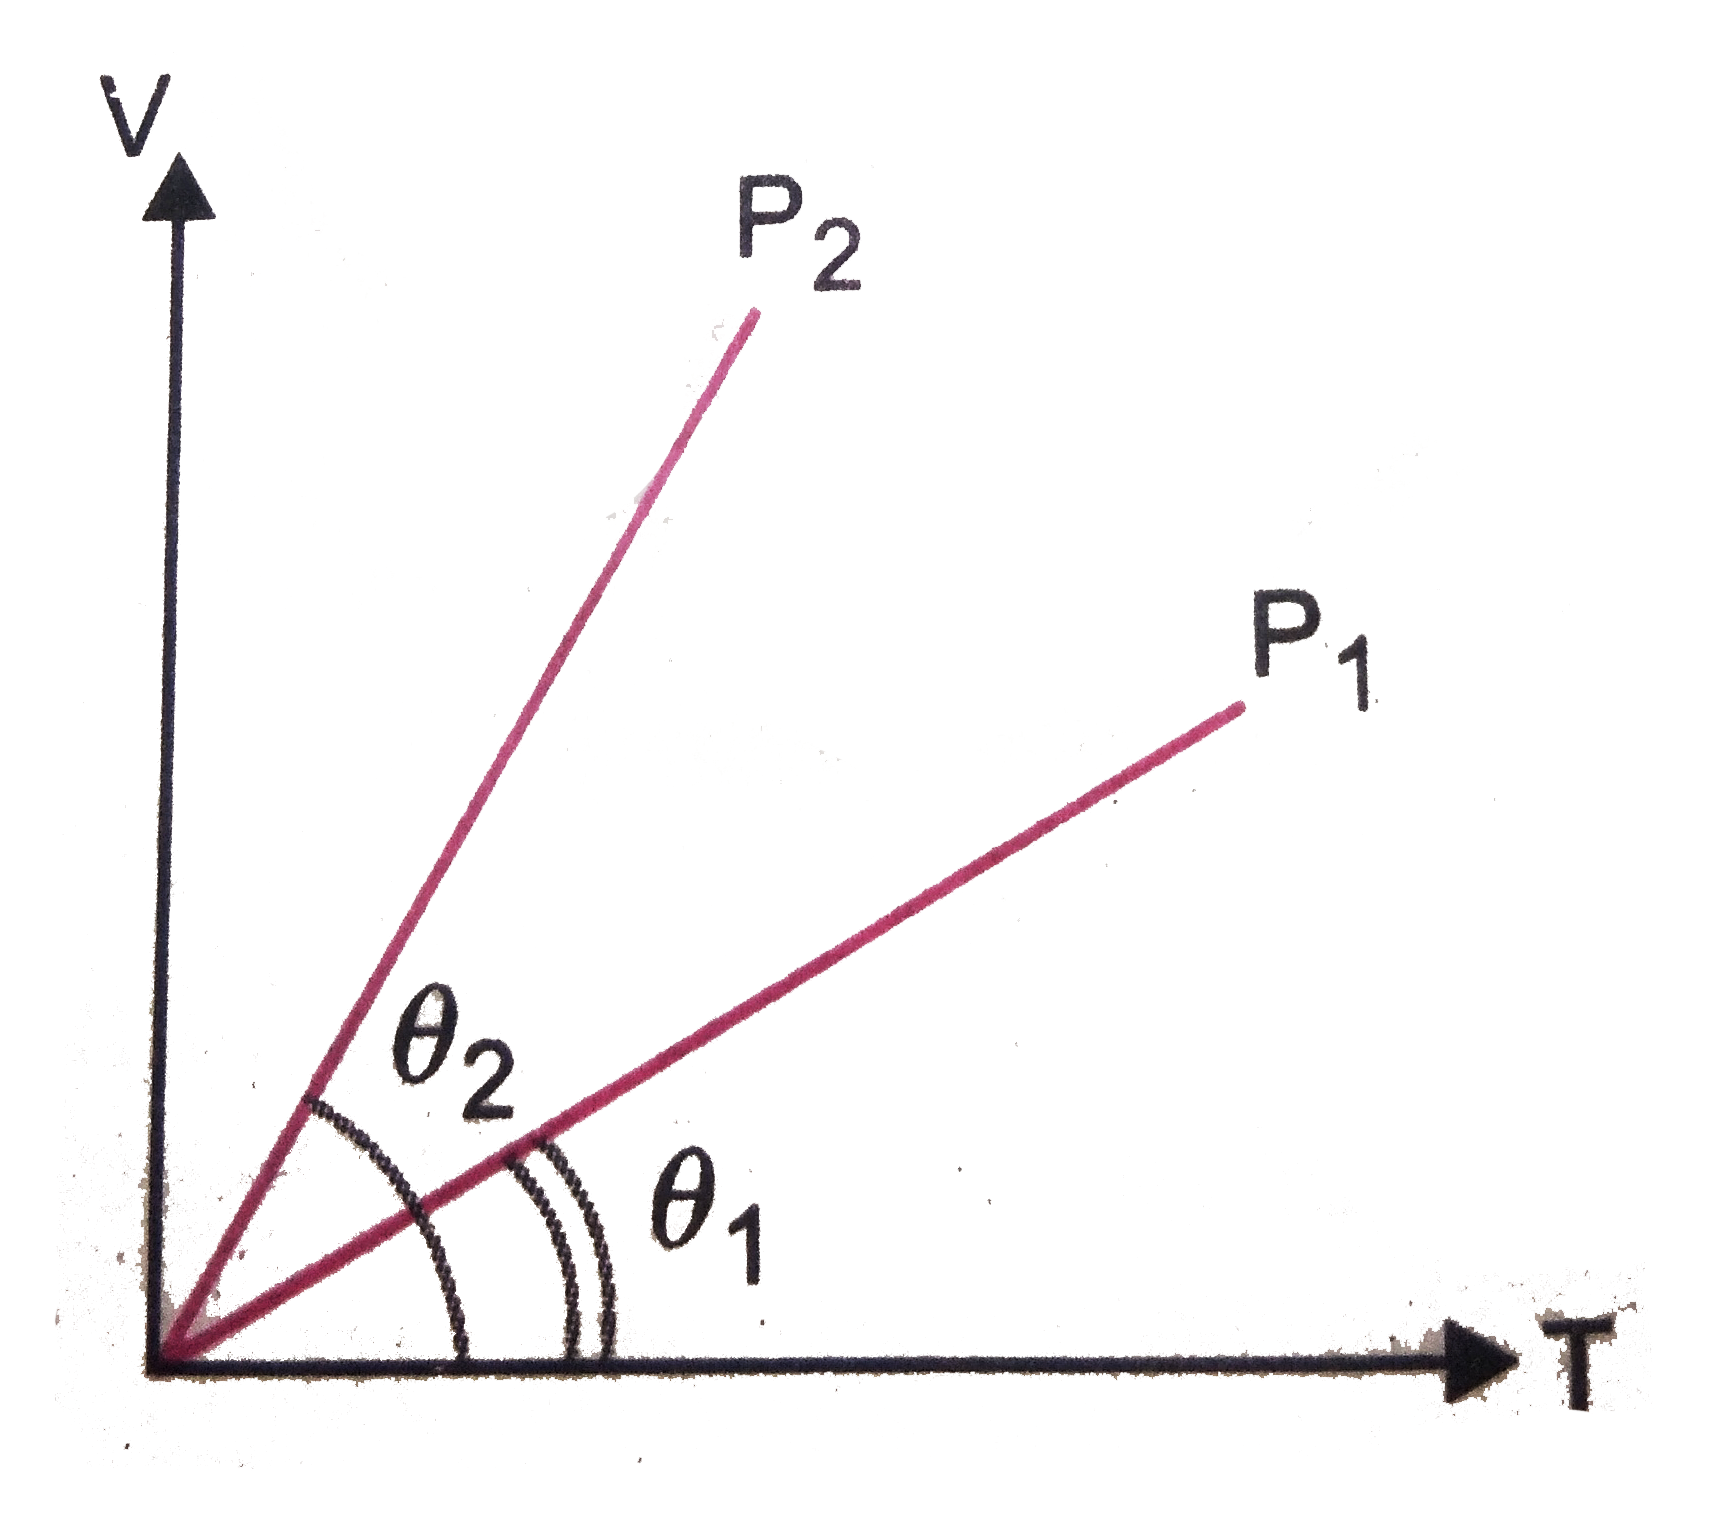
View SolutionIn the given (V-T) diagram, what is the relation between pressure P1andP2 ?

View SolutionIn the given (V-T) diagram, what is the relation between pressure P1andP2 ?

View SolutionWhat are p-block elements? Give their general
electronic configuration.
View SolutionIf P.T would have contained 10 periods, maximum elements in that P.T. would be :-
View SolutionIn s- and p-block elements the OS. changes in 2 units, but in transition elements it changes it chnages in units of one.(T/F)
View Solutionp block elements of 6th period are represented as :-
View Solution
