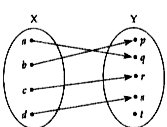
Which of the following arrow diagrams represents a function from Xto Y?
A
B
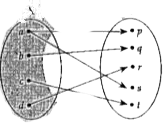
C
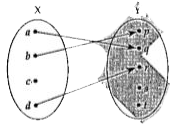
D
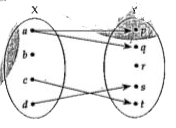
Video Solution
Text Solution
The correct Answer is:A
|
Answer
Step by step video, text & image solution for Which of the following arrow diagrams represents a function from Xto Y? by Maths experts to help you in doubts & scoring excellent marks in Class 11 exams.
Updated on:21/07/2023Topper's Solved these Questions
- RELATION AND FUNCTIONSBOOK - ICSECHAPTER - RELATION AND FUNCTIONSEXERCISE - MULTIPLE CHOICE QUESTIONS (Choose the correct answer from the given four options in questions)
32 Videos
- QUADRATIC EQUATIONSBOOK - ICSECHAPTER - QUADRATIC EQUATIONSEXERCISE - CHAPTER TEST
24 Videos
- RELATIONS AND FUNCTIONSBOOK - ICSECHAPTER - RELATIONS AND FUNCTIONSEXERCISE - EXERCISE 2 (g)
37 Videos
Similar Questions
Knowledge Check
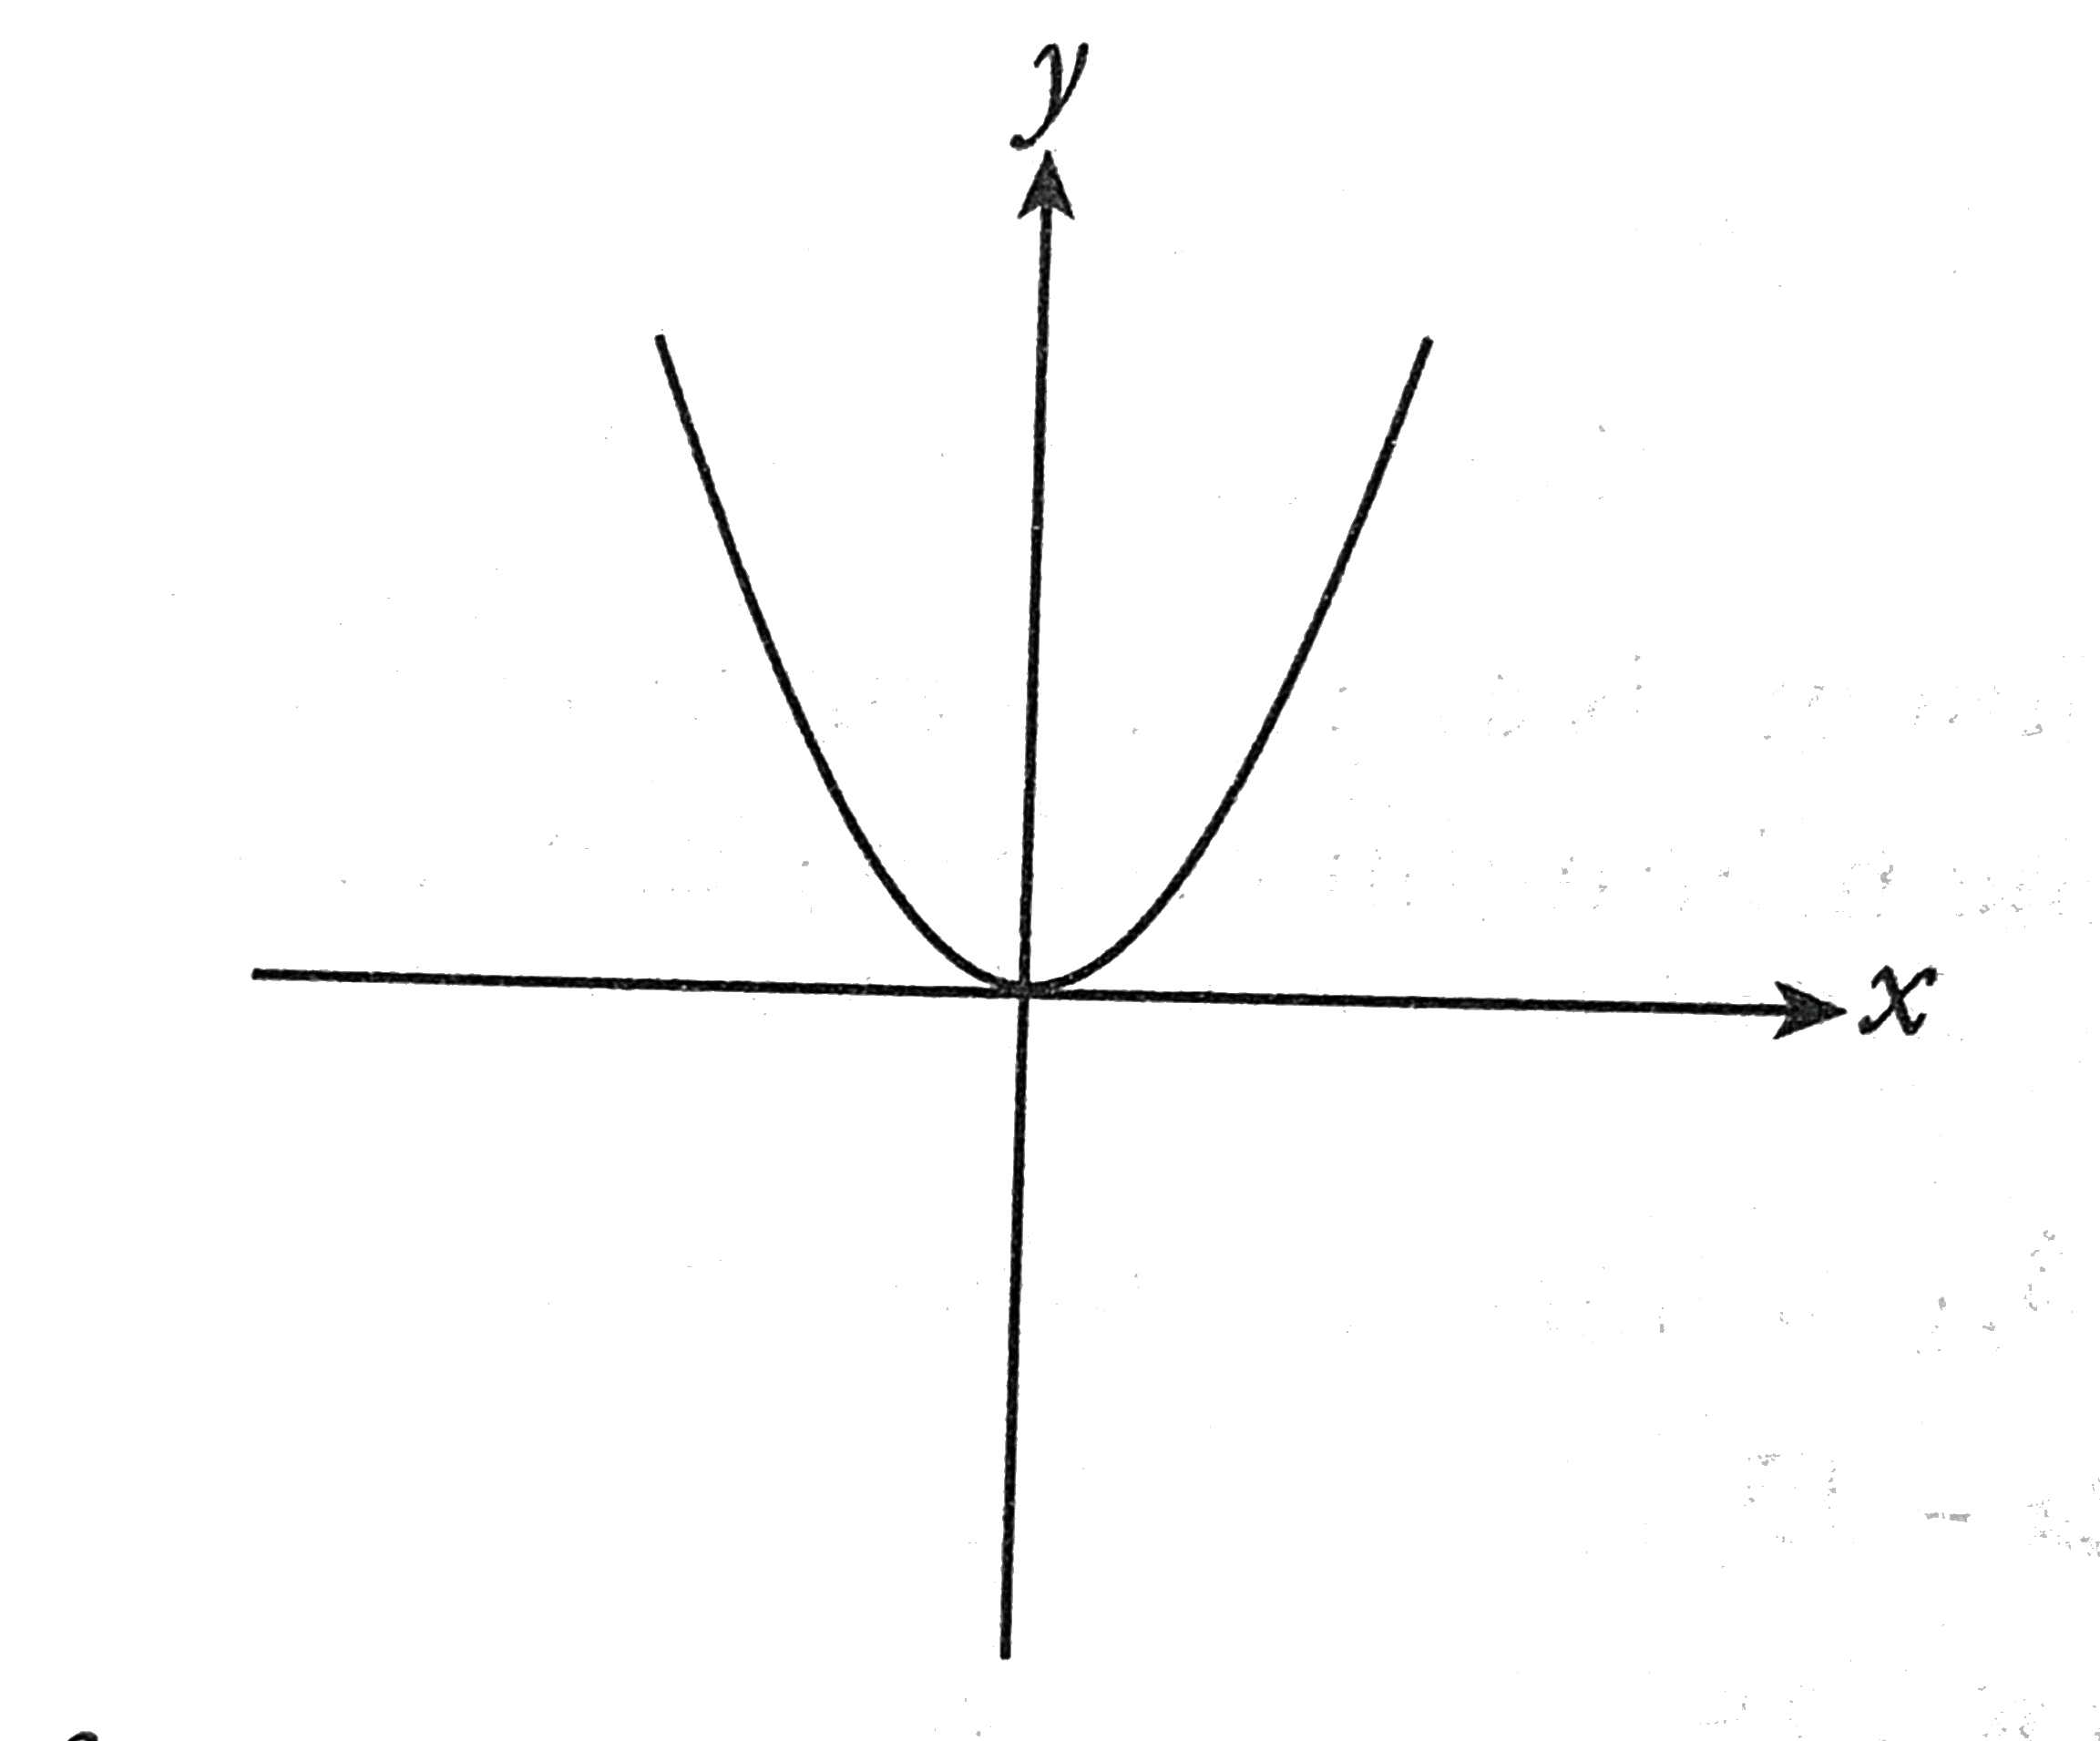
The quadratic y=f(x) is shown above. Which of the following graphs represents the function y=f(x+3)−4?A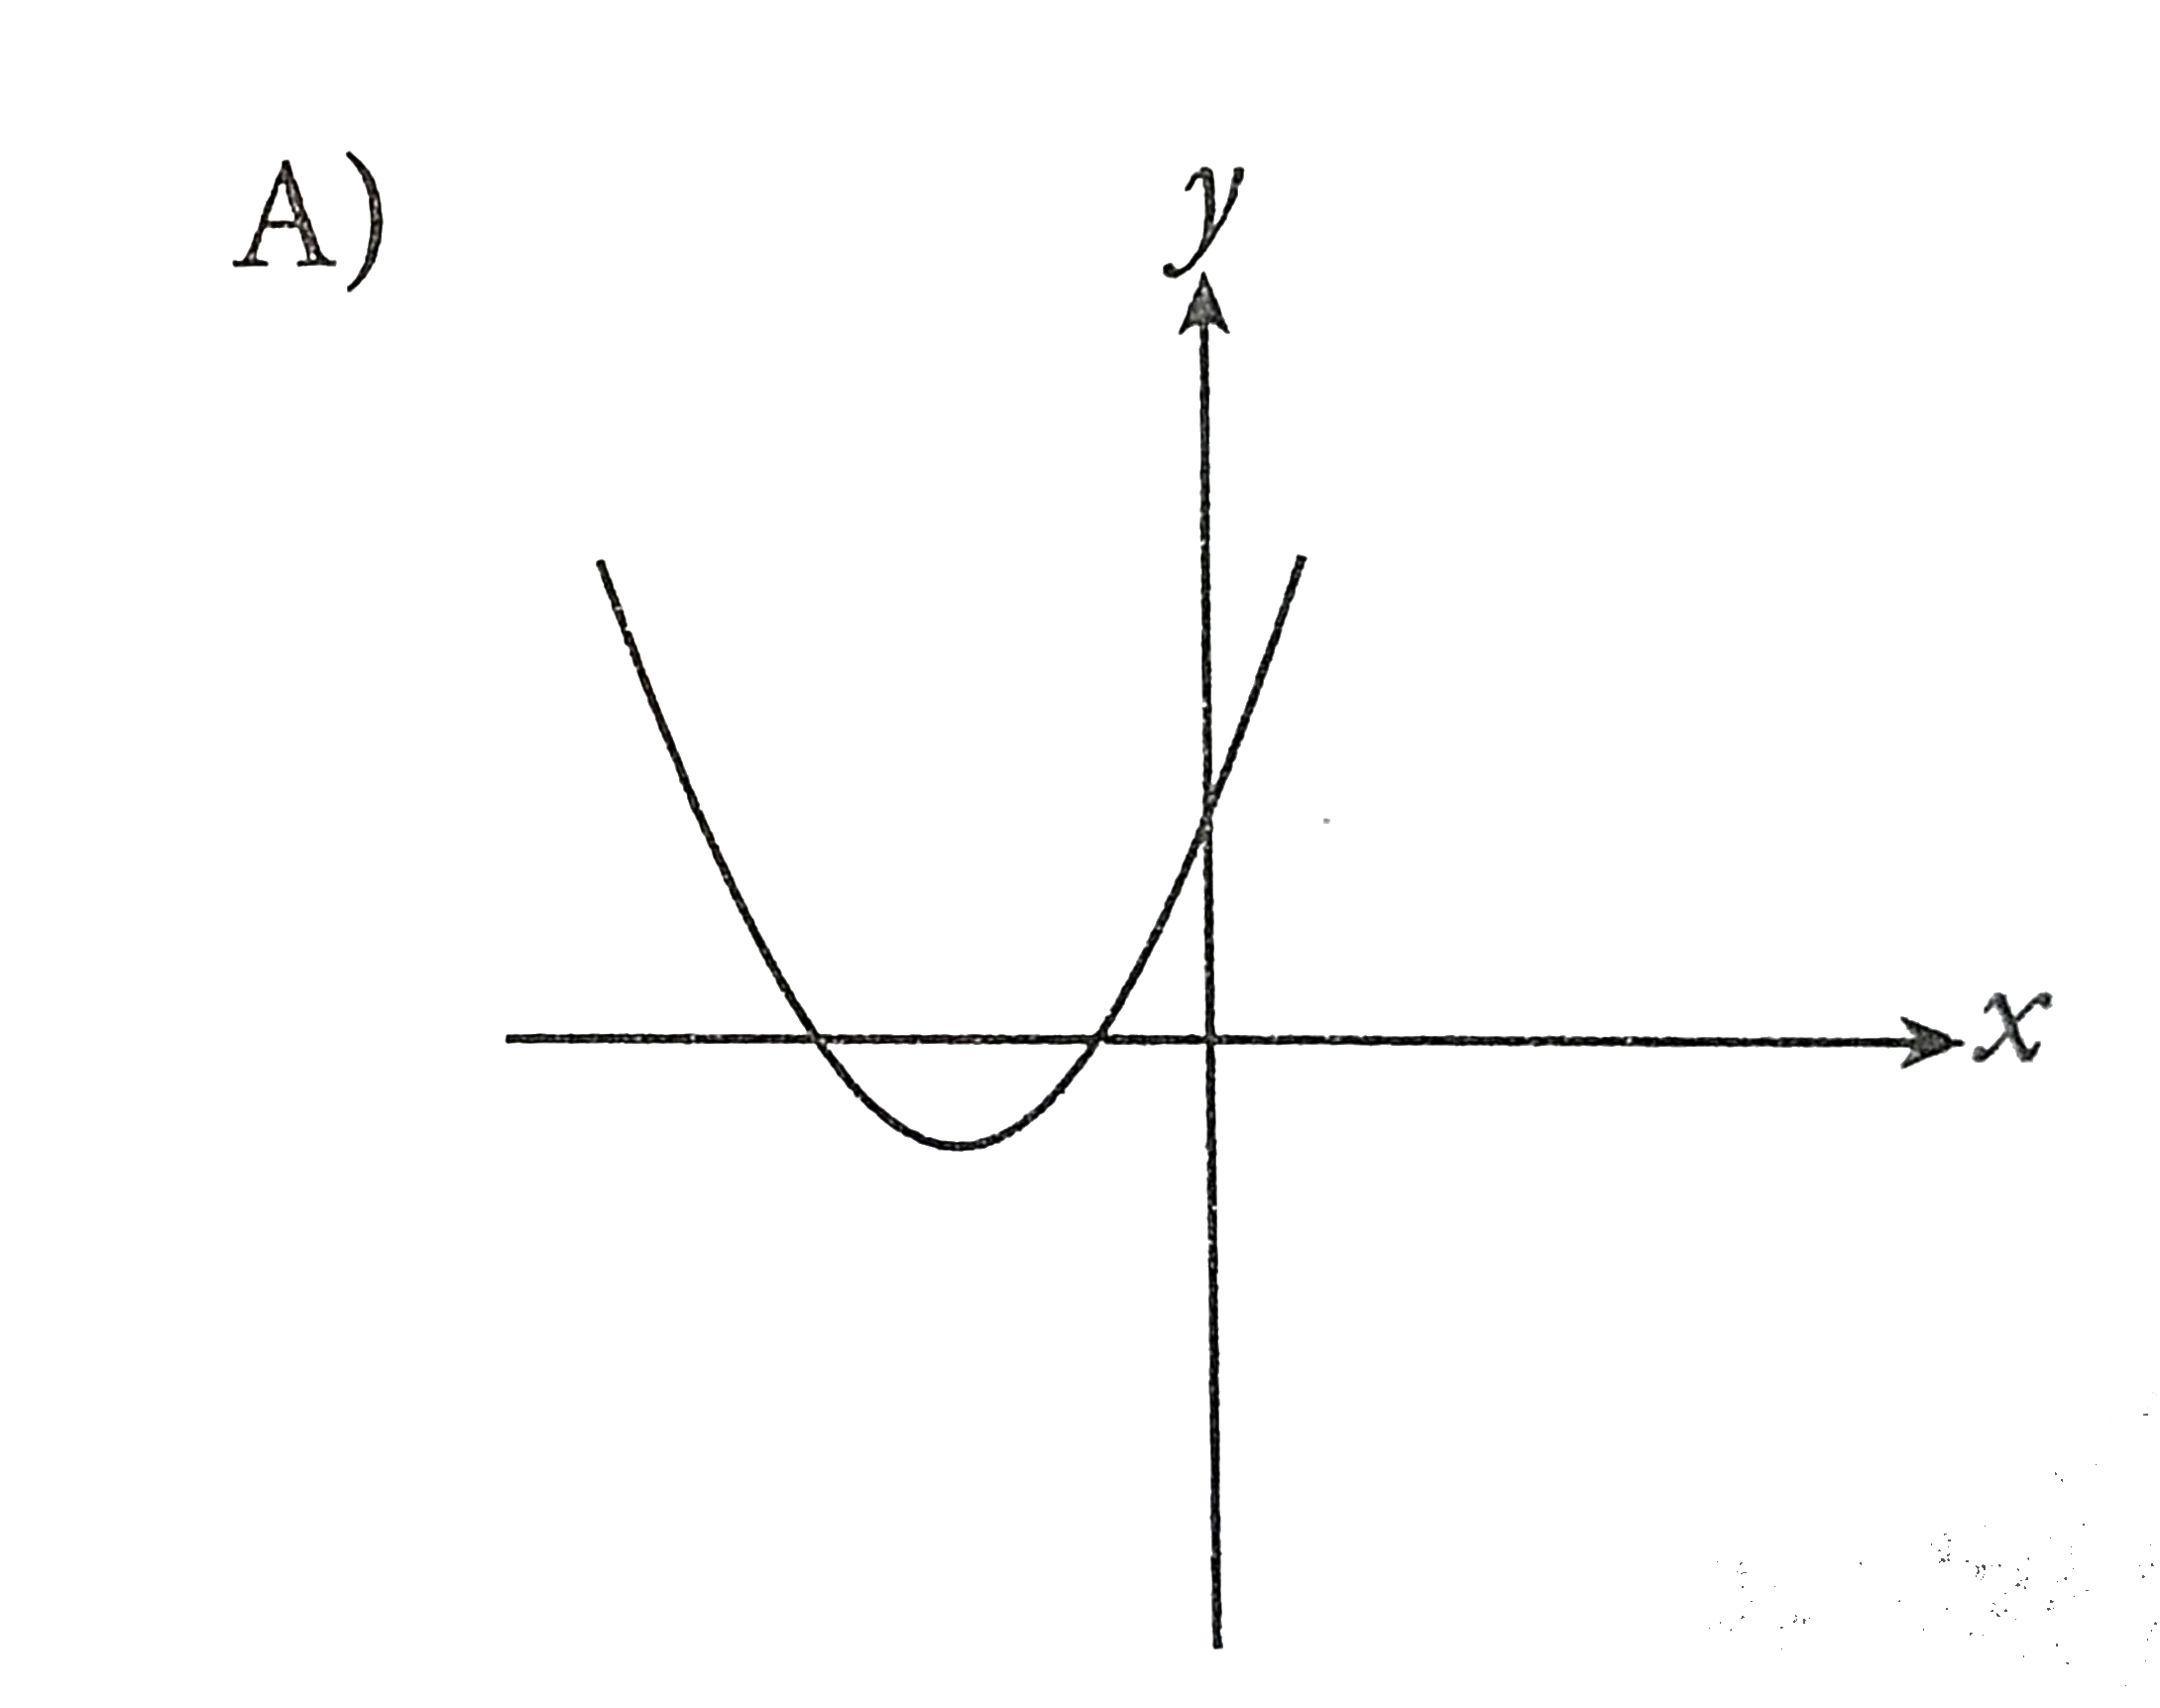 B
B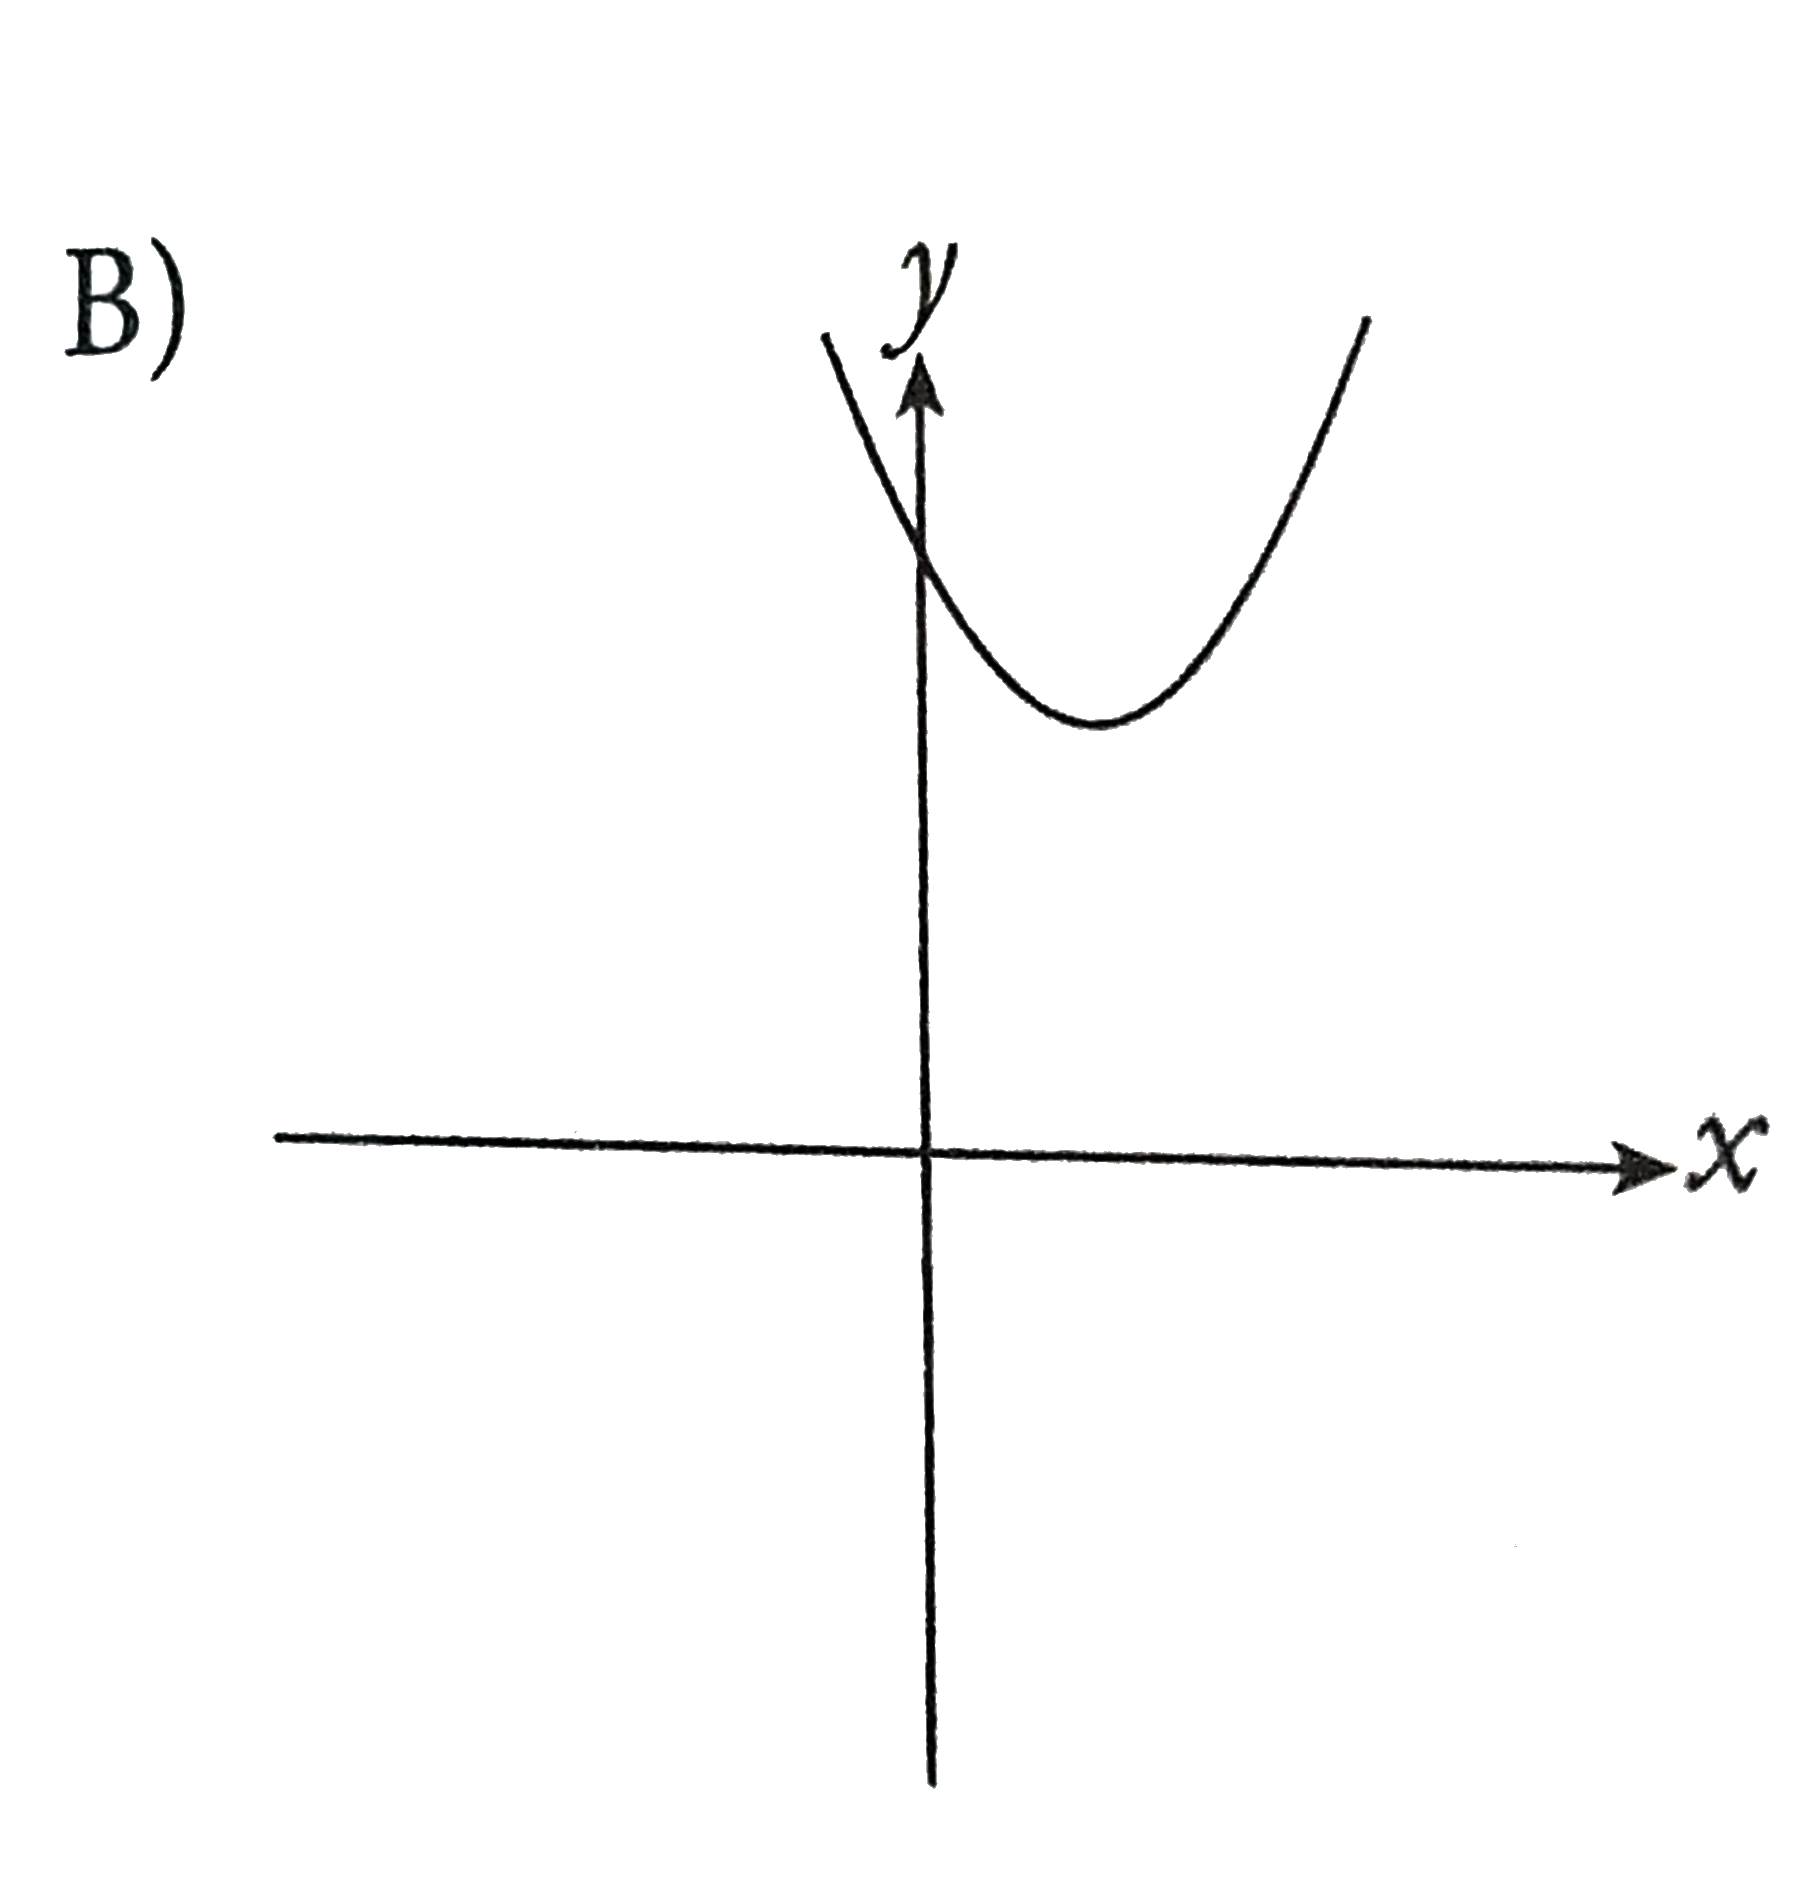 C
C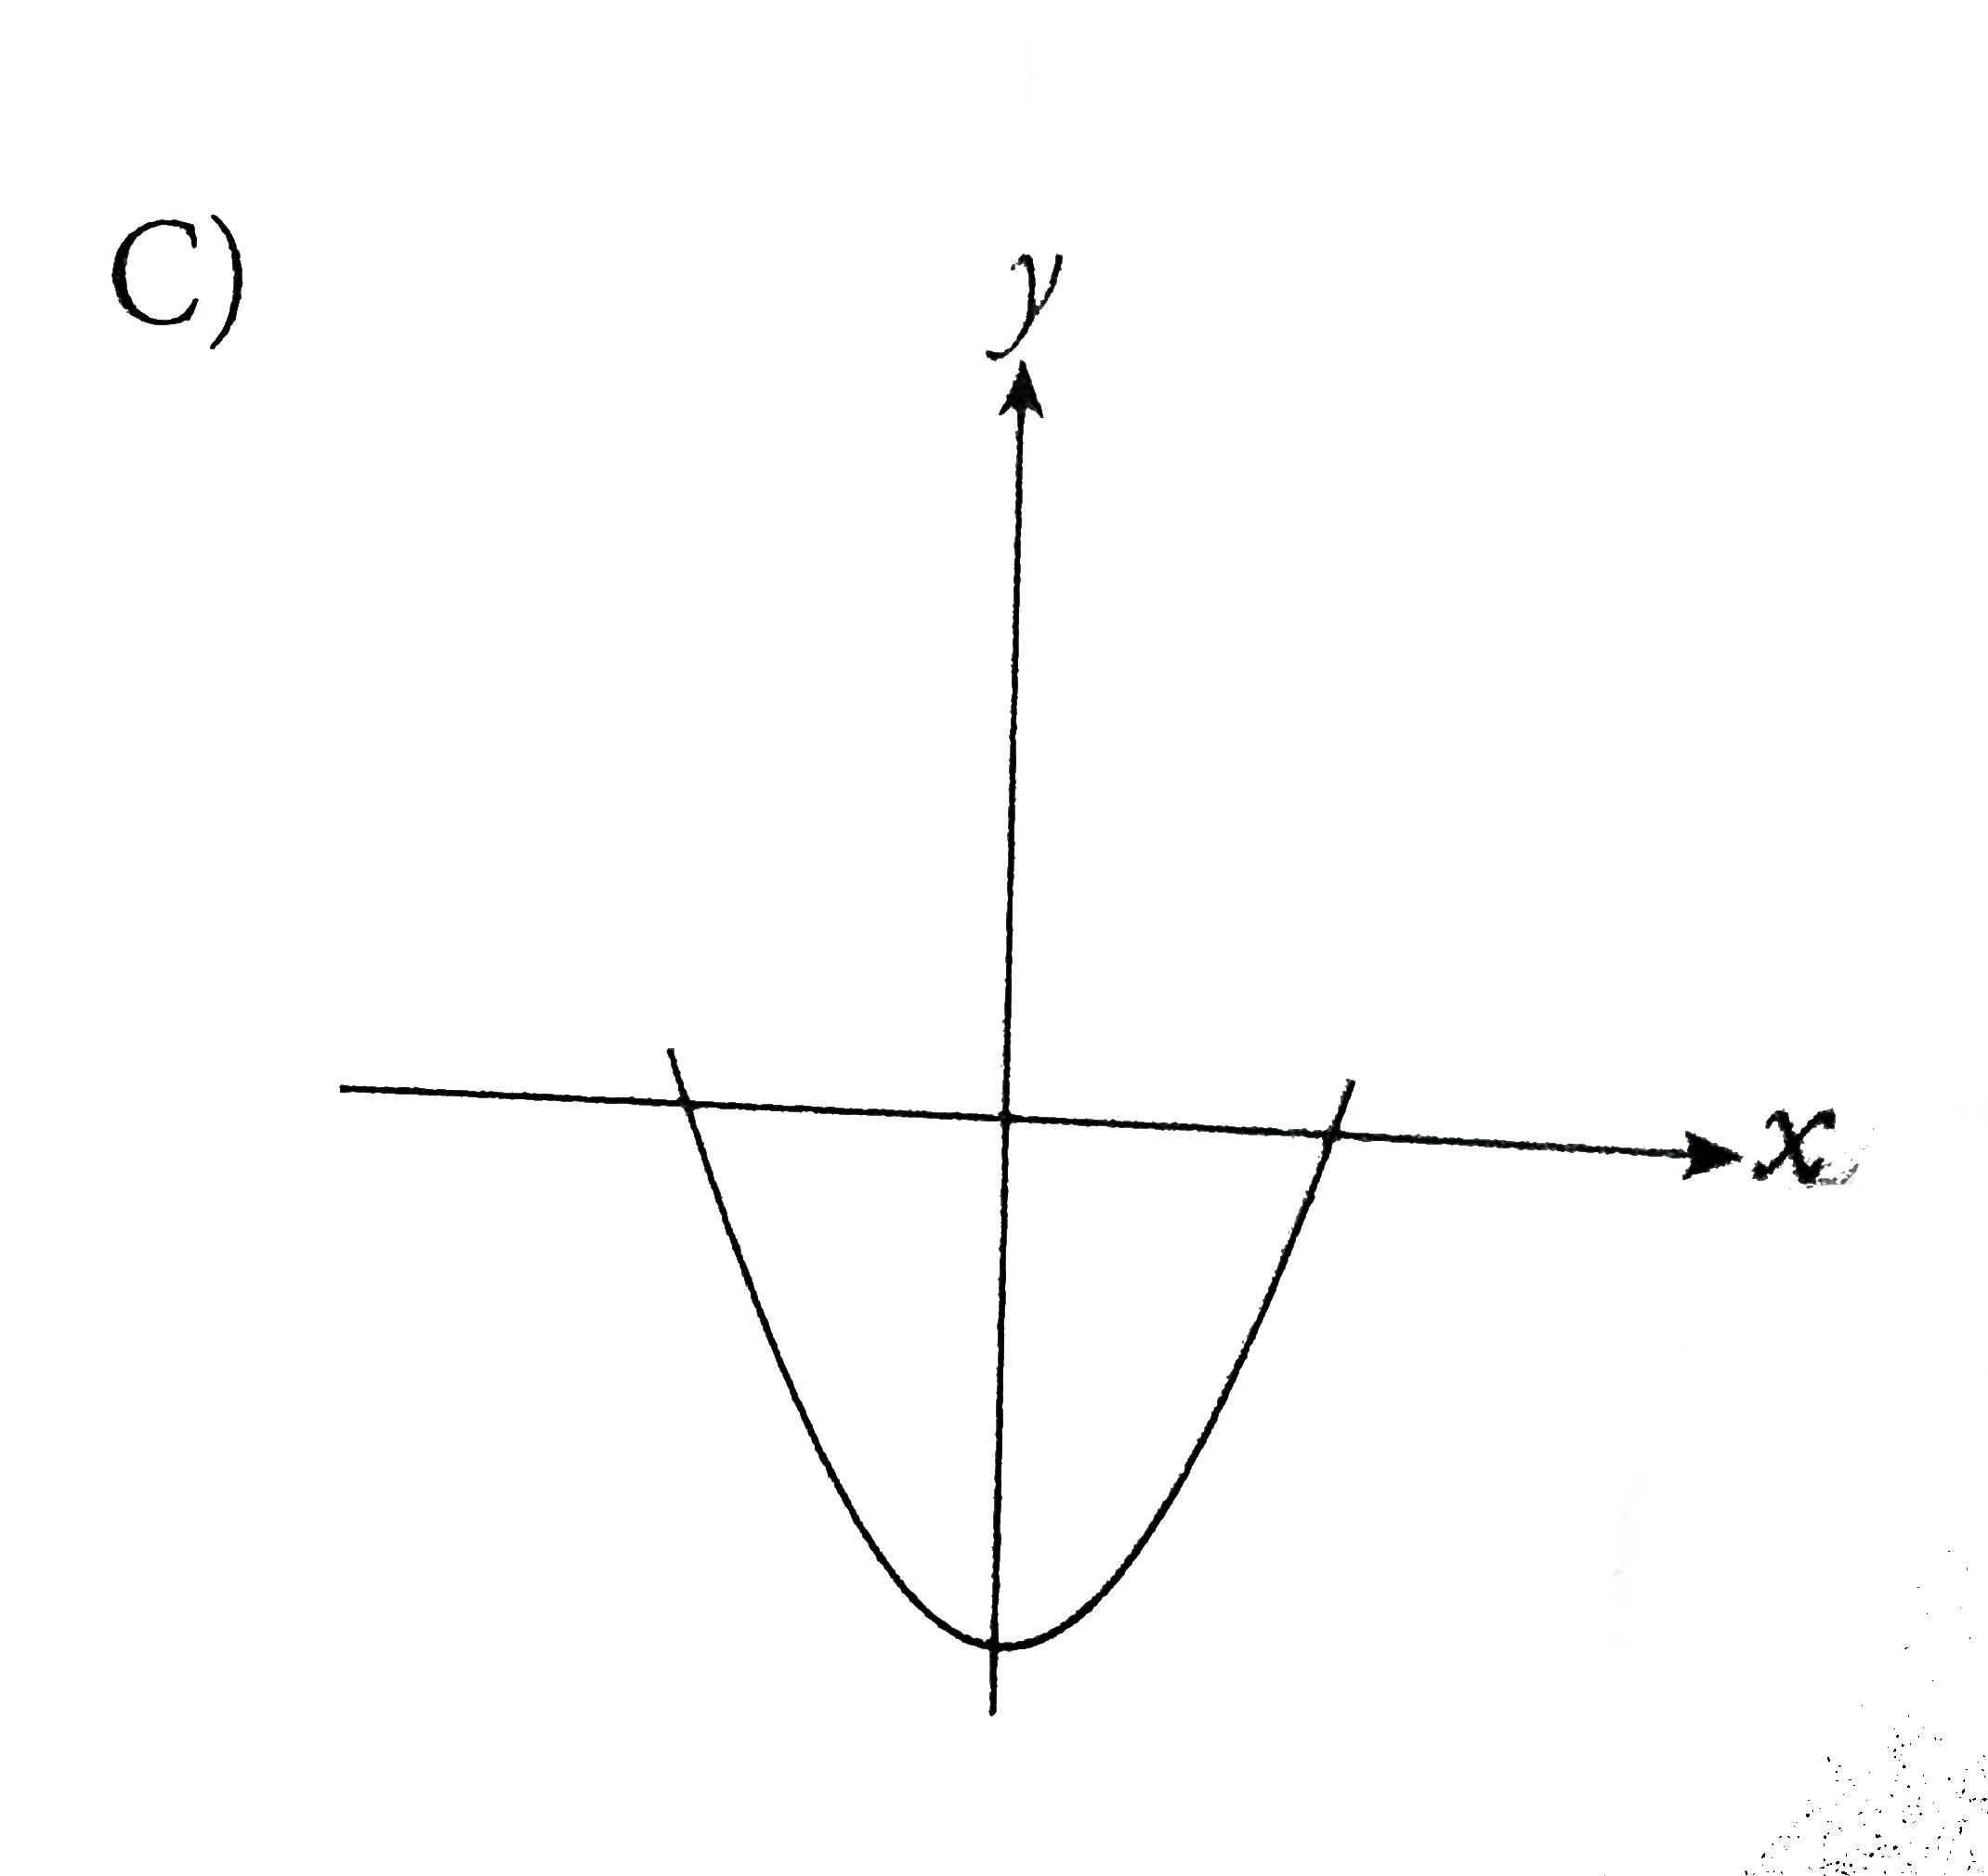 D
D
Which of the following diagrams does not represent a streamline flow?
A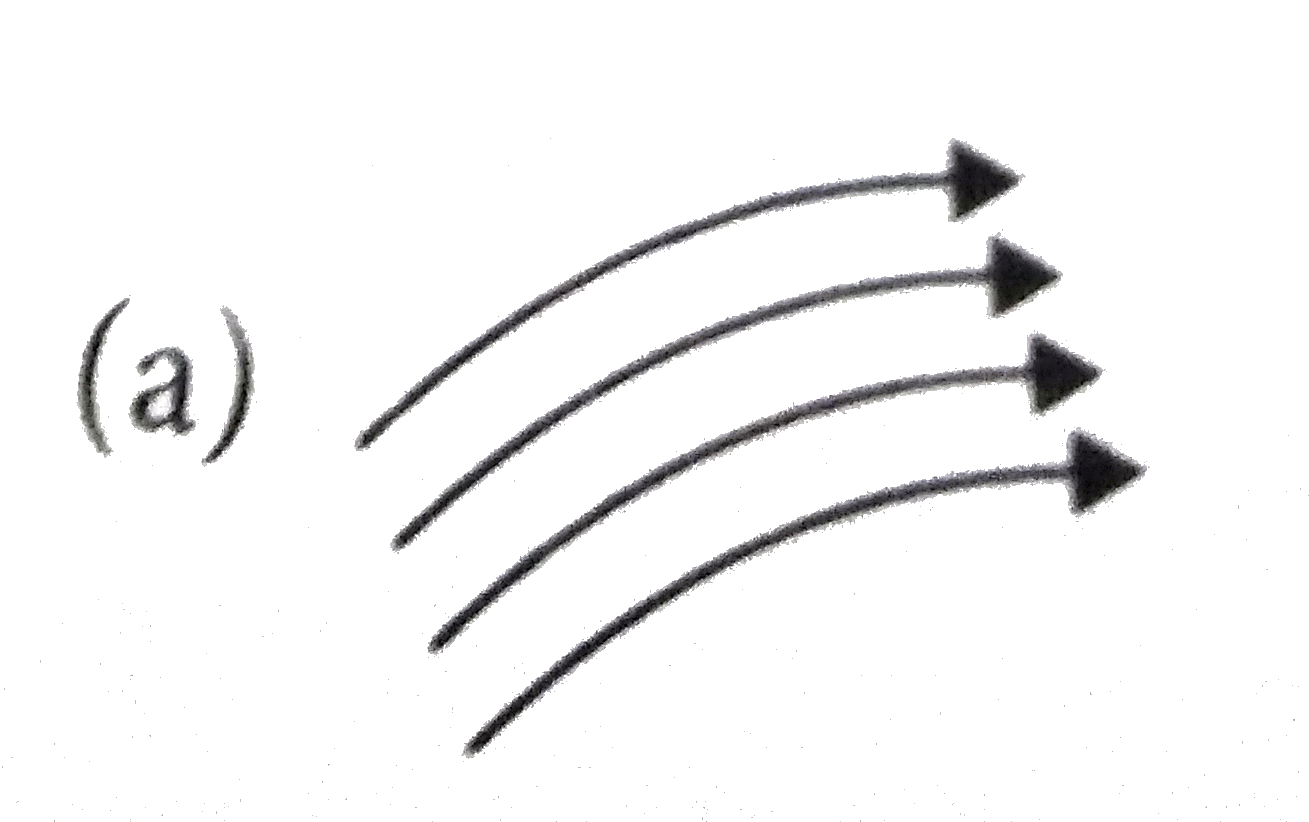 B
B C
C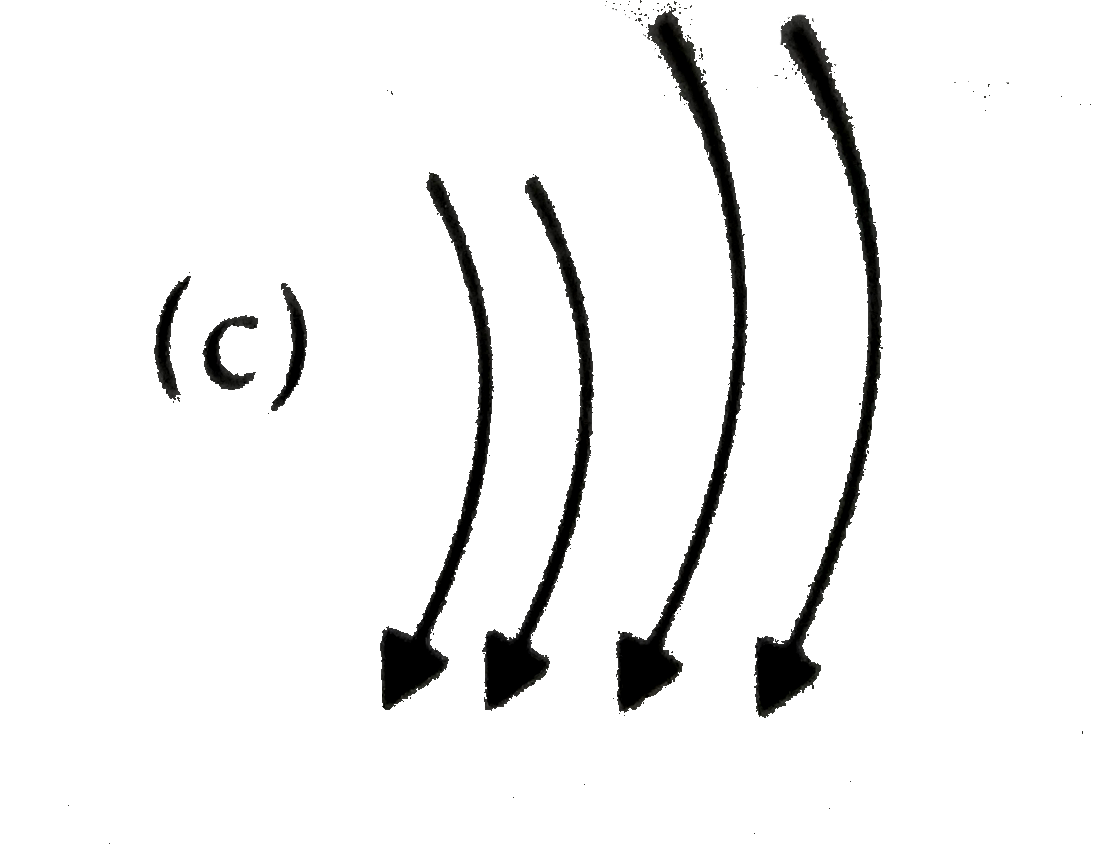 D
D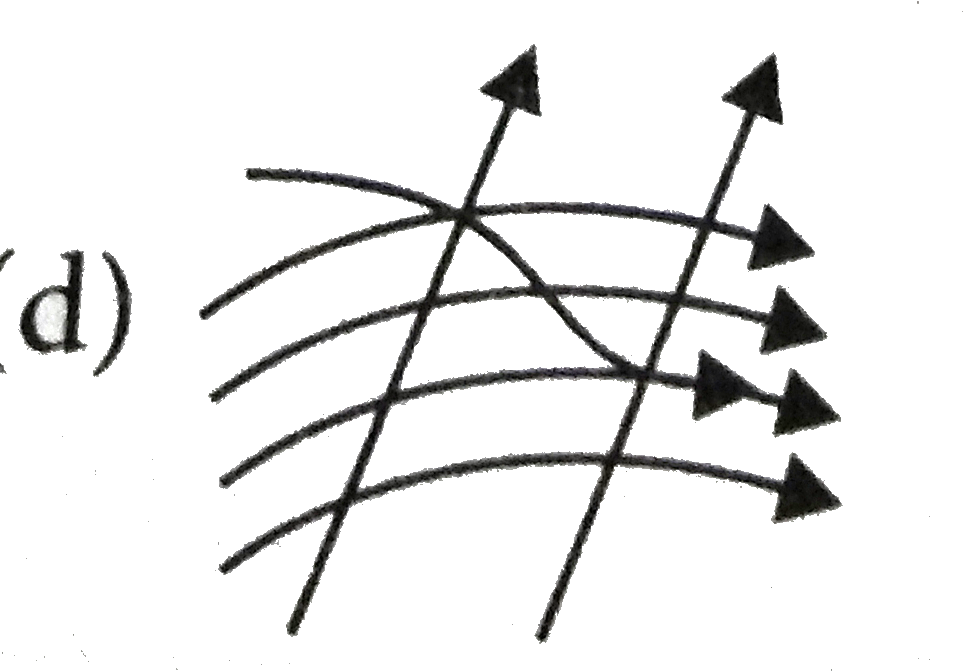
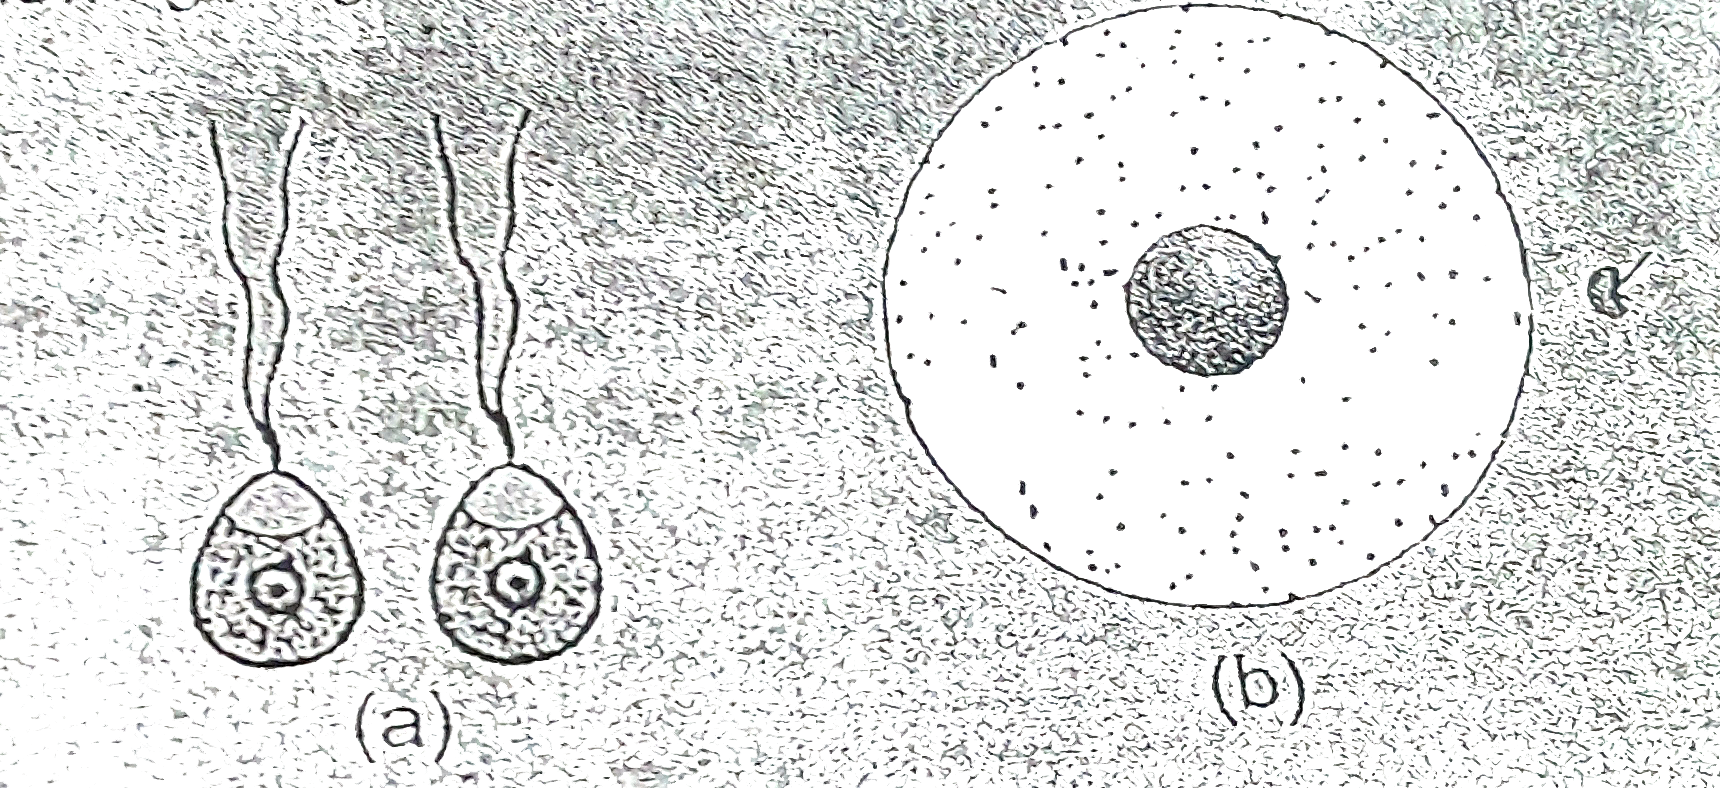
What does the following diagram represent ?
View SolutionWhich one of the following graphs represent a function? (FIGURE)
View SolutionWhich of the following diagrams does not represent a streamline flow?
View SolutionWhich one of the following diagrams represents the placentation in Dianthus
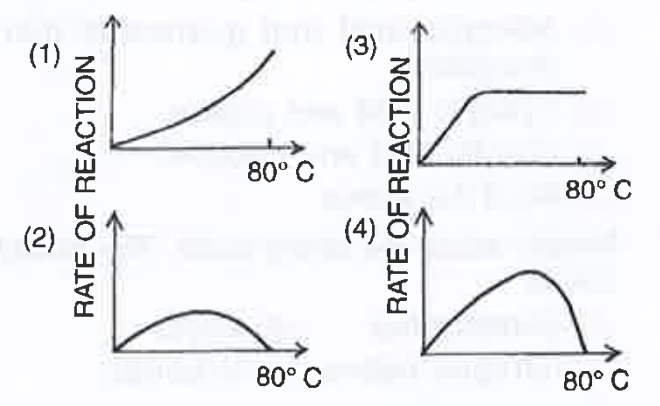
View SolutionWhich one of the following diagrams represents the most common relationships between temperature and enzyme activity, when the temperature is raised gradually from 0- 80∘ C?
View SolutionWhich of the following can represent a linear function for each x∈R ?
View Solution
