Draw a plot showing the variation of (i) electric field (E ) and (ii) electric potential (V) with distance r due to a point charge Q.
From the relation , draw the graph.
Similar Questions
The electric field and the electric potential at a point are E and V respectively.
View SolutionShow on a plate the nature of variation of the (i) Electric field (ii) potenital (V), of a (small) electric dipole with the distance (r) of the filed point from the centre of the dipole.
View SolutionDraw a plot showing variation of electric field with distance from the centre of a solid conducting sphere of radius R, having of + Q on its surface.
View SolutionIntensity of an electric field (E) depends on distance r due to a dipole, is related as
View SolutionPlot a graph comparing the variation of potential ‘V’ and electric field ‘E’ due to a point charge ‘Q’ as a function of distance r from point charge
(ii) Find the ratio of the potential differences that must be applied across the parallel and the series combination of two identical capacitors so that the energy stored, in the two cases, becomes the same.
View SolutionObtain an expression for electric potential .V due to a point charge .Q at a distance r.
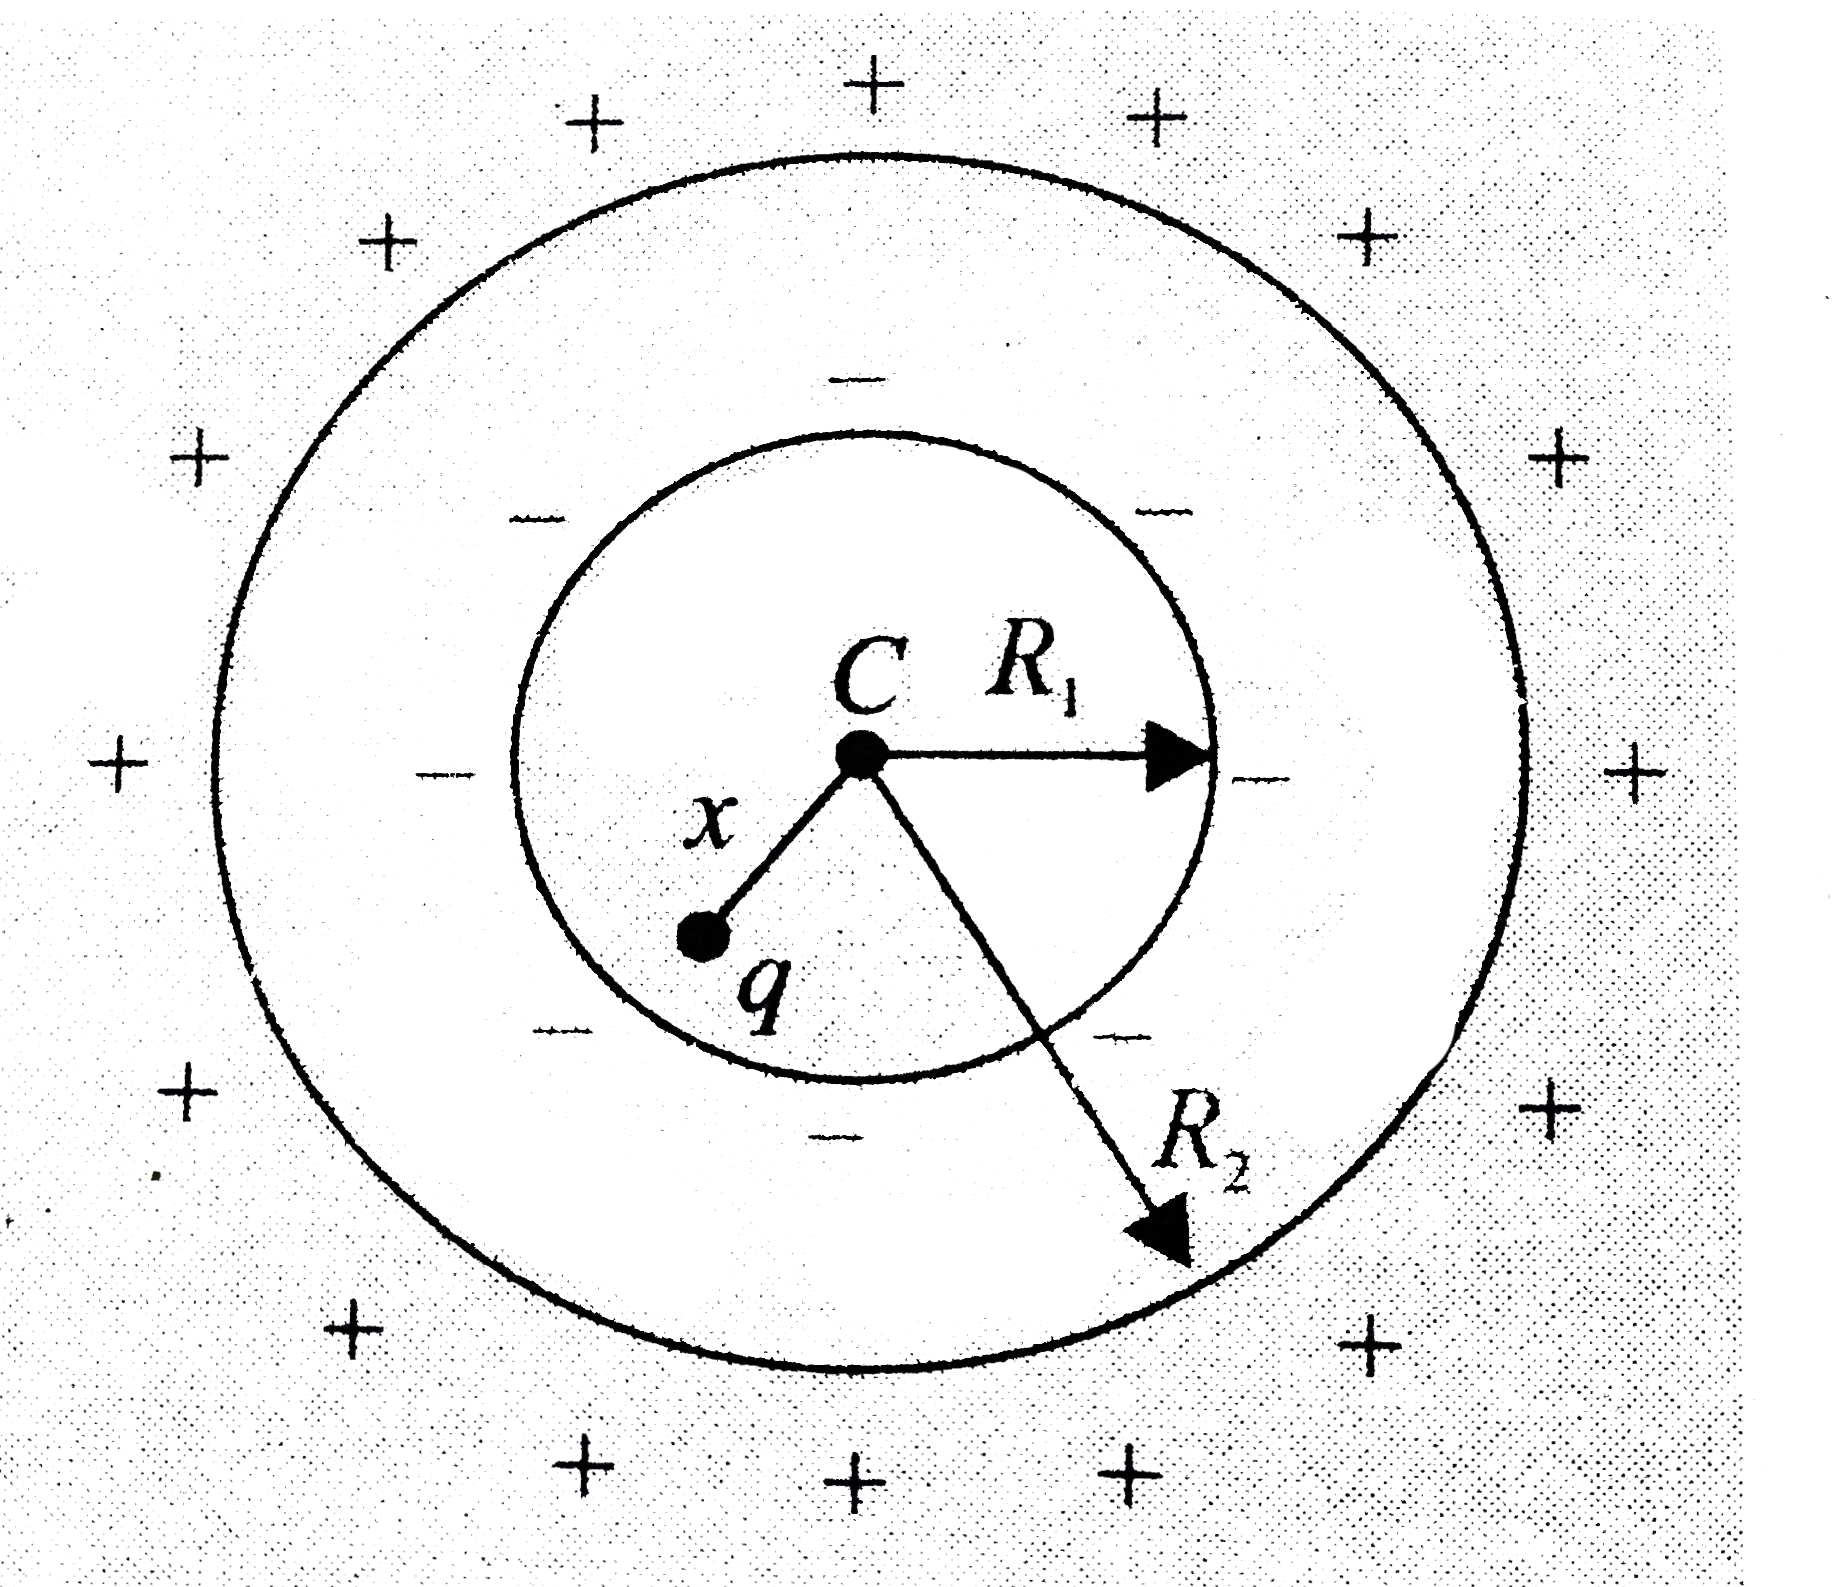
View SolutionInside a conducting hollow sphere of inner radius R1 and outer radius R2, a point charge q is placed at a distance x from the center as shown in fig. Find.
 .
.
(i) electric potential at C
(ii) electric field and potential at a distance r from the center outside the shell.
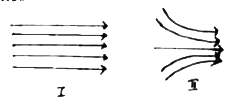
View SolutionDrawings I and II show two samples of electric field lines

View SolutionUsing Gauss' law deduce the expression for the electric field due to a uniformly charged sperical conducting shell of radius R at a point (i) outside and (ii) inside the shell.
Plot a graph showing variation of electric field as a function of r>Randr<R. (r being the distance from the centre of the shell)
View SolutionDerive an expression for electric field intensity at a point due to point charge.
View Solution
