The marks obtained by a student in his annual examination in various subjects are given below:
SubjectHindiMathematicsEnglishScienceS.StudiesMarks obtained6440528036
Represent the above data by a bar graph.
The correct Answer is:σx×100
Step by step video, text & image solution for The marks obtained by a student in his annual examination in various subjects are given below: {:("Subject","Hindi","Mathematics","English","Science","S.Studies"),("Marks obtained",64,40,52,80,36):} Represent the above data by a bar graph. by Maths experts to help you in doubts & scoring excellent marks in Class 11 exams.
Updated on:21/07/2023Topper's Solved these Questions
- SELF ASSESSMENT PAPER 2 BOOK - ICSECHAPTER - SELF ASSESSMENT PAPER 2 EXERCISE - SECTION B QUESTIONS
10 Videos
- SELF ASSESSMENT PAPER 2 BOOK - ICSECHAPTER - SELF ASSESSMENT PAPER 2 EXERCISE - SECTION C QUESTIONS
8 Videos
- SELF ASSESSMENT PAPER 1BOOK - ICSECHAPTER - SELF ASSESSMENT PAPER 1EXERCISE - SECTION C
10 Videos
- SELF ASSESSMENT PAPER 3BOOK - ICSECHAPTER - SELF ASSESSMENT PAPER 3EXERCISE - SECTION C
10 Videos
Similar Questions
The percentage of marks obtained by a student in different subjects are given below.
SubjectHindiScienceEnglishMathematicsSocial StudiesPercentage of3560157540marks obtained
Draw a bar graph representing the above data.
View SolutionThe marks obtained by 12 students in an examination (out of 50) are given below:
18, 35, 2, 27, 40, 0, 21, 33, 27, 8, 36, 23
Find the mean marks.
View SolutionThe marks obtained by 30 students in a class assessment of 5 subjects is given below :

Calculate the mean, median and mode of the above distribution.
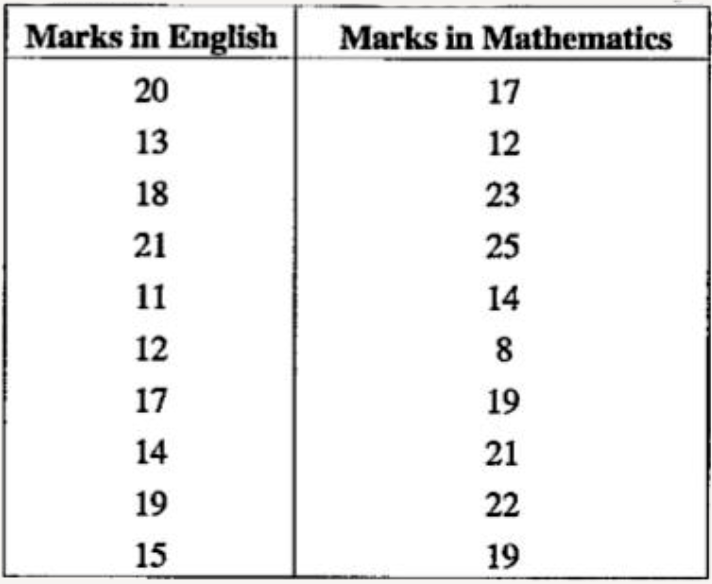
View SolutionThe marks obtained by 10 candidates in English and Mathematics are given below:

Estimate the probable score for Mathematics if the marks obtained in English are 24.
View SolutionThe marks obtained by 32 students of a class are given below. Prepare a frequency table with class intervals 31−40,41−50,….. etc.

View SolutionThe marks obtained (out of 100) by a class of 80 students are given below:

Construct a histogram to represent the data above
View SolutionObserve this bar graph which shows the marks obtained by Aziz in half-yearly examination in different subjects.
View SolutionThe percentage of marks obtained, in different subjects by Ashok Sharma (in an examination) are given below. Draw a bar graph to represent it.

View SolutionThe mean and standard deviation of marks obtained by 50 students of a class in there subjects, mathematics, physics and chemistry are given below: Subject Mathematics Physics Chemistry Mean 42 32 40.9 Standard Deviation 12 15 20 Which of the three subjects shows the highest variability in marks and which shows the lowest?
View SolutionThe frequency distribution of marks obtained by 28 students in a test carrying 40 marks is given below:
Marks:0−1010−2020−3030−40Number of students:6xy6
If the mean of the above data is 20, then the difference between x and y is
View Solution
